

Abstract
T cells are important mediators of autoimmune inflammation in relapsing remitting multiple sclerosis (RRMS). Previous studies found that deferiprone, an iron chelator, suppressed disease activity in a mouse model of multiple sclerosis, and inhibition of T cell proliferation was implicated as a putative mechanism. The objective of the present study was to examine the effects of deferiprone on suppressing in vitro responses of T cells from control and RRMS subjects. Peripheral blood T cells were co-stimulated with anti-CD3 + anti-CD28 and cultured with or without interleukin 2 (IL-2). Proliferating CD4+ T cells from control and RRMS subjects, cultured with or without IL-2, decreased in response to 75 μM deferiprone, although the extent of decreased proliferation of CD4+ T cells from RRMS subjects was less than for control subjects. Proliferating CD8+ T cells from control subjects, cultured with or without IL-2, also decreased in response to 75 μM deferiprone, and this decrease was seen in proliferating CD8+ T cells from RRMS cultured with IL-2. CD4+CD25+ and CD8+CD25+ cells from control subjects, cultured with or without IL-2, declined in 75 M deferiprone, but the decrease was smaller than for the CD4+ and CD8+ proliferative responses. CD4+CD25+ and CD8+CD25+ cells from RRMS subjects showed more variability than for control subjects, but CD4+CD25+ cultured with IL-2 and CD8+CD25+ cells cultured without IL-2 significantly declined in 75 μM deferiprone. CD4+FoxP3+ and CD4+CD25+FoxP3+ cells tended to remain constant or increase. In summary, deferiprone induced declines in proliferative responses at a dosage that is within peak serum pharmacological concentrations.
Keywords: CD4 T cells, CD8 T cells, Regulatory T cells, T cell proliferation, Multiple sclerosis, Deferiprone
1. Introduction
There is a scarcity of efficacious treatment options for disease exacerbations during relapsing-remitting multiple sclerosis (RRMS). The most common intervention is a steroid, e.g., methylprednisolone delivered via the oral or intravenous route. Corticosteroids hasten recovery from a relapse [1], but do not lower the rate of new exacerbations or lessen the progression of long-term disability [2]. Side effects from corticosteroid therapy include hyperglycemia, hypokalemia, ankle swelling, facial flushing, insomnia, psychiatric changes, bone loss and gastric disturbances [1,3–5].
For patients that do not respond or who cannot tolerate corticosteroids, other interventions can be considered such as plasma exchange or intravenous immunoglobulin [5,6]. However, these treatments are very expensive and time consuming, and have limited effectiveness [1].
The lack of efficacious secondary treatment options, the occurrence of side effects attributable to corticosteroids, and the failure of corticosteroids to lessen subsequent relapses or alter the disease progression, establish a need for new interventions for disease exacerbations. The animal model experimental autoimmune encephalomyelitis (EAE) is commonly used to test compounds for possible usefulness in MS. This strategy has resulted in the development of several compounds that are now standard treatments for RRMS [7]. EAE studies often utilize an experimental design that entails the administration of a test compound prior to the onset of EAE clinical signs. However, this design is not optimal for testing a compound for use during disease exacerbation since early administration of the compound may interfere with the development of disease rather than suppressing ongoing clinical signs [8]. When the drug deferiprone was tested in the SJL mouse model of EAE, it was administered after the onset of clinical signs [9]. This drug suppressed disease activity in a pronounced manner at a time when clinical signs are normally rapidly advancing. Further tests showed that deferiprone suppressed the proliferation of activated T cells [9], which are key mediators of pathogenesis in EAE and RRMS [10,11].
Deferiprone is an orally available iron chelator that causes immunomodulation in patients experiencing immunostimulation due to transfusion iron overload [12]. In this population, levels of CD8 lymphocytes, TNFα, and IL-2 were elevated prior to treatment, and returned to normal levels following deferiprone administration. The level of the anti-inflammatory cytokine, IL-10, increased after treatment but remained within the normal range. Furthermore, deferiprone was also found to suppress oxidative damage in this patient population [13]. The action of deferiprone on immune cells from MS subjects is unknown. The objective of the present studies was to examine the effects of deferiprone on T lymphocytes from RRMS and healthy control subjects.
2. Materials and Methods
2.1. Human subjects
This study was approved by the Human Subjects Committee of the University of Kansas Medical Center. Patients and control subjects were recruited at the University of Kansas Medical Center Multiple Sclerosis Clinic, and informed consent was obtained. Patients had a definite diagnosis of MS, as defined by the revised McDonald Criteria [14], and were classified as having RRMS according to the Lublin-Rheingold classification [15]. T cells from seven female patients with RRMS (age range 38–57; mean age 49.0 +/− 2.7 standard error of the mean) and four female and one male healthy controls (age range 24–51; mean age 39.6 +/− 5.1) were evaluated. All RRMS patients but one was in remission at the time of blood collection, and four of seven were on a MS disease modifying therapy, i.e., interferon beta-1a or 1b, but none were receiving a corticosteroid.
2.2. Antibodies and reagents
PE-Cy™5 mouse anti-human CD4, PE-Cy™7 mouse anti-human CD8, APC-Cy™7 mouse anti-human CD25 and Alexa Fluor 647 mouse anti-human FoxP3 were obtained from BD BioSciences, San Jose, CA. Anti-human CD3 was obtained from BD BioSciences and eBioscience, San Diego, CA. Anti-human CD28 was obtained from Ancell, Bayport, MN.
Live/dead fixable violet stain and 5-(and 6)-carboxyfluorescein diacetate succinimidyl ester (CFSE) were obtained from Invitrogen, Carlsbad, CA. Deferiprone was kindly supplied by ApoPharma, Inc., Toronto, ON. EasySep® T cell Enrichment Cocktail Magnetic Nanoparticle separation system was obtained from Stemcell Technologies, Vancouver, BC. Fetal Bovine Serum (FBS), interleukin 2 (IL-2), L-glutamate, Penicillin-Streptomycin, and RPMI 1640 medium were obtained from Sigma-Aldrich, St. Louis, MO. Ficoll-Paque PLUS™ was obtained from Amersham Biosciences, Uppsala, Sweden.
2.3. Blood collection, leukocyte separation, and cell plating
Blood was collected in green top tubes containing heparin, stored at room temperature, and processed within ~24 h of collection. Leukocytes were separated from the whole blood by Ficoll-Paque PLUS™ density centrifugation followed by negative T-cell selection using an EasySep® T cell Enrichment Cocktail Magnetic Nanoparticle separation system. After separation, cells were washed with phosphate buffered saline (PBS), resuspended in PBS with 0.1% FBS, incubated in 1.5 μM CFSE in dimmed lighting for 8 min at room temperature, diluted with an equal volume of FBS, incubated for an additional 10 min at 37 °C in dimmed lighting, washed with PBS + 2% FBS and resuspended in RPMI 1640 medium, 10% FBS, 1% Penicillin-Streptomycin, 1% L-glutamate.
Cells were plated at 1.5–2 × 10⁵ cells/well in 96 well Falcon Microtiter plates that were precoated with 1 μg/mL anti-human CD3 and 5 μg/mL anti-human CD28 antibodies in PBS. Cells were cultured for 4 days with 0 – 200 μM deferiprone in the presence or absence of 100 IU IL-2/well.
2.4. Cell staining and flow cytometry
Following 4 days of culture, cells were stained with PE-Cy5 mouse anti-human CD4, PE-Cy7 mouse anti-human CD8, APC-Cy7 mouse anti-human CD25, and live/dead fixable violet stain followed by Alexa Fluor 647 mouse anti-human FoxP3 and fixation with 1% paraformaldehyde in PBS. Approximately 1.5 × 10⁴ cells/well were analyzed with a BD LSRII Flow Cytometer, using FACSDiva software.
2.5. Data analysis and statistics
Dot plots and histograms representing the number of mitoses per gated cells were prepared using FlowJo software (Ashland, OR). Ratios were prepared for data obtained for deferiprone divided by data obtained for vehicle, which was the complete culture media. Measurements of area under the curve were calculated from ratio data collected over a range of 25–100 μM deferiprone concentrations for each subject (controls, n = 5; RRMS, n = 7, one subject's values utilized an extrapolated line for area calculation). Comparisons of ratios between responses at 75 μM deferiprone and vehicle within a subject group utilized the one-tailed Wilcoxon matched-pairs signed-rank test (controls, n = 5; RRMS, n = 6 as one RRMS subject didn't receive 75 μM deferiprone). Comparisons of ratio values at 75 μM deferiprone between subject groups utilized a one-tailed Wilcoxon two sample test. Analysis of areas under the curve utilized a one-tailed Student t-test. Significance was set at p ≤ 0.05 for all tests.
3. Results
3.1. Proliferative responses of CD4+ and CD8+ T cells, in the presence of T cell receptor (TCR) co-stimulation, evaluated over a range of deferiprone concentrations
Absolute raw data values displayed variable results between human subjects as expected. Due to this inherent variability, each subject served as their own control to normalize the data so that comparative analyses between populations, i.e., control subjects vs. RRMS subjects, could be made. Thus, data obtained in the presence of deferiprone were divided by data obtained in the absence of deferiprone (vehicle control) where a value below 1 represented a decreased response relative to vehicle.
Proliferating CD4+ and CD8+ T cells from control subjects, cultured in the presence or absence of IL-2, had reached values of < 0.14 (response to deferiprone divided by response in vehicle) at 75 μM deferiprone (p = 0.031 with or without IL-2) and the ratios were generally unchanged with increasing deferiprone concentrations up to 150 μM (Fig. 1A). In contrast, the ratios of proliferating CD4+cells from RRMS subjects had a ratio of >0.4 at 75 μM deferiprone in either the presence (p = 0.016) or absence (p = 0.031) of IL-2, and at higher concentrations of deferiprone up to 150 μM the ratios typically continued to drop. Proliferating CD8+ cells from RRMS subjects (Fig. 1B) showed more variability than proliferating CD4+ cells, but significant decreases were observed at 75 μM for RRMS subjects with IL-2 (p = 0.031). At 75 μM, significant differences were observed between RRMS and control subjects for proliferating CD4 cells cultured with (p= 0.041) or without (p = 0.009) IL-2, but did not reach significance for proliferating CD8 cells (p = 0.063 with or without IL-2).
Fig. 1.
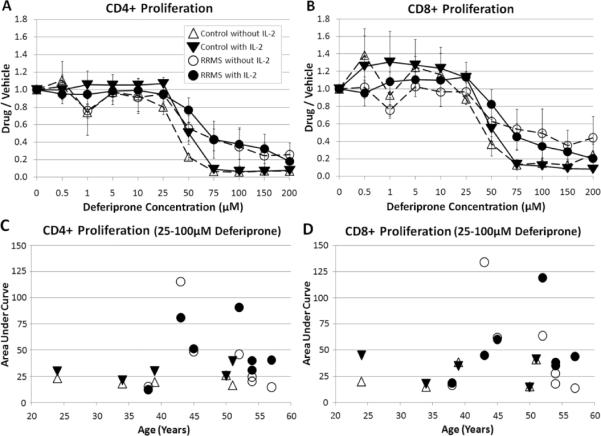
Proliferation of CD4+ and CD8+ T cells as measured by analyzing CFSE from control and RRMS subjects in the presence of deferiprone. The deferiprone/vehicle (complete culture media without drug) ratio was measured for control or RRMS cells cultured with or without IL-2. A) CD4+ proliferating and B) CD8+ proliferating cells (error bars = SEM). For each subject, the area under the lines over 25–100 μM deferiprone concentrations with or without IL-2 was determined and plotted according to the subject's age; C) CD4+ proliferating and D) CD8+ proliferating cells. There was not a statistically significant difference between the area under the curve for RRMS and control subjects (one tailed Student t-test, significance at p ≤ 0.05). Plots of mean ± s.e. for each group (triangle – control subject; circle – RRMS subject; unfilled symbol – without IL-2; filled symbol – with IL-2). N=5 control subjects (cells from 1 subject had 5 μM as the lowest deferiprone concentration); n=7 RRMS subjects (1 subject was treated with a limited deferiprone profile: 0, 0.5, 1, 5, 10, 50, 100, 200 μM, and its area under the curve was generated from an extrapolated line. Also, CD4+ T cells treated with IL-2 from one subject had 10 μM as the lowest deferiprone concentration).
For proliferating CD4+ or CD8+ T cells cultured with or without IL-2, the area under a line connecting the data points at 25, 50, 75 and 100 μM did not show a dependency on the subject's age. Although the areas under the curve were greater for RRMS subjects compared to control subjects (Fig. 1C,D), the differences failed to reach statistical significance. T cells from RRMS patients receiving a disease modifying therapy of interferon beta-1a or 1b did not show greater resistance to inhibition of proliferation by deferiprone compared to RRMS patients not receiving this intervention.
3.2. The effect of deferiprone on net change of CD4+ and CD8+ T cells in the presence of TCR co-stimulation
In order to determine whether the decreases in proliferation (Fig. 1) were due to net changes in viable cells, CD4+ and CD8+ T cells from control and RRMS subjects were compared for effects on cell expansion during TCR co-stimulation in the presence or absence of IL-2 and under treatment with varying concentrations of deferiprone. The viable cell ratios (deferiprone/vehicle) remained relatively constant over the range of deferiprone concentrations for both control and RRMS CD4+ T cells (Fig. 2A), suggesting no overt toxicity of the drug resulting in cell death. There was a tendency for a small decrease of the viable ratios (deferiprone/vehicle) of CD8+ cells at higher concentration of deferiprone, in the presence or absence of IL-2, for T cells from control and RRMS subjects (Fig. 2B).
Fig. 2.
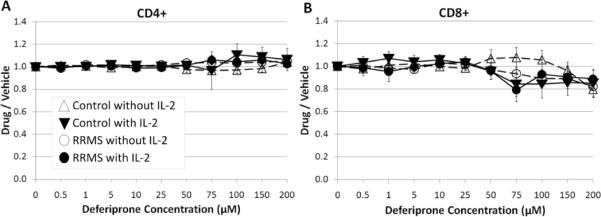
Effect of deferiprone on net changes in the percentage of viable CD4+ and CD8+ T cells. T cells were cultured with TCR co-stimulation (e.g., anti-CD3 + anti-CD28) in the presence of varying concentrations of deferiprone. The ratio of data obtained at different concentrations of deferiprone vs. vehicle (complete culture media without drug) was calculated for control or RRMS cells cultured with or without IL-2. A) CD4+ and B) CD8+ cells (viability determined by exclusion of live/dead fixable violet stain, and then gated for live cells). Plots of mean ± s.e. for each group (triangle – control subject; circle – RRMS subject; unfilled symbol – without IL-2; filled symbol – with IL-2). N=5 control subjects (cells from 1 subject had 5 μM as the lowest deferiprone concentration); n=7 RRMS subjects (1 subject was treated with a limited deferiprone profile: 0, 0.5, 1, 5, 10, 50, 100, 200 μM).
3.3. The effect of deferiprone on sustained responses of CD4+CD25+ and CD8+CD25+ T cells in the presence of TCR co-stimulation
Expression of the IL-2 receptor subunit CD25 is an early index of T cell activation and activated T cells promote immune activity in RRMS. Elevated expression of CD25 in conjunction with FoxP3 indicates regulatory T cells which can oppose immune activity in RRMS.
The ability of deferiprone to influence proliferation by CD25+CD4+ or CD25+CD8+ T cells from control and RRMS subjects was examined in the presence or absence of IL-2. The proliferation index of CD4+CD25+ cells was decreased at 75 μM for T cells from control subjects cultured in the presence or absence of IL-2 (p = 0.031) but generally remained above 0.4 (response to deferiprone divided by response to vehicle) even at higher deferiprone concentrations (Fig. 3A). For RRMS subjects there was more variability, but the ratios of CD4+CD25+ cells did reach significance at 75 μM with IL-2 (p = 0.031), and the ratios remained above 0.4 at higher deferiprone concentrations (Fig. 3A). This suggests that the proliferating CD4+CD25+ T cell subset (Fig. 3A) was more resistant to inhibition by deferiprone than the total CD4+ subset (Fig. 1A). The ratio of proliferating CD8+CD25+ was decreased at 75 M for RRMS subjects without IL-2 (p = 0.016) and for control subjects with or without IL-2 (p = 0.031) (Fig. 3B).
Fig. 3.
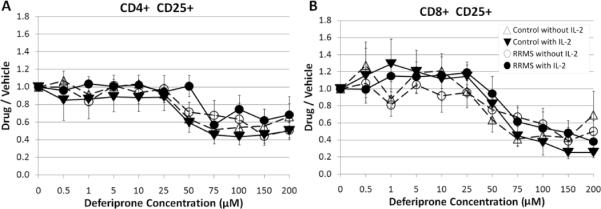
Effect of deferiprone on CD4+CD25+ and CD8+CD25+ T cells. The modulation of double positive CD4+CD25+ or CD8+CD25+ T cells from control and RRMS subjects was analyzed using a ratio of proliferating (CFSE) A) CD4+CD25+ or B) CD8+CD25+ T cells in the presence of deferiprone divided by the equivalent cell populations cultured in the vehicle (complete culture media without drug). At 75 μM deferiprone, less proliferation was observed for RRMS subjects (CD4+CD25+ with IL-2; CD8+CD25+ without IL-2) and for control subjects (CD4+CD25+ or CD8+CD25+ with or without IL-2). Thus, deferiprone mitigates the normal proliferation of T cells upon TCR co-stimulation regardless of mitogenic co-stimulation (presence or absence of IL-2). Plots of mean ± s.e. for each group (triangle – control subject; circle – RRMS subject; unfilled symbol – without IL-2; filled symbol – with IL-2). N=5 control subjects (cells from 1 subject had 5 μM as the lowest deferiprone concentration); n=7 RRMS subjects (1 subject was treated with a limited deferiprone profile: 0, 0.5, 1, 5, 10, 50, 100, 200 μM).
3.4. The effect of deferiprone on proliferative responses of CD4+CD25+ T cells in the presence of TCR co-stimulation
Proliferating responses to TCR co-stimulation through anti-CD3 + anti-CD28 were evaluated in T cells from control and RRMS subjects exposed to 0 or 75 μM deferiprone (Fig. 4). Control and RRMS T cells cultured in the absence of deferiprone showed activation (CD25 fluorescent intensity ≥3 × 10²) and abundant proliferation. In the presence of 75 μM deferiprone, control and RRMS T cells had a greatly reduced level of proliferation compared to vehicle (Fig. 4).
Fig. 4.
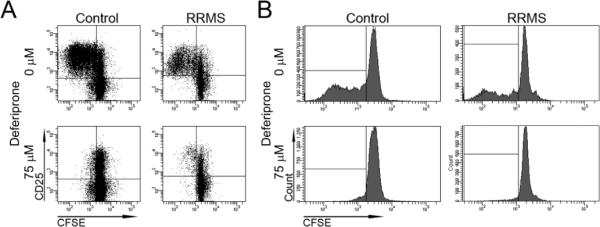
Raw data illustrating the effects of deferiprone on proliferating CD4+ cells. A) CD4+ cells were cultured from a control or RRMS subject in the absence (0 μM) or presence (75 μM) of deferiprone without IL-2. Gating was performed on live cells that were CD4+. CFSE and CD25 intensities were plotted on the x and y axes, respectively. Proliferating cells appear to the left of 103 CFSE staining. As revealed in the upper left quadrants, 75 μM deferiprone decreased the proliferation of CD4+CD25+ T cells from control and RRMS subjects. B) Histograms of CFSE fluorescence with gating of live CD4+CD25+ cells in A. The X axis is CFSE level of fluorescence and the Y axis is number of cells. As revealed in the lower left boxes, 75 μM deferiprone greatly decreased the proliferation of CD4+CD25+ T cells.
3.5. The effect of deferiprone on proliferative responses of CD4+FoxP3+ and CD4+CD25+FoxP3+ T cells in the presence of TCR co-stimulation
The transcription factor FoxP3 is considered to represent a primary subset of Treg. This subset is considered to be characterized phenotypically as CD4+CD25+Foxp3+. This subset was examined for responses to various concentrations of deferiprone. There was a high degree of variability for CD4+FoxP3+ and CD4+CD25+FoxP3+ T cells from control and RRMS subjects, but there was an overall tendency for an increase in the ratios with concentrations of deferiprone ≥ 25 μM (Fig. 5) principally in the presence of exogenously added IL-2. This is consistent with other findings that inducible Treg can be expanded in number in response to co-stimulation through anti-CD3 + anti-CD28 in the presence of IL-2 [16]. Interestingly, this apparent Treg subpopulation was relatively resistant to inhibition by deferiprone in contrast to the bulk of the CD4+ T cells. In addition, it should be noted that this phenotype does not conclusively identify these cells as Treg without a test of inhibitory activity.
Fig. 5.
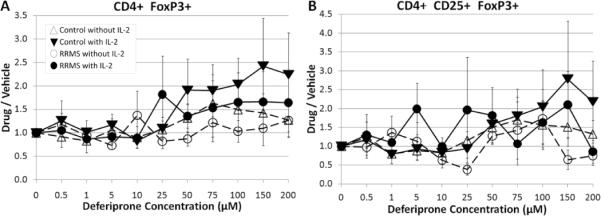
Responses of Treg from control and RRMS subjects in the presence of deferiprone with or without IL-2. A) CD4+FoxP3+ and B) CD4+CD25+FoxP3+ cells. Plots of mean ± s.e. for each group (triangle – control subject; circle – RRMS subject; unfilled symbol – without IL-2; filled symbol – with IL-2). N=5 control subjects (cells from 1 subject had 5 μM as the lowest deferiprone concentration); n=7 RRMS subjects (1 subject was treated with a limited deferiprone profile: 0, 0.5, 1, 5, 10, 50, 100, 200 μM, and the 10 μM concentration for CD4+CD25+FoxP3+ was missing for 1 RRMS subject).
4. Discussion
Deferiprone is a bidentate iron chelator that forms a 3:1 complex with iron. The drug is rapidly absorbed from the GI tract with peak serum concentrations within 1 h in fasted patients and 2 h in fed patients. The typical dosage for patients with thalassemia major is 25 mg/kg body weight three times per day for a daily dose of 75 mg/kg body weight. A dose of 25 mg/kg resulted in peak serum concentrations of 85 and 126 μM in the fed and fasting state, respectively [17]. Deferiprone has access to CNS cells since it crosses the blood-brain barrier [18], and it has been used in a small clinical trial to treat Friedreich ataxia in humans [19].
Data in the present study found that an in vitro deferiprone concentration of 50 μM resulted in suppression of proliferating CD4+ or proliferating CD8+ T cells from control subjects and a dose of 75 μM resulted in maximum suppression. Since the levels of IL-2 producing T cells are increased in acute MS compared to quiescent MS [20], it is likely that T cells will be exposed to elevated levels of IL-2 during an exacerbation, and thus, it is of interest to examine the effects of IL-2. IL-2 may have provided a small delay to the decrease in proliferation at 50 μM, but the levels were comparable at 75 μM deferiprone. Greater deferiprone concentrations were required for maximum suppression of proliferation of CD4+ and CD8+ cells in RRMS subjects, but a concentration of 50 μM gave signs of suppression and ~50% suppression was achieved at 75 μM in this group. Comparable levels of suppression were observed with or without IL-2 at 75 μM. Thus, it is possible that the standard dosage of deferiprone used to treat iron overload in thalassemia patients could blunt proliferative responses in T cells from MS subjects during a disease exacerbation raising the possibility that it might have therapeutic value. In support of this, oral administration of deferiprone, 150 mg/kg twice per day, to mice with active EAE resulted in a stabilization of disease within 1 day while EAE animals administered vehicle continued to get worse [9]. This dosage favors a deferiprone:iron ratio > 3, which is required for proper chelation. When the human equivalent dosage is calculated based on the dosage used in mice [21], a dosage of ~24 mg/kg twice per day is obtained, which is within the standard dosing regimen for thalassemia in humans. Deferiprone (250 μM) was also shown to inhibit proliferation of cultured, co-stimulated mouse splenocytes [9], and when it was administered to thalassemia major patients it lowered elevated levels of CD8+ cells as well as serum levels of TNFα and IL-2 to normal values [12].
Deferiprone is thought to act by interrupting iron replenishment of ribonucleotide reductase, which has two ferric ions that undergo spontaneous removal [22]. Hence, deferiprone may inhibit T cell proliferation by disrupting the function of ribonucleotide reductase, which catalyzes the reduction of ribonucleotides to deoxyribonucleotides that are required for DNA synthesis. Reducing DNA synthesis is thought to induce cytostasis of activated T and B cells, and this mechanism is exploited by other drugs, e.g., the dihydroorotate dehydrogenase inhibitor leflunomide and its active metabolite teriflunomide, that are used for the treatment of autoimmune disorders such as rheumatoid arthritis and possibly MS [23].
The IL-2 receptor subunit CD25 is expressed by activated effector T cells and in conjunction with FoxP3 it is also expressed in Treg cells. The former are pro-pathogenic and the latter help to ameliorate or control disease activity in MS and other autoimmune diseases. Thus, CD25 is involved with heterogeneous responses. In MS, an enhanced expression of CD25 on CD4+ cells is positively correlated with disease activity [24]. The presence of deferiprone decreased proliferative responses by CD4+CD25+ or CD8+CD25+ cells. The profile of decreased proliferative responses was similar to that observed for proliferating CD4+ or proliferating CD8+ cells, except that the maximum amount of suppression was less for the CD4+CD25+ or CD8+CD25+ cells. This incomplete reduction may be due, in part, to the preservation or increase in Treg cells that express CD4 and CD25 as well as FoxP3. Indeed, although there was a high degree of variability and much fewer labeled Treg cells than for proliferating T cells, in general, there was preservation or an increase in CD4+FoxP3+ and CD4+CD25+FoxP3+ cells that was associated with deferiprone concentrations ranging from 50 – 100 μM, although further study of a larger sample size is necessary to establish this finding. Furthermore, it is important to note that the intervention or disease status can affect Treg activity in MS [25,26]. If additional studies show that deferiprone does increase activity of Treg cells, then deferiprone might exert a salubrious effect during exacerbation of symptoms. Further characterization of the activation state of the Treg in response to deferiprone is warranted.
The most common negative side effects of deferiprone administration include gastrointestinal symptoms (i.e., abdominal pain, nausea and vomiting) and joint symptoms (i.e., pain or swelling). The most serious adverse effect is agranulocytosis, but apparently it is not dose dependent. Milder neutropenia can also be present. Blood counts are recommended on a weekly basis to monitor for the development of agranulocytosis or milder neutropenia. For MS subjects, further toxicity and immunological studies that investigate possible interactions of deferiprone with MS disease modifying therapies might be warranted.
In summary, deferiprone has been shown to lower proliferation of CD4+ and CD8+ cells. Proliferation is associated with generating an immune response which can be deleterious in an autoimmune disease like MS. Although these data support further study of deferiprone in MS, negative side effects attributable to the drug indicate that only carefully designed studies that emphasize safety should be pursued in future investigations.
Deferiprone is a potential treatment for relapsing remitting multiple sclerosis
Deferiprone was applied to T cells collected from RRMS or control subjects
T cell proliferation decreased in response to pharmacological levels of deferiprone
CD4+CD25+ and CD8+CD25+ cells declined in the presence of deferiprone
The findings are relevant for studies on the role of this drug in RRMS subjects
Acknowledgments
We thank Laura A. Schaefer for helping to establish the experimental procedures used in this project, Dr. Mary A. Lee for providing training on methods of data processing and Dr. Thomas Yankee for help processing data. We also thank Dr. John Connelly (Apo-Pharma, Inc., Toronto, ON) for helpful discussions and Dr. Michael Spino (Apo-Pharma, Inc.) for providing comments on the manuscript. Deferiprone was generously supplied by ApoPharma, Inc. This work was supported by Apo-Pharma, Inc. (SML), the National Multiple Sclerosis Society (New York, USA) (SML), and the National Institute of Aging (AG23946) (SHB).
Footnotes
Publisher's Disclaimer: This is a PDF file of an unedited manuscript that has been accepted for publication. As a service to our customers we are providing this early version of the manuscript. The manuscript will undergo copyediting, typesetting, and review of the resulting proof before it is published in its final citable form. Please note that during the production process errors may be discovered which could affect the content, and all legal disclaimers that apply to the journal pertain.
References
- 1.Sellebjerg F, Barnes D, Filippini G, Midgard R, Montalban X, Rieckmann P, et al. EFNS guideline on treatment of multiple sclerosis relapses: report of an EFNS task force on treatment of multiple sclerosis relapses. Eur J Neurol. 2005;12:939–46. doi: 10.1111/j.1468-1331.2005.01352.x. [DOI] [PubMed] [Google Scholar]
- 2.Myhr KM, Mellgren SI. Corticosteroids in the treatment of multiple sclerosis. Acta Neurol Scand Suppl. 2009;189:73–80. doi: 10.1111/j.1600-0404.2009.01213.x. [DOI] [PubMed] [Google Scholar]
- 3.Lyons PR, Newman PK, Saunders M. Methylprednisolone therapy in multiple sclerosis: a profile of adverse effects. J Neurol Neurosurg Psychiatry. 1988;51:285–7. doi: 10.1136/jnnp.51.2.285. [DOI] [PMC free article] [PubMed] [Google Scholar]
- 4.Frohman EM, Shah A, Eggenberger E, Metz L, Zivadinov R, Stüve O. Corticosteroids for multiple sclerosis: I. Application for treating exacerbations. Neurotherapeu. 2007;4:618–26. doi: 10.1016/j.nurt.2007.07.008. [DOI] [PMC free article] [PubMed] [Google Scholar]
- 5.Thrower BW. Relapse management in multiple sclerosis. Neurologist. 2009;15:1–5. doi: 10.1097/NRL.0b013e31817acf1a. Review. [DOI] [PubMed] [Google Scholar]
- 6.Tumani H. Corticosteroids and plasma exchange in multiple sclerosis. J Neurol. 2008;255(Suppl 6):36–42. doi: 10.1007/s00415-008-6007-9. [DOI] [PubMed] [Google Scholar]
- 7.Steinman L, Zamvil SS. How to successfully apply animal studies in experimental allergic encephalomyelitis to research on multiple sclerosis. Ann Neurol. 2006;60:12–21. doi: 10.1002/ana.20913. [DOI] [PubMed] [Google Scholar]
- 8.Emerson MR, Gallagher RJ, Marquis JG, LeVine SM. Enhancing the ability of experimental autoimmune encephalomyelitis to serve as a more rigorous model of multiple sclerosis through refinement of the experimental design. Comp Med. 2009;59:112–28. [PMC free article] [PubMed] [Google Scholar]
- 9.Mitchell KM, Dotson AL, Cool KM, Chakrabarty A, Benedict SH, LeVine SM. Deferiprone, an orally deliverable iron chelator, ameliorates experimental autoimmune encephalomyelitis. Mult Scler. 2007;13:1118–26. doi: 10.1177/1352458507078916. [DOI] [PubMed] [Google Scholar]
- 10.Vollmer T. The natural history of relapses in multiple sclerosis. J Neurol Sci. 2007;256(Suppl 1):S5–13. doi: 10.1016/j.jns.2007.01.065. [DOI] [PubMed] [Google Scholar]
- 11.Weiner HL. The challenge of multiple sclerosis: how do we cure a chronic heterogeneous disease? Ann Neurol. 2009;65:239–48. doi: 10.1002/ana.21640. [DOI] [PubMed] [Google Scholar]
- 12.Del Vecchio GC, Schettini F, Piacente L, De Santis A, Giordano P, De Mattia D. Effects of deferiprone on immune status and cytokine pattern in thalassaemia major. Acta Haematol. 2002;108:144–49. doi: 10.1159/000064705. [DOI] [PubMed] [Google Scholar]
- 13.Bartfay WJ, Lehotay DC, Sher GD, Bartfay E, Tyler B, Luo X, et al. Erythropoiesis: comparison of cytotoxic aldehyde generation in beta-thalassemia patients chelated with deferoxamine or deferiprone (L1) versus NO chelation. Hematology. 1999;4:67–76. doi: 10.1080/10245332.1999.11746432. [DOI] [PubMed] [Google Scholar]
- 14.Polman CH, Reingold SC, Edan G, Filippi M, Hartung HP, Kappos L, et al. Diagnostic criteria for multiple sclerosis: 2005 revisions to the “McDonald Criteria”. Ann Neurol. 2005;58:840–46. doi: 10.1002/ana.20703. [DOI] [PubMed] [Google Scholar]
- 15.Lublin FD, Reingold SC. Defining the clinical course of multiple sclerosis: Results of an international survey. Neurol. 1996;46:907–11. doi: 10.1212/wnl.46.4.907. [DOI] [PubMed] [Google Scholar]
- 16.Putnam AL, Brusko TM, Lee MR, Liu W, Szot GL, Ghosh T, et al. Expansion of human regulatory T-cells from patients with type 1 diabetes. Diabetes. 2009;58:652–62. doi: 10.2337/db08-1168. [DOI] [PMC free article] [PubMed] [Google Scholar]
- 17.European Medicines Agency Ferriprox, INN-Deferiprone. Annex I. Summary of Product Characteristics, WC500022050. www.ema.europa.eu.
- 18.Fredenburg AM, Sethi RK, Allen DD, Yokel RA. The pharmacokinetics and blood-brain barrier permeation of the chelators 1,2 dimethly-, 1,2 diethyl-, and 1-[ethan-1'ol]-2-methyl-3-hydroxypyridin-4-one in the rat. Toxicology. 1996;108:191–99. doi: 10.1016/0300-483x(95)03301-u. [DOI] [PubMed] [Google Scholar]
- 19.Boddaert N, Le Quan Sang KH, Rötig A, Leroy-Willig A, Gallet S, et al. Selective iron chelation in Friedreich ataxia: biologic and clinical implications. Blood. 2007;110:401–8. doi: 10.1182/blood-2006-12-065433. [DOI] [PubMed] [Google Scholar]
- 20.Clerici M, Saresella M, Trabattoni D, Speciale L, Fossati S, Ruzzante S, et al. Single-cell analysis of cytokine production shows different immune profiles in multiple sclerosis patients with active or quiescent disease. J Neuroimmunol. 2001;121:88–101. doi: 10.1016/s0165-5728(01)00431-3. [DOI] [PubMed] [Google Scholar]
- 21.US Department of Health and Human Services Guidance for industry. Estimating the maximum safe starting dose in initial clinical trials for therapeutics in adult healthy volunteers. Pharmacology and Toxicology. 2005 [Google Scholar]
- 22.Cooper CE, Lynagh GR, Hoyes KP, Hider RC, Cammack R, Porter JB. The relationship of intracellular iron chelation to the inhibition and regeneration of human ribonucleotide reductase. J Biol Chem. 1996;271:20291–9. doi: 10.1074/jbc.271.34.20291. [DOI] [PubMed] [Google Scholar]
- 23.Warnke C, Meyer Zu Hörste G, Hartung HP, Stüve O, Kieseier BC. Review of teriflunomide and its potential in the treatment of multiple sclerosis. Neuropsychiatr Dis Treat. 2009;5:333–340. [PMC free article] [PubMed] [Google Scholar]
- 24.Khoury SJ, Guttmann CRG, Orav EJ, Kikinis R, Jolesz FA, Weiner HL. Changes in activated T cells in the blood correlate with disease activity in multiple sclerosis. Arch Neurol. 2000;57:1183–89. doi: 10.1001/archneur.57.8.1183. [DOI] [PubMed] [Google Scholar]
- 25.Venken K, Hellings N, Hensen K, Rummens JL, Medaer R, D'hooghe MB, et al. Secondary progressive in contrast to relapsing-remitting multiple sclerosis patients show a normal CD4+CD25+ regulatory T-cell function and FOXP3 expression. J Neurosci Res. 2006;83:1432–46. doi: 10.1002/jnr.20852. [DOI] [PubMed] [Google Scholar]
- 26.Namdar A, Nikbin B, Ghabaee M, Bayati A, Izad M. Effect of IFN-beta therapy on the frequency and function of CD4(+)CD25(+) regulatory T cells and Foxp3 gene expression in relapsing-remitting multiple sclerosis (RRMS): a preliminary study. J Neuroimmunol. 2010;218:120–4. doi: 10.1016/j.jneuroim.2009.10.013. [DOI] [PubMed] [Google Scholar]