Abstract
Purpose
To compare visual fields on the Nidek MP-1 to those obtained on the Humphrey field analyzer (HFA) in healthy volunteers and assess the effects of differences in stimulus parameters and testing strategies that may influence the interpretation of results in patients. A secondary aim was to establish MP-1 normative data to calculate the total deviation analyses and global indices analogous to those used by the HFA.
Methods
50 healthy volunteers (age 43.5 ± 13.9 yrs, range 18–68 yrs) underwent repeat MP-1 and HFA visual field testing, using the 10-2 pattern. MP-1 data were converted to HFA equivalent dB units. Between instrument comparisons of HFA and MP-1 sensitivities, regression of sensitivity with age, and examination duration were assessed. Test-retest variability was examined between visits.
Results
MP-1 (mean = 32.82 dB, SD = 1.92 dB) and HFA sensitivities (mean = 32.84 dB, SD = 1.83 dB) were not significantly different (p = 0.759). SD values for the HFA (range 1.11–3.30 dB) were similar to the MP-1 (range 0.14–2.75 dB). However asymmetry comparisons between instruments showed significantly decreased superior rather than inferior retinal values for the MP-1. There was a small but significant difference (p = 0.004) in mean test duration between the MP-1 (mean = 6:11 min, SD = 1:49 min) and the HFA (mean = 5:14 min, SD = 0:42 min). There was also a difference in the decline of mean sensitivity with age, a decline of 0.1 and 0.4dB per decade was noted in MP-1 and HFA sensitivity respectively. Test-retest variability was similar between instruments. A small but non-significant increase in mean sensitivity at the second visit for both the MP-1 (p = 0.060) and HFA (p = 0.570) was found.
Conclusions
Both instruments showed similar variability and test-retest variability when results were compared using equivalent units. However there are important differences in sensitivity values, stimulus parameters and testing strategies that have to be taken into account when comparisons are made.
Keywords: microperimetry, fundus perimetry, threshold, age, sensitivity
The MP-1 is a commercially available microperimeter which has recently gained widespread clinical use, in a variety of ocular disease.1–6 Not only has microperimetry been used to detect scotomata in patients with unsteady fixation or a non-foveal preferred retinal locus (PRL), but it has also been used to study patients who have foveal fixation. For example, in patients with glaucoma it has been reported that MP-1 and Humphrey 10-2 sensitivities were significantly correlated7 and that SLO microperimetry detected more subtle functional damage than standard achromatic perimetry in the central 10° field.8
Because of the increased clinical use of this instrument it is important to understand the similarities and differences between the parameters of the MP-1 and conventional perimetry, as implemented by the Humphrey Field Analyzer (HFA). Although similar stimulus patterns, sizes, durations and testing strategies are available in both instruments, there are important differences that can affect the interpretation of the results. For example stimuli are presented on a background of 10 candelas per square meter (cd/m2) in the HFA but on a background of 1.27 cd/m2 in the MP-1. The difference in background adaptation level and minimum stimulus luminance causes a difference in the dynamic range of the two devices, such that the HFA is capable of presenting dimmer stimuli than the MP-1. The decibel values from each instrument are therefore not equivalent and must be converted to equivalent units before data comparisons can be made.
The identification and quantification of visual field abnormalities relies on normative data. The local defect map on the MP-1 is available to the clinician to evaluate sensitivity losses in comparison to normative data and is approximately analogous to the total deviation (TD) map of the HFA. This existing MP-1 normative database was collected using a 77-point 10° circular grid in which the separation increases with eccentricity, using the 4-2-1 threshold strategy.9–10 Although it has been shown that interpolation has minimal effects on threshold values with eccentricity of the 10-2 field,11 suggesting that interpolated data is appropriate, the use of normative data relies on several assumptions. These include the assumption that stimulus and background luminance values are identical between instruments, that the actual values are those stated by the manufacturer and that the same 4-2-1 threshold strategy was used.
The aims of the study were to compare visual field results on the MP-1 to those obtained on the HFA in healthy volunteers and assess the effects of some of the differences in terms of stimulus parameters and testing strategies that may influence the interpretation of results. A secondary aim was to develop an appropriate model for our data to establish MP-1 normative data, in order to calculate the total deviation analyses and global indices analogous to those used by the HFA.
METHODS
Subjects
The study comprised fifty healthy volunteers (31 females, 19 males) with a mean age of 43.5 ± 13.9 years (range 18–68 years) without any history of ocular disease and no medications known to affect the visual field. Subjects were recruited from the staff population at Columbia University and approximately 10 subjects per decade of age were targeted in order to age-stratify the sample. Based on the known mean threshold values within the central 10° field and group standard deviations12–13 converted to HFA equivalent units, a sample of 50 would detect a difference of 0.6 dB in Mean Sensitivity between instruments with a conservative power of 95% with an alpha level of 0.05. All subjects had received a recent eye examination less than one year prior to their study visit and had clear ocular media, refractive errors not exceeding ±3.25D sphere and −2.00D cylinder, visual acuities ≥20/20, no systemic or neurological disease, no history of ocular surgery, steady foveal fixation and undilated pupillary diameters of at least 4 mm. Fifteen subjects were hyperopic. The dominant eye of each individual was included in the study, as determined by the hole-in-the-card test14. A further 7 normal subjects (mean age 43.6 ± 21.5, range 25–74 years), conforming to the above inclusion criteria were recruited to validate the database and underwent all study procedures.
The study adhered to the tenets of the Declaration of Helsinki for research involving human subjects and the protocol was approved by the Columbia University Medical Center Institutional Review Board for Human Research. Each participant gave informed consent prior to enrollment in the study.
Perimetry
Subjects performed one examination using the HFA II 750 perimeter (Carl Zeiss Meditec, Dublin, CA) and one using the MP-1 microperimeter (Nidek Instruments Inc, Padova, Italy; NAVIS software version 1.7.3). To account for the learning effect, this was repeated on a separate visit (mean 7 days later, range 2–15 days). Identical instructions were given to all participants. Test order between instruments was randomized at the first visit and repeated at the subsequent visit. Fifteen minute rest periods were given between examinations.
HFA perimetry was undertaken using the 10-2 stimulus pattern, with the SITA Standard threshold strategy, Goldmann size III white stimuli, 200ms in duration and a three minute adaptation period to the 10cd/m2 white background prior to examination. The fixation target was a central yellow spot, diameter 0.4°. Visual fields were included where there were less than 20% fixation losses, false positives and false negatives; this resulted in the exclusion of 15 of the 200 fields from the analysis and the exclusion of two subjects from the sample entirely.
For the MP-1 a 10-2 pattern similar to the Humphrey 10-2 visual field was used. This pattern had 68 test locations covering the central 20°. White test lights (stimulus size Goldmann III, 200 ms in duration) were presented on a dim white background with a luminance of 1.27 cd/m2, using a 4-2 threshold staircase strategy. Subjects were asked to maintain fixation on a red cross (2° in diameter, stroke width 0.2°) following a 15 minute adaptation period to the background. Spherical refractive error was corrected by the optics of the instrument, however it was not possible to correct for astigmatic error.
The MP-1 allows for automated real-time fundus tracking via infra-red fundus imaging, which compensates for misalignment by pausing stimulus projection. Deviations from central fixation are sampled at a frequency of 25Hz (every 40ms) and presented in a fixation map. Fixation stability is then quantified using the bivariate contour ellipse area (BCEA), within which the center of the target was imaged 68% of the time.15–17 Duration of examination is given as the total time from start to end of testing including pauses (unless the test timer is paused by the perimetrist) and when the fundus is not tracked, for example during a blink.
The HFA gaze tracking system (HFA II – i series: user’s manual) uses infrared lights to measure the distance between the first corneal reflex (Purkinje 1) and the pupil centre. Real-time image analysis is displayed in the form of a gaze graph, which has not previously been quantified. Upward markings of the graph denote eye movements up to 10°, but directional information is not given. Downward markings indicate the system was unable to detect the gaze direction, which occurs during blinks. Duration is the total time from first stimulus presentation to last, not including pauses.
Analysis
All left eye data were transposed to a right eye format prior to analyses. Mean deviation (MD) and TD probability values are given by the HFA Statpac software.18 The HFA field was inverted superior to inferior, such that the sensitivity values were presented as a retinal view corresponding to the MP-1 printout. Where necessary, for comparison purposes, MP-1 data were converted to HFA equivalent dB units, calculated using the formula in Equation 1.19
| (1) |
where μ = the stimulus increment for the MP-1 in cd/m2
3183 = maximum intensity of the HFA in cd/m2
10 = the multiplier to convert to dB.
The maximum and minimum stimulus intensity of the MP-1 is 127 and 1.27 cd/m2 (0 and 20 dB), respectively and substituting into Equation 1, this gives equivalent HFA units of 14 and 34dB. Analyses were performed on data from the second visit, with the exception of the between-visit comparisons.
Sensitivity data was assessed for normality using the Kolmogorov-Smirnov test and compared by quadrants and hemifields. Sensitivity values were compared between instruments using the unpaired t test and Bland-Altman plot.20 Variability was analyzed using the pointwise group standard deviation values. The influence of age on sensitivity was assessed by univariate linear regression of sensitivity with age and regression slopes were compared between instruments using the unpaired t test and assessed for significant deviation from zero. Stimulus co-ordinates for the 10-2 pattern were compared between instruments. Test-retest variability was analyzed using the Bland-Altman method, paired t tests and standard deviation of Mean Sensitivity (MS) at the 2 visits. Examination duration was compared with the unpaired t test, which excluded 7 subjects who required a pause during MP-1 testing. Sensitivity was investigated as a function of exam duration.
Fixation measures were compared (Pearson’s correlation) between instruments using the BCEA measure from the MP-1 software and pixel counts of the HFA gaze graph images obtained in MatLab version 7.7.0 (The MathWorks, Natick, Massachusetts, USA).
To create an MP-1 normal database, the prediction limits were calculated from the regression of sensitivity with age. The linear regression model was estimated using a Bayesian approach.21 The aim of the Bayesian approach is to capture uncertainty about the parameters of a model using a probability distribution. The prior distribution captures the uncertainty before data are observed and the posterior distribution captures the uncertainty after data are observed. The posterior distribution is most often estimated through simulation. Functionals of the posterior distribution, such as prediction intervals, can then be estimated from the simulated data. For a detailed description of the Bayesian model see Appendix.
Prediction intervals were empirically estimated from the sample and were then used to determine in 7 subjects, whether the deviations according to the age-matched sensitivities, exceeded those found in less than 5% of the normal database.
RESULTS
Sensitivity Data Normality
Pointwise MP-1 sensitivities displayed non-Gaussian (Kolmogorov-Smirnov test: p values ranged from p < 0.001 to p = 0.041), mostly negatively skewed distributions, in all but 3 stimulus locations situated in the superior peripheral retina. However, in the HFA visual field, 14 of 68 locations at various eccentricities had non-Gaussian distributions, and the remaining locations had normal distributions (p values ranged from p = 0.051 to p = 0.724).
Sensitivity Comparison
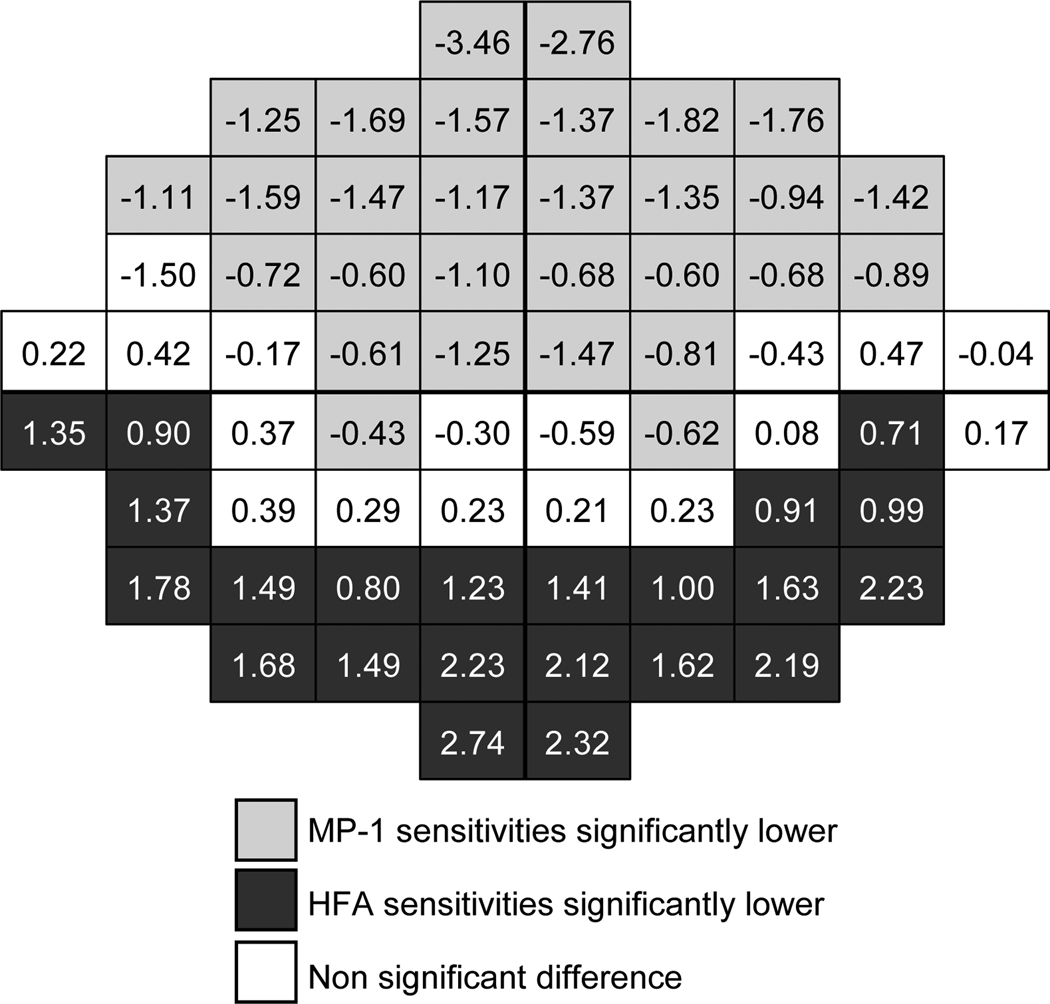
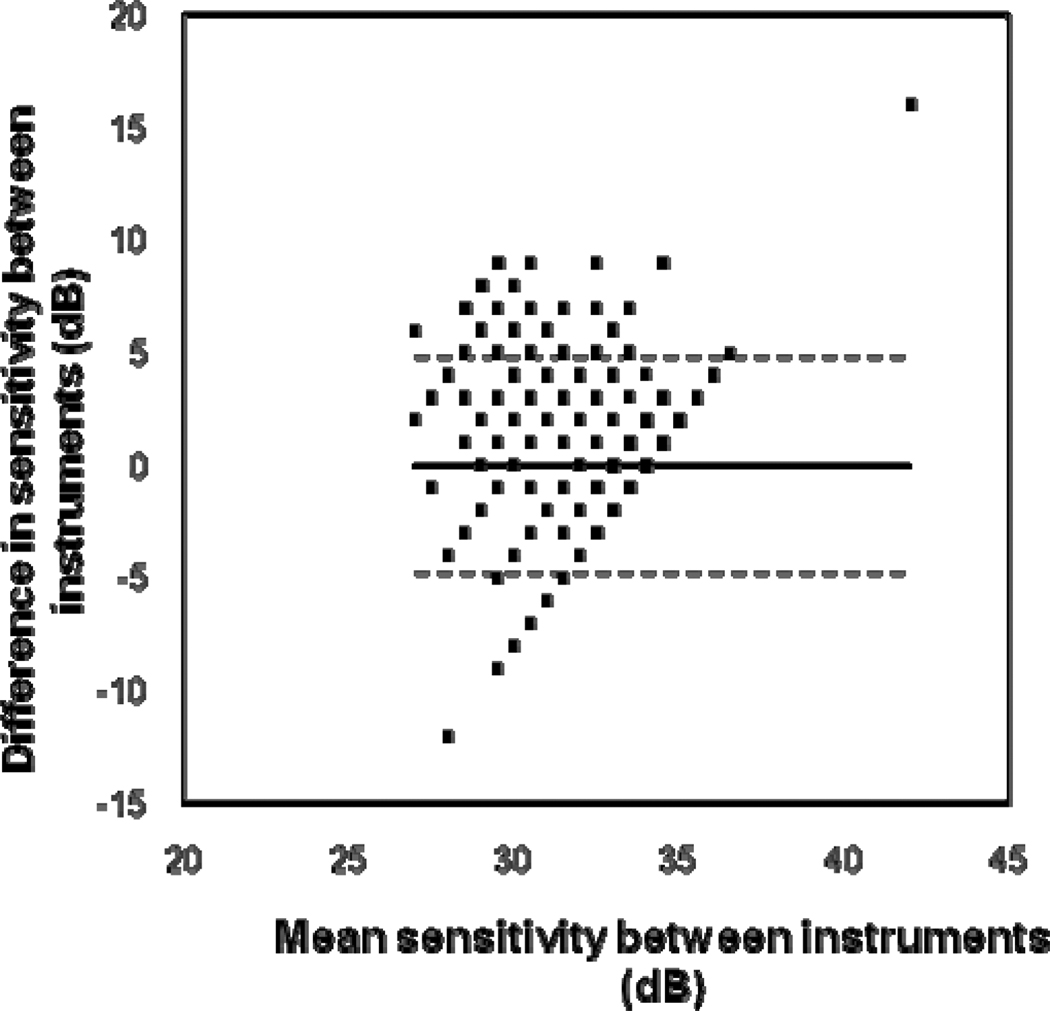
Table 1 demonstrates a comparison of asymmetries across the visual field in sensitivity values, in which converted values are given for the MP-1. On average, asymmetries were less than 1.6 dB. Significant superior-inferior asymmetries were found for the MP-1 and the HFA. For the MP-1, lower sensitivity values were found in superior retinal locations, but for the HFA, lower sensitivity values were found in inferior retinal locations and the differences were smaller. Nasal-temporal differences were not significant. Foveal sensitivities were greater than peripheral sensitivities, especially for the HFA. Sensitivity values for the MP-1 (mean = 32.82 dB, SD = 1.92 dB) were not significantly different (unpaired t test: t = -0.307, p = 0.759) from HFA values (mean = 32.84 dB, SD = 1.83 dB). However when analyzed by location, the superior retinal locations were significantly lower for the MP-1 and the inferior locations were significantly lower in the HFA, leaving a “corridor” approximately around the midline which was not significantly different (Figure 1). The Bland-Altman plot (Figure 2) shows how the dB difference between instruments varies with the magnitude of sensitivity. The plot has a truncated appearance which extends from the point where the difference between instruments is 0 dB (on the y-axis) and the upper limit of the MP-1 at 34 dB in HFA equivalent units (on the x-axis). It illustrates how the ceiling effect of the MP-1 reduces the measured variability.
Table 1.
Mean sensitivity comparison between sectors. The data are presented to show a retinal view (as for the MP-1) and MP-1 data are given in HFA equivalent dB units. Superior-inferior and nasal-temporal comparisons were calculated for sectors divided at the midline. The foveal and peripheral locations included the central 16 and peripheral 52 locations, respectively. Unpaired t tests were performed to compare sectors. Significance differences are indicated in bold.
| Mean | Mean difference | p | Mean | Mean difference | p | Mean | Mean difference | p | ||||
|---|---|---|---|---|---|---|---|---|---|---|---|---|
| HFA | Superior | 33.09 | 0.57 | 0.012 | Nasal | 32.86 | 0.10 | 0.677 | Foveal | 34.01 | 1.57 | < 0.001 |
| Inferior | 32.52 | Temporal | 32.76 | Peripheral | 32.44 | |||||||
| MP-1 | Superior | 32.10 | 1.47 | < 0.001 | Nasal | 32.76 | 0.14 | 0.615 | Foveal | 33.54 | 0.93 | 0.004 |
| Inferior | 33.56 | Temporal | 32.90 | Peripheral | 32.61 | |||||||
Figure 1.
Mean difference in sensitivity values (in dB) between instruments. The HFA visual field is inverted superior-inferior to give the corresponding retinal view to the MP-1 and the MP-1 data was converted to HFA equivalent units. Negative values indicate lower MP-1 compared to HFA sensitivities and positive values indicate lower HFA values. Shading indicates that the difference was significant and non significant differences are unshaded.
Figure 2.
Bland-Altman plot to show the difference in sensitivity values between instruments. The difference plotted along the ordinate shows the converted (HFA equivalent units) MP-1 sensitivities subtracted from the HFA sensitivities, for each stimulus location, for each patient. The relationship between the variability between instruments and magnitude of difference between instruments is shown. The horizontal solid line represents the mean difference and the dotted lines represent the 95% limits of agreement.
Variability
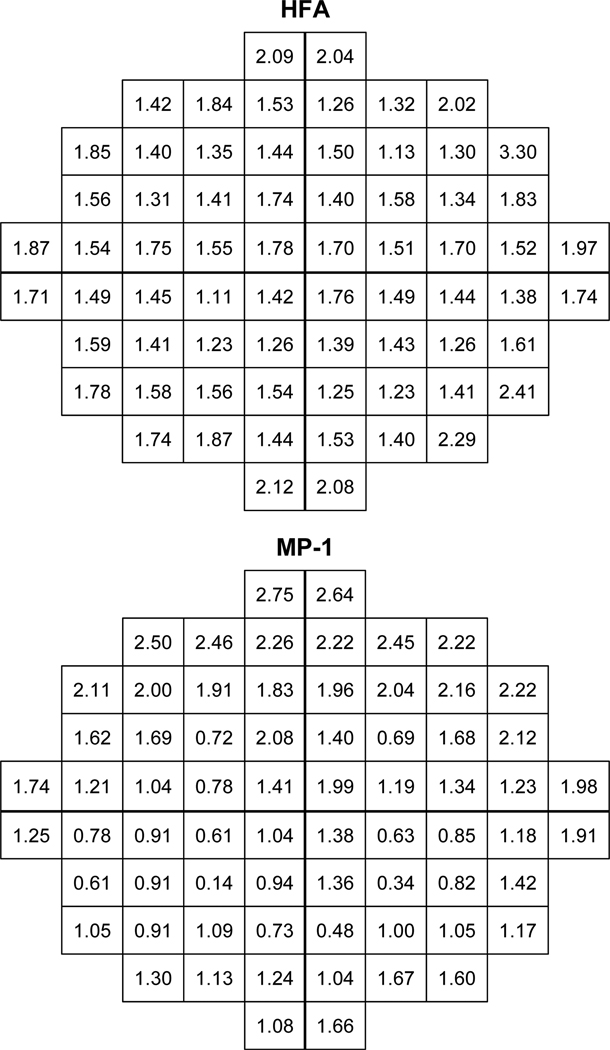
Standard deviations at each stimulus location (Figure 3) show a comparable magnitude of variability between instruments. However the range of standard deviation values is larger for the MP-1 at both the upper and lower limit. Larger standard deviations are present in the periphery. For the MP-1 the superior retinal standard deviation values are greater, whereas the distribution of values is more uniform for the HFA.
Figure 3.
One standard deviation of the group mean sensitivity (in dB) shows the intratest interindividual variation in sensitivity at each stimulus location for the HFA (top) and the MP-1 (bottom). The HFA visual field is inverted superior-inferior to give the corresponding retinal view to the MP-1 and the MP-1 data was converted to HFA equivalent units.
The Effects of Age
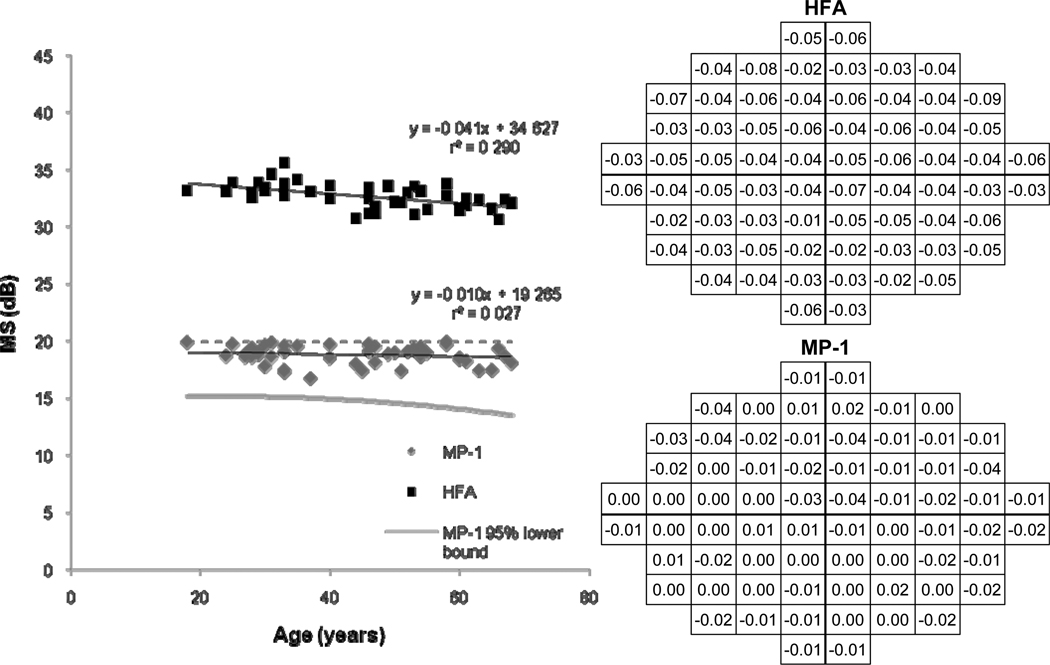
Figure 4 shows a decline of 0.1 and 0.4 dB per decade for MP-1 and HFA MS, respectively. The relationship between age and sensitivity was significant for the HFA (F = 17.190, p < 0.001), but not for the MP-1 (F = 1.332, p = 0.254). Weak relationships were present, especially for the MP-1 MS decline with age (r2 = 0.03). Pointwise linear regression of MP-1 sensitivities with age also indicated weak relationships in the majority of stimulus locations. The 95% confidence interval as predicted by the Bayesian model is shown by the gray line, which reflects the small decline with advancing age.
Figure 4.
Univariate linear regression of Mean Sensitivity (MS) as a function of age is shown by the scatterplot (left) for the MP-1 and the HFA. The 95% lower bound was predicted by the Bayesian model. The regression slopes at each stimulus location for the HFA (top right) and the MP-1 (bottom right) are shown and the MP-1 ceiling at 20dB is indicated by the dashed line. The HFA visual field is inverted superior-inferior to give the corresponding retinal view to the MP-1.
HFA sensitivities declined with age, the mean loss was 0.041dB per year and the slopes were significantly different from zero (t = −4.146, p < 0.001). For the MP-1, a loss of 0.010 dB per year was found, however the slopes were not significantly different from zero (t = −1.154, p = 0.254). HFA slopes were significantly steeper than for the MP-1 (t = 14.240, p < 0.001).
Comparison of Stimulus Locations
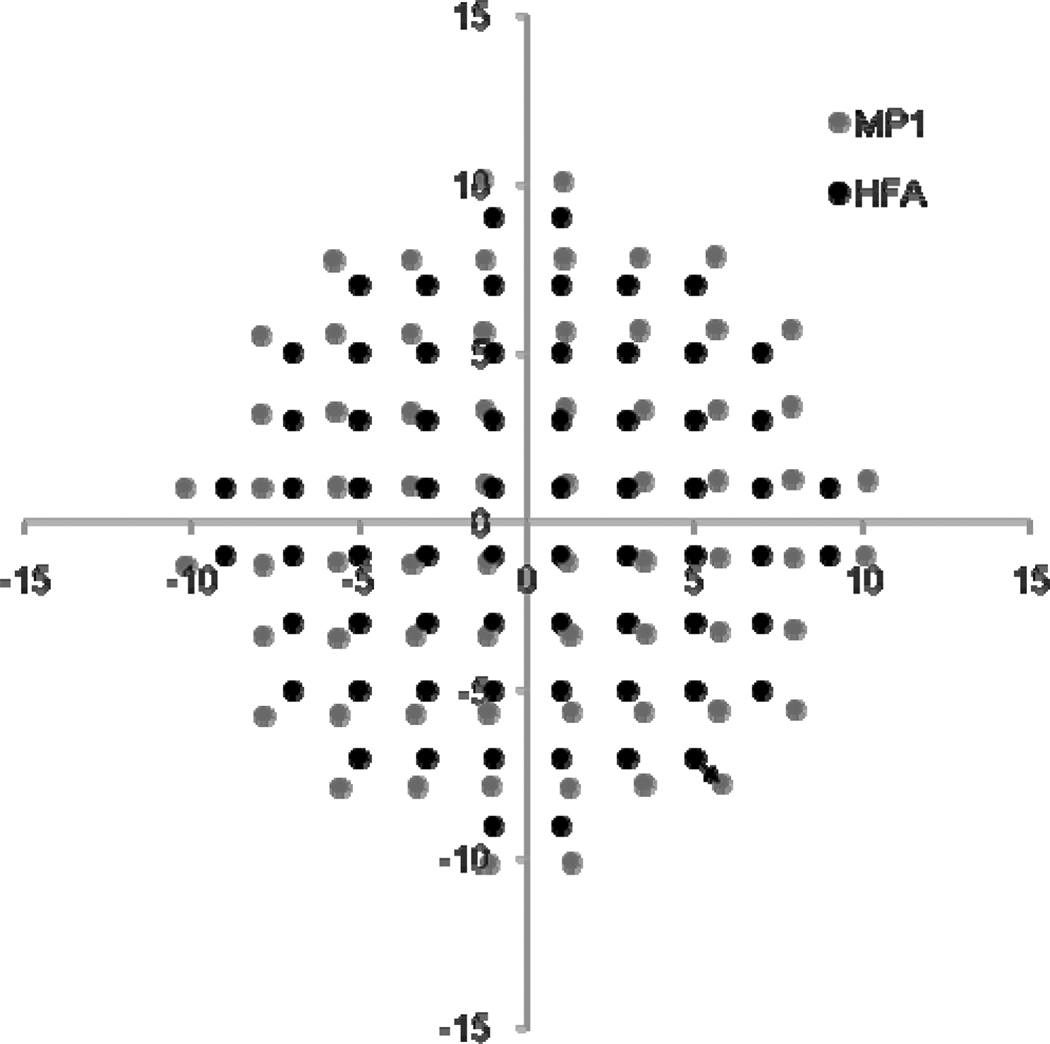
The stimulus coordinates of the programmed 10-2 pattern of the MP-1 differ from those of the HFA (see Figure 5). The mean distance between corresponding stimulus points of the HFA and the MP-1, for a given location (shown by arrow in Figure 5), was 0.8° (SD 0.3°, range 0.1–2.3°) and it was greater for the more peripheral stimuli.
Figure 5.
The stimulus locations of the 10-2 pattern for the MP-1 and HFA are plotted according to the coordinates for each location, in degrees. The HFA stimulus locations have fixed coordinates. The mean value for the MP-1 coordinates for normal subjects is presented. Standard error values were less than the scatterplot point size. The arrow indicates the distance between corresponding given stimulus location points of the HFA and the MP-1.
Test–Retest Variability
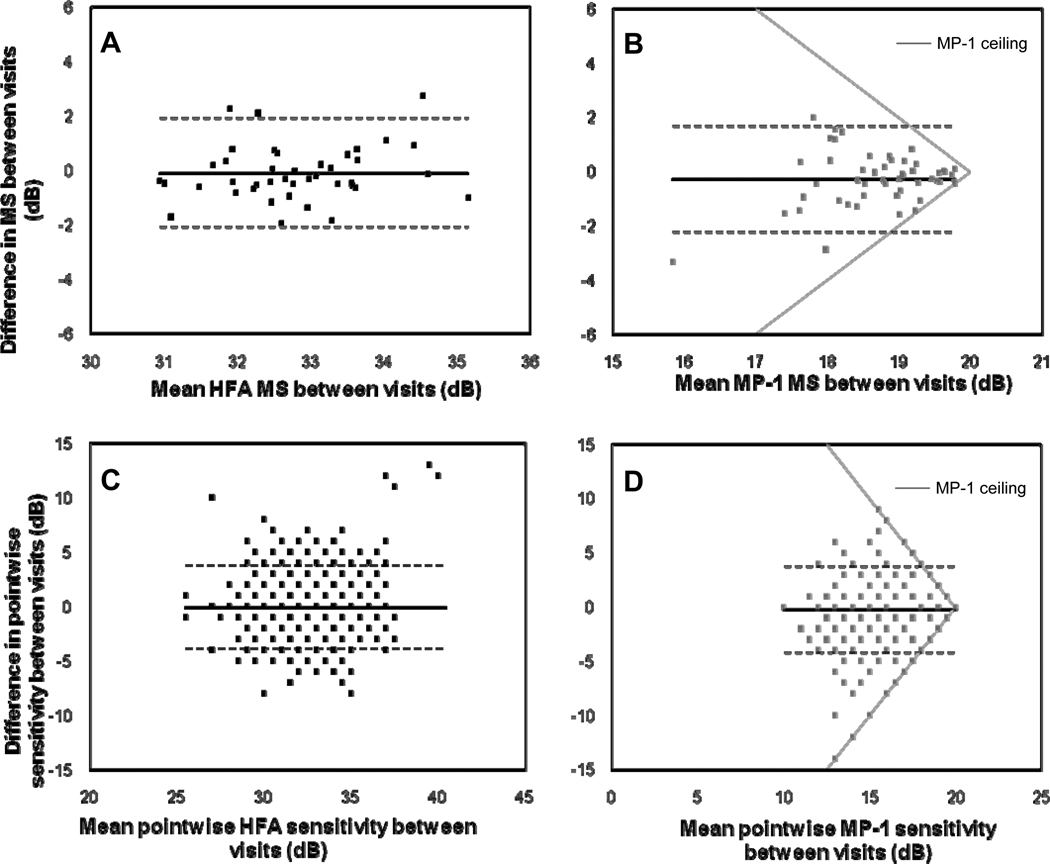
For the MP-1, the mean MS was 18.57 and 18.84 dB at visits 1 and 2, respectively and this difference was not significant (paired t-test: t = −1.923, p = 0.060). For the HFA, the mean MS was 32.70 and 32.79 dB at visits 1 and 2, respectively and this difference was also not significant (t = −0.573, p = 0.570). The global standard deviation of MS between visits was 0.55 dB for the HFA and 0.52 dB. However examination duration was significantly shorter at the second visit for both the MP-1 (paired t-test: t = 4.096, p < 0.001) and the HFA (t = 2.045, p = 0.048). Bland-Altman plots (see Figure 6) indicated that the variability of HFA MS and pointwise sensitivities did not change with magnitude, however the MP-1 MS values were less variable for higher sensitivities i.e. > 19 dB, due to the ceiling effect. In addition, the truncated appearance of the MP-1 plots, can be attributed to the ceiling or the upper limit of the MP-1 (see gray lines in Figure 6B & 6D).
Figure 6.
Test-retest variability for the HFA and MP-1 is shown by Bland-Altman plots. The Bland-Altman plots determine if there is a relationship between the variability and magnitude of sensitivity values between visits, for the HFA (A & C) and the MP-1 (B & D), for Mean Sensitivity (MS) (A & B) and pointwise sensitivity (C & D). The horizontal solid line represents the mean difference and the dotted lines represent the 95% limits of agreement. The ceiling effect due to the MP-1 is indicated by the gray lines in (B) and (D).
Comparison of Fixation Measures
The recorded deviations on the HFA gaze graph had a greater magnitude than the equivalent deviations from the MP-1 fixation coordinates. Although a significant correlation between BCEA and gaze graph area was noted (Pearson’s correlation r = 0.348, p = 0.021), only 12% of the variance in BCEA was attributable to the gaze graph area (r2 = 0.121). The correlation increased slightly when comparing gaze graph area with the MP-1 fixation coordinates sampled at a similar rate to the HFA gaze tracker (r2 = 0.170).
Duration of Examination
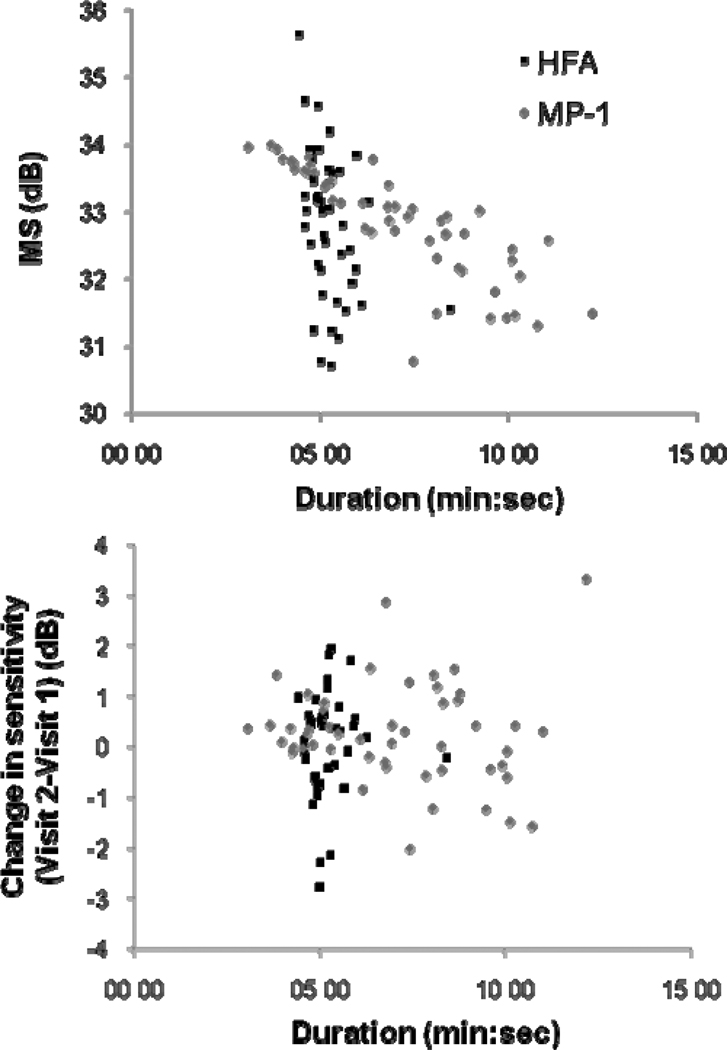
Mean examination duration was 5:14 min (SD 0:42 min, range 4:26 – 8:26 min) for the HFA and 6:11 min (SD 1:49 min, range 3:05 – 9:37 min) for the MP-1. This difference was statistically significant (unpaired t-test: t = 2.953, p = 0.004). Figure 7 shows the variation in test duration with sensitivity magnitude. For the HFA there was little variation in test duration with sensitivity whereas for the MP-1, subjects with lower sensitivities had longer examinations.
Figure 7.
Mean Sensitivity (MS) as a function of test duration. MP-1 data was converted to HFA equivalent units.
Comparison of MP-1 Local Defect Map to MP-1 TD Map
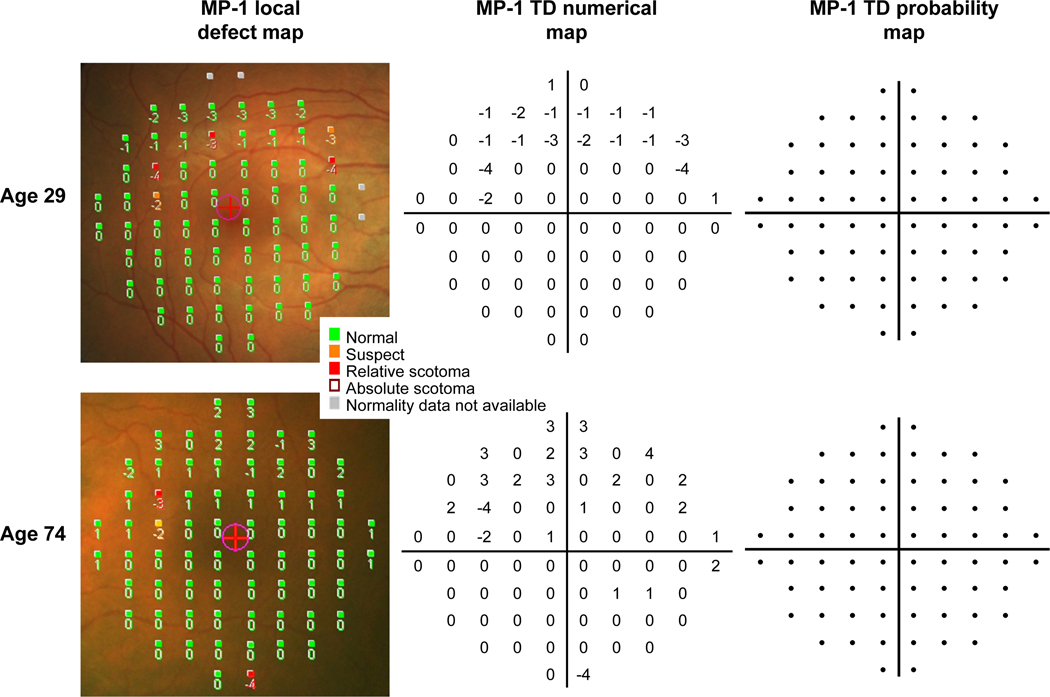
In a further 7 normal subjects, not included in the normative database, MP-1 TD maps were generated from our normative data (Bayesian model). Examples of these maps obtained from two of these subjects are shown in Figure 8. The numerical TD maps indicate the dB difference from the age-matched normal data and the probability TD maps indicate the statistical likelihood of this difference falling within the range of normal, as predicted by the Bayesian model. Similarities were found between numerical maps. Numerical TD maps (i.e. derived by our own normative data and Bayesian model) were similar to the numerical values of the local defect maps (LDM, i.e. derived from the existing MP-1 normative data) and the mean defect values (LDM: MD = 0 ± 0.4 dB) were also similar to the mean deviation (TD maps: MD = 0.1 ± 0.4 dB) values. Conversely, there were differences when we examined the defects defined by probability maps. All 7 subjects had no HFA TD defects, but 6 of the 7 subjects had up to 5 local defects (i.e. derived from the existing MP-1 normative data) as opposed to only 1 subject who had a single MP-1 TD defect (i.e. derived from our own normative data). The median number of defects identified by the LDM was 2 more than the number identified by the MP-1 TD map, and this difference was significant (Sign test p = 0.03).
Figure 8.
Example of MP-1 maps from two normal subjects of different ages. The MP-1 local defect maps show the numerical deviations (in dB) to the age-matched normal sensitivities superimposed on the fundus image. These maps also indicate a classification of “suspect” or “relative scotoma” based on probability values derived from the existing MP-1 normative database, and a classification of “absolute scotoma” if the stimulus was not seen. MP-1 total deviation (TD) maps were generated from our own normative database, using the Bayesian model. The TD numerical maps indicate the deviations from the age-matched normal sensitivities (in dB) and the TD probability maps show probability defects. The two subjects in this example had probability defects on the local defect map, but both had no defects on the TD probability maps. A color verison of this figure is available online at www.optvissci.com.
DISCUSSION
The clinical use of microperimetry has increased in recent years, as a method of detecting and evaluating scotomata and fixation stability in retinal disease.1–6 This study was designed to compare visual field results obtained by MP-1 microperimetry with the conventional visual field, acquired with the HFA, in normal subjects to show similarities and differences which may influence clinical interpretation. The secondary aim was to create a normative database specific to the 4-2 threshold strategy and 10-2 stimulus pattern, thus presenting information that is of value to the clinician in the interpretation of MP-1 visual fields.
When we compared visual field results obtained on the two instruments we found overall that sensitivity values and variability at each stimulus location were similar provided the MP-1 data were converted to equivalent HFA dB. Although MS and pointwise sensitivity values around the midline of the visual field were similar for both instruments (see Figure 1), sensitivity was lower in superior retinal locations for the MP-1. This finding is in contrast to those of standard perimetry studies12, 22–23 but in agreement with recent MP-1 studies.13, 24 In addition, between-subject variability was increased in superior peripheral retinal locations (see Figure 3), whereas it was more uniform across the field for the HFA. However it should be pointed out that many locations for the MP-1 had lower variability than any location for the HFA. A possible explanation for the MP-1 findings of decreased sensitivity and greater variability in superior retinal locations is the detection of angioscotoma,25–26 which may be increased due to a greater accuracy of fixation during MP-1 threshold estimation. It has also been suggested that the decreased sensitivity is an apparent defect caused by an instrument artifact.27
Test-retest variability for both the MP-1 and HFA was similar. In a previous study of patients with macular disease, a small improvement in MP-1 sensitivity between tests was reported, which did not reach statistical significance,28 and this is consistent with the results in this study, for both the MP-1 and the HFA. It is possible that this result was affected by the limitations of the normal sample in this study, which was composed of mostly good observers with a limited upper age range. Our assessment of test-retest variability was also limited by the number of repeated visual fields and would be enhanced by an increased number of visits. It is possible and would be advantageous to include double threshold determinations at predetermined locations in the MP-1 test-routines, in order to use the established methods of measuring variability in perimetry. These define short-term fluctuation (SF) and long-term fluctuation (LF) as the components of variability in automated static perimetry.29
Although the MP-1 provides the clinician with a similar choice of stimuli and test patterns to the HFA, there are important differences in the maximum and minimum stimulus and background luminances that can affect the interpretation of visual field results. Stimuli are presented on a background of 1.27 cd/m2 in the MP-1 compared to a background of 10 cd/m2 in the HFA. This results in a difference in the dynamic range of the two devices, such that the HFA is capable of presenting dimmer stimuli than the MP-1. The minimum stimulus luminance of the MP-1 (1.27cd/m2), at 20 dB is presented on a steady adapting background (1.27cd/m2), which gives a Weber contrast of 1 (ΔI/I). For the HFA, the minimum stimulus luminance of the HFA is 0.03 cd/m2 (51 dB), which has a Weber contrast of 0.003, although it is not possible for the human eye to detect this. In our study sample the HFA MS was 33dB (1.6cd/m2), for which the Weber contrast was 0.16. This indicates that the Weber contrast for the average stimulus seen by normal subjects was smaller than that of the minimum stimulus luminance of the MP-1. In this study we found evidence for a ceiling effect, as demonstrated by the large number of MP-1 sensitivities at 20 dB, the flattened age-related sensitivity decline (see Figure 4) and the significantly skewed distribution of data. Clinically, the ceiling effect is a potential limitation of the MP-1 as the capability to test beyond normal sensitivity is useful for monitoring patients with normal or greater than normal sensitivities over time. Although the low ceiling for the MP-1 reduced between-subject variability, with 25 locations having SDs <1.1 dB (the lower limit of SDs for the HFA; Figure 3), this effect led to non-Gaussian data distribution, which was then accounted for by the Bayesian method to derive the defect probability maps. The MP-1 ceiling is shown in Figure 4 and illustrates how the low ceiling can obscure age effects, for example, a slope of 0.4 dB per decade fitted to the MP-1 data points at ages >40 years, would extend beyond 20 dB at younger ages. In this study the HFA age-related decline of 0.4 dB per decade is consistent with previous studies,12, 30 however the MP-1 decline of 0.1 dB per decade is less than previously reported.9, 31 Possible reasons for this difference to previous studies include differing stimulus locations and threshold estimating algorithms, or a smaller sample size and narrower age range.
The difference in adapting background luminances provided by the two devices may affect the extent and depth of visual field deficits in patients. This is because the mechanisms mediating detection of the stimulus may differ. The low background used in the MP-1 is in the mesopic range and MP-1 increment thresholds may be mediated by mixed rod-cone system responses. Threshold values will vary depending on the spectral, spatial and temporal properties of the stimulus and they will vary with retinal eccentricity.32–33 In diseases such as cone-rod dystrophies, where rod function is less affected than cone function, the greater potential for rod intrusion would further confound interpretation of MP-1 results. In addition, the mesopic MP-1 background may result in more pronounced deficits. Increment threshold measurements have been shown to be dependent on adaptation level in diseases that primarily affect the photoreceptors such as retinitis pigmentosa (RP).34 Thus, measurements on the MP-1 would be expected to better discriminate between RP patients and normal subjects than those obtained on the HFA.
A significant advantage of the MP-1 microperimeter over the HFA is the capability for fixation stability quantification. In our study, quantification of fixation between instruments was only weakly correlated, due to the difference in the nature of the measurements. During MP-1 testing, stimulus presentation is temporarily interrupted in the event of large deviations in fixation, approximately 5–10° depending on pupil size, due to loss of the live infrared image. Conversely, the HFA continues testing during such large deviations and employs a coarser sampling frequency to produce the gaze graph. Spatial accuracy of the MP-1 sensitivity measures is therefore greater, although the 10-2 pattern does not precisely correspond to the HFA (see Figure 5). In normal subjects, this greater reliability of MP-1 testing is only at the cost of an extra minute of test duration, however this difference is likely to be larger in patients with unstable fixation or excessive head movement, due to the greater fixation accuracy required for continuation of MP-1 testing. Although total examination time is extended by the longer period required to adapt to the low background, the greater spatial accuracy is a considerable advantage for structure to function comparison.
The secondary aim of this study was to obtain normative data using the 4-2 threshold strategy and 10-2 stimulus pattern. The normative data collected in this study gave similar age-corrected deviation values to those provided by the existing normative data of the MP-1 (Figure 8), however the probability defects derived from each database were different. Normative perimetric data is essential to the identification and quantification of visual field abnormality. The existing MP-1 database was formed from 180 normal subjects.9–10 From this, defects of the local defect map are defined by confidence intervals calculated by a method of distribution-free estimation of age-related centiles.13, 35 In this study, we obtained a normal database of 50 subjects in order to have the capability to define TD defects in tests matched by stimulus pattern and threshold strategy. The Bayesian model used for our normative data to predict confidence intervals incorporates the ceiling effect as a parameter. Comparing between normative databases, the numerical age-corrected deviations had similar values, however the number of locations identified as defective was significantly greater with the machine normative data rather than using the Bayesian model (Figure 8). This could be explained by the wider confidence intervals of the Bayesian model being more suitable to the MP-1 data. Further study including a greater number of patients and those with visual field defects would be required for conclusive comparison of the local defect map and MP-1 TD map and this is currently underway. A limitation of our normative database is the sample size and a larger sample with a wider age range would be required to constitute empirical data from which to calculate the individual deviations from the normal reference values, as described by Heijl et al.18
In summary, the MP-1 is one of the few commercially available instruments to combine precise fundus tracking with automated visual field evaluation of the central macular area. For patients with unsteady or non-foveal fixation it provides a reliable and reproducible method for evaluating sensitivity in the macular area. The use of the HFA is not appropriate for visual field evaluation in these patients as accuracy of the measure is based on the assumption that fixation is foveal and stable during the exam. Not only is the MP-1 a useful tool for evaluating and following disease progression in patients with macular disease but the ability to measure function while simultaneously visualizing the fundus makes it very useful for studying patients with other retinal diseases such as diabetic retinopathy and retinitis pigmentosa. The principal advantages of the MP-1 are precise fundus tracking during testing, quantification of fixation stability and co-registration of results to the fundus image, although this relies on optical assumptions. When MP-1 results were compared to those obtained with the HFA, using equivalent units, the two instruments showed similar variability and test-retest variability. However there are important differences in thresholds, stimulus parameters and testing strategies that have to be taken into account when comparisons are made. When collecting normative data specific to the MP-1 instrument, threshold strategy and stimulus pattern, in a small sample, Bayesian modeling is appropriate from which to calculate total deviation defects. The clinical decision as to which device is the most appropriate choice will depend on the patient and clinical circumstance. For example, as a screening device in patients with retinal disease, for monitoring patients with unsteady and/or a non-foveal PRL and/or for precise monitoring of patients whose sensitivities fall within the dynamic range, the MP-1 is appropriate. For monitoring patients with near normal sensitivities, or very deep defects, and steady foveal fixation, use of the 10-2 pattern on the HFA should be considered. Initial results from both instruments would facilitate the decision as to which device would be the most appropriate for continued follow-up.
Supplementary Material
ACKNOWLEDGMENTS
This work was supported in part by National Institutes of Health Grants R01-EY02115, R01-EY09076, R01-EY015520 and the New York Community Trust.
The authors thank R.Theodore Smith for providing subjects. We are also grateful to Donald C. Hood and Robert P. Cubbidge for comments and discussion.
Footnotes
Publisher's Disclaimer: This is a PDF file of an unedited manuscript that has been accepted for publication. As a service to our customers we are providing this early version of the manuscript. The manuscript will undergo copyediting, typesetting, and review of the resulting proof before it is published in its final citable form. Please note that during the production process errors may be discovered which could affect the content, and all legal disclaimers that apply to the journal pertain.
The authors have no financial interests in this report.
REFERENCES
- 1.Cappello E, Virgili G, Tollot L, Del Borrello M, Menchini U, Zemella M. Reading ability and retinal sensitivity after surgery for macular hole and macular pucker. Retina. 2009;29:1111–1118. doi: 10.1097/IAE.0b013e3181a3b832. [DOI] [PubMed] [Google Scholar]
- 2.Finger RP, Charbel Issa P, Fimmers R, Holz FG, Rubin GS, Scholl HP. Reading performance is reduced by parafoveal scotomas in patients with macular telangiectasia type 2. Invest Ophthalmol Vis Sci. 2009;50:1366–1370. doi: 10.1167/iovs.08-2032. [DOI] [PubMed] [Google Scholar]
- 3.Kiss CG, Barisani-Asenbauer T, Simader C, Maca S, Schmidt-Erfurth U. Central visual field impairment during and following cystoid macular oedema. Br J Ophthalmol. 2008;92:84–88. doi: 10.1136/bjo.2007.124016. [DOI] [PubMed] [Google Scholar]
- 4.Kriechbaum K, Prager F, Geitzenauer W, Benesch T, Schutze C, Simader C, Schmidt-Erfurth U. Association of retinal sensitivity and morphology during antiangiogenic treatment of retinal vein occlusion over one year. Ophthalmology. 2009;116:2415–2421. doi: 10.1016/j.ophtha.2009.05.001. [DOI] [PubMed] [Google Scholar]
- 5.Varano M, Tedeschi M, Oddone F, Perillo L, Coppe AM, Parravano M. Microperimetric retinal changes in myopic choroidal neovascularization treated with intravitreal ranibizumab. Retina. 2010;30:413–417. doi: 10.1097/IAE.0b013e3181bd2d23. [DOI] [PubMed] [Google Scholar]
- 6.Yodoi Y, Tsujikawa A, Nakanishi H, Otani A, Tamura H, Ojima Y, Hayashi H, Yoshimura N. Central retinal sensitivity after intravitreal injection of bevacizumab for myopic choroidal neovascularization. Am J Ophthalmol. 2009;147:816–824. doi: 10.1016/j.ajo.2008.11.020. [DOI] [PubMed] [Google Scholar]
- 7.Ozturk F, Yavas GF, Kusbeci T, Ermis SS. A comparison among Humphrey field analyzer, Microperimetry, and Heidelberg Retina Tomograph in the evaluation of macula in primary open angle glaucoma. J Glaucoma. 2008;17:118–121. doi: 10.1097/IJG.0b013e31814b97fd. [DOI] [PubMed] [Google Scholar]
- 8.Lima VC, Prata TS, De Moraes CG, Kim J, Seiple W, Rosen RB, Liebmann JM, Ritch R. A comparison between microperimetry and standard achromatic perimetry of the central visual field in eyes with glaucomatous paracentral visual-field defects. Br J Ophthalmol. 2010;94:64–67. doi: 10.1136/bjo.2009.159772. [DOI] [PubMed] [Google Scholar]
- 9.Convento E, Barbaro G. Technical insights in the interpretation of automatic microperimetry. In: Midena E, editor. Perimetry and the Fundus: An Introduction to Microperimetry. Thorofare, NJ: SLACK Inc; 2007. pp. 229–237. [Google Scholar]
- 10.Rohrschneider K, Bultmann S, Springer C. Use of fundus perimetry (microperimetry) to quantify macular sensitivity. Prog Retin Eye Res. 2008;27:536–548. doi: 10.1016/j.preteyeres.2008.07.003. [DOI] [PubMed] [Google Scholar]
- 11.Wyatt HJ, Dul MW, Swanson WH. Variability of visual field measurements is correlated with the gradient of visual sensitivity. Vision Res. 2007;47:925–936. doi: 10.1016/j.visres.2006.12.012. [DOI] [PMC free article] [PubMed] [Google Scholar]
- 12.Heijl A, Lindgren G, Olsson J. Normal variability of static perimetric threshold values across the central visual field. Arch Ophthalmol. 1987;105:1544–1549. doi: 10.1001/archopht.1987.01060110090039. [DOI] [PubMed] [Google Scholar]
- 13.Midena E, Vujosevic S, Cavarzeran F. Normal values for fundus perimetry with the microperimeter MP1. Ophthalmology. 2010;117:1571–1576. doi: 10.1016/j.ophtha.2009.12.044. [DOI] [PubMed] [Google Scholar]
- 14.Durand AC, Gould GM. A method of determining ocular dominance. JAMA. 1910;55:369–370. [Google Scholar]
- 15.Timberlake GT, Mainster MA, Peli E, Augliere RA, Essock EA, Arend LE. Reading with a macular scotoma. I. Retinal location of scotoma and fixation area. Invest Ophthalmol Vis Sci. 1986;27:1137–1147. [PubMed] [Google Scholar]
- 16.Steinman RM. Effect of target size, luminance, and color on monocular fixation. [Accessed June 15, 2011];J Opt Soc Am. 1965 55:1158–1165. Available at: http://www1.psych.purdue.edu/~rsteinma/Bob-FOR%20CV/Steinman%201965%20%20JOSA%20thesis.pdf.
- 17.Crossland MD, Dunbar HM, Rubin GS. Fixation stability measurement using the MP1 microperimeter. Retina. 2009;29:651–656. doi: 10.1097/IAE.0b013e318196bd65. [DOI] [PubMed] [Google Scholar]
- 18.Heijl A, Lindgren G, Olsson J. A package for the statistical analysis of visual fields. Doc Ophthalmol Proc Ser. 1987;49:153–168. [Google Scholar]
- 19.Schiefer U, Wilhelm H. [Visual field compendium. Interpretation of perimetry findings. Comprehensive diagnostic measures] Klin Monbl Augenheilkd. 1995;206:206–238. doi: 10.1055/s-2008-1035431. [DOI] [PubMed] [Google Scholar]
- 20.Bland JM, Altman DG. Statistical methods for assessing agreement between two methods of clinical measurement. Lancet. 1986;1:307–310. [PubMed] [Google Scholar]
- 21.Gelman A, Carlin JB, Stern HS, Rubin DB. Bayesian Data Analysis, 2nd ed. Boca Raton: Chapman & Hall/CRC; 2004. [Google Scholar]
- 22.Hermann A, Paetzold J, Vonthein R, Krapp E, Rauscher S, Schiefer U. Age-dependent normative values for differential luminance sensitivity in automated static perimetry using the Octopus 101. Acta Ophthalmol. 2008;86:446–455. doi: 10.1111/j.1600-0420.2007.01055.x. [DOI] [PubMed] [Google Scholar]
- 23.Katz J, Sommer A. Asymmetry and variation in the normal hill of vision. Arch Ophthalmol. 1986;104:65–68. doi: 10.1001/archopht.1986.01050130075023. [DOI] [PubMed] [Google Scholar]
- 24.Springer C, Bultmann S, Volcker HE, Rohrschneider K. Fundus perimetry with the Micro Perimeter 1 in normal individuals: comparison with conventional threshold perimetry. Ophthalmology. 2005;112:848–854. doi: 10.1016/j.ophtha.2004.11.051. [DOI] [PubMed] [Google Scholar]
- 25.Remky A, Beausencourt E, Elsner AE. Angioscotometry with the scanning laser ophthalmoscope. Comparison of the effect of different wavelengths. Invest Ophthalmol Vis Sci. 1996;37:2350–2355. [PubMed] [Google Scholar]
- 26.Safran AB, Halfon A, Safran E, Mermoud C. Angioscotomata and morphological features of related vessels in automated perimetry. Br J Ophthalmol. 1995;79:118–124. doi: 10.1136/bjo.79.2.118. [DOI] [PMC free article] [PubMed] [Google Scholar]
- 27.Woods RL, Dagi LR, Cestari DM, Rizzo JF., III Apparent visual field defect found with Nidek MP-1 microperimeter is caused by an instrument artifact. Paper presented at Vision 2008: The 9th International Conference on Low Vision; July 7–11, 2008; Palais des Congrès de Montréal, Canada. [Google Scholar]
- 28.Chen FK, Patel PJ, Xing W, Bunce C, Egan C, Tufail AT, Coffey PJ, Rubin GS, Da Cruz L. Test-retest variability of microperimetry using the Nidek MP1 in patients with macular disease. Invest Ophthalmol Vis Sci. 2009;50:3464–3472. doi: 10.1167/iovs.08-2926. [DOI] [PubMed] [Google Scholar]
- 29.Bebie H, Fankhauser F, Spahr J. Static perimetry: accuracy and fluctuations. Acta Ophthalmol (Copenh) 1976;54:339–348. doi: 10.1111/j.1755-3768.1976.tb01263.x. [DOI] [PubMed] [Google Scholar]
- 30.Johnson CA, Adams AJ, Lewis RA. Evidence for a neural basis of age-related visual field loss in normal observers. Invest Ophthalmol Vis Sci. 1989;30:2056–2064. [PubMed] [Google Scholar]
- 31.Shah VA, Chalam KV. Values for macular perimetry using the MP-1 microperimeter in normal subjects. Ophthalmic Res. 2009;41:9–13. doi: 10.1159/000162111. [DOI] [PubMed] [Google Scholar]
- 32.Wyszecki G, Stiles WS. Color Science: Concepts and Methods, Quantitative Data, and Formulae, 2nd ed. New York: John Wiley & Sons; 2000. [Google Scholar]
- 33.Stockman A, Sharpe LT. Into the twilight zone: the complexities of mesopic vision and luminous efficiency. Ophthalmic Physiol Opt. 2006;26:225–239. doi: 10.1111/j.1475-1313.2006.00325.x. [DOI] [PubMed] [Google Scholar]
- 34.Alexander KR, Derlacki DJ, Fishman GA, Peachey NS. Acuity-luminance and foveal increment threshold functions in retinitis pigmentosa. Invest Ophthalmol Vis Sci. 1991;32:1446–1454. [PubMed] [Google Scholar]
- 35.Healy MJ, Rasbash J, Yang M. Distribution-free estimation of age-related centiles. Ann Hum Biol. 1988;15:17–22. doi: 10.1080/03014468800009421. [DOI] [PubMed] [Google Scholar]
Associated Data
This section collects any data citations, data availability statements, or supplementary materials included in this article.


