

Abstract
We recently developed 2D 1H-13C HSQC0 approach to quantify individual chemicals in complex mixtures. The HSQC0 approach has been implemented in phase-cycled and gradient selective versions. As in quantitative 1D NMR, the normalized integrated signal intensities in HSQC0 are proportional to the concentrations of individual chemicals in the mixture. We applied the HSQC0 approaches to selectively quantify thiocoraline present at a level of 1% w/w in an extract from a Verrucosispora sp. isolated from the sponge Chondrilla caribensis f. caribensis. We expect that this approach can be used to quantify other natural products of interest in extracts without prior purification.
The field of natural products has seen a constant increase in the application of quantitative NMR methods over the past 40 years.1 Quantitative NMR methods have been used, among other applications, for biosynthetic studies,2 quantification of species in complex mixtures,3 and regulation of reference materials.4 Quantitative NMR offers advantages over more sensitive MS-based methods in being unbiased and not subject to variability in ionization. Quantitative 1D proton NMR (qHNMR) has become a routine analytical tool because of its universality, sensitivity, precision, and nondestructive nature.1 Furthermore, the proportionality of the integrated intensities of proton resonances to the overall number of proton spins in the mixture makes qHNMR suitable for quantification of individual compounds in mixtures.1, 5 However, 1D qHNMR has shortcomings for signals that are overlapped6 as often is the case with complex mixtures of natural products.
Our recent extension of quantitative NMR to 2D 1H-13C spectroscopy overcomes the overlap problem by taking advantage of peak dispersion in the two dimensions. The cross-peaks in standard 2D 1H-13C NMR spectra, such as HSQC (homonuclear single quantum correlation), are not proportional to concentration as the result of several factors. We have shown that peak intensities that do scale with concentration can be determined by an approach called time-zero HSQC, or HSQC0.7 We have developed two versions of this experiment: phase-cycled HSQC07 and gradient-selective HSQC0.8 As in 1D qHNMR, the integrated signal intensities in the virtual HSQC0 spectrum are directly proportional to concentrations of individual chemicals in the mixture. With the HSQC0 approach, it is not necessary to relate measured intensities to data from the pure compound at known concentration; concentrations can be determined instead by reference to peak intensities of internal standards added at known concentration, for example, TMS ((CH3)4Si) for samples in CDCl3, or DSS (4,4-dimethyl-4-silapentane-1-sulfonic acid) for samples in aqueous solution. In theory, the HSQC0 approach can be used to quantify all individual chemicals in the mixture without isolation or purification.
We illustrate here the application of the HSQC0 approach to selectively quantify thiocoraline (1). Thiocoraline (1), which was first isolated in 1997 from the fermentation broth of Micromonospora marina,9, 10 has shown potent cytotoxicity in lung, breast, colon, renal, and melanoma cancer cells,10–12 and in vivo efficacy against human carcinoma xenografts.13 For this study, thiocoraline (1) was quantified in an extract from a Verrucosispora sp. isolated from the sponge Chondrilla caribensis f. caribensis.14 The isolation of thiocoraline (1) and related analogs from a Verrucosispora sp. was recently published.15
As described previously,7 a series of HSQCi spectra can be acquired with one, two, or three repetitions of the basic HSQC building block. The time-zero 2D 13C HSQC spectrum (HSQC0) is then obtained by linear regression extrapolation to zero repetitions (time zero). For gradient-selective HSQCi spectra,
| (1) |
and for phase-cycled HSQCi spectra,
| (2) |
where fA,n is the amplitude attenuation factor through each HSQC block specific for peak n; Ai,n and A0,n are the amplitudes of peak n in HSQCi spectra and the extrapolated virtual HSQC0 spectra; i is the number of times of repetition of the basic HSQC building block. Although the HSQC0 approach was designed initially for determining the absolute concentrations of individual compounds in metabolite mixtures, it also can be used to selectively quantify natural products of interest in an extract.
To evaluate the reproducibility of our measurements, two NMR samples were prepared from extracts from a Verrucosispora sp. Sample #1 contained 8.0 mg of the dry extract plus 2.59 μg TMS (final concentration 58.7 μM), and Sample #2 contained 4.0 mg of the dry extract plus 3.63 μg TMS (final concentration 82.3 μM). Note, the ratios of extract to TMS were intentionally different in the two samples. 40 μL of 4% Cr(AcAc)3 in CDCl3 was added to each sample as a relaxation enhancing agent, and CDCl3 was then added to a final volume of 500 μL for each sample. Independent HSQCi data sets were collected for each sample in both constant-time phase-cycled mode and non-constant-time gradient selective mode.
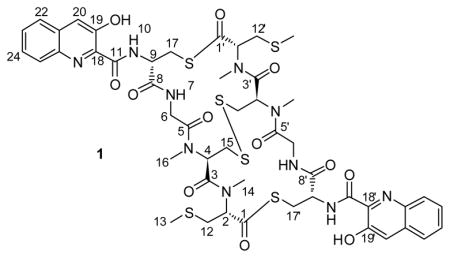
Cross-peaks assigned8 to the (13, 13′), (14, 14′), and (16, 16′) methyl groups of thiocoraline (1) (Figure 1) were chosen for quantifying thiocoraline (1) in the extract because of their characteristic and relatively stronger intensities. Intensities of these peaks, together with that of TMS, were manually integrated as described previously7 (Tables 1–3).
Figure 1.

(A) 700 MHz 2D constant-time phase-cycled HSQC1 spectrum of the NMR sample with 8.0 mg extract and 58.7 μM TMS as concentration reference in CDCl3. The cross-peaks of thiocoraline (1) used for the concentration measurement together with that of TMS methyl groups are shown in the expanded panels (B) 13, 13′ of thiocoraline (1), (C) TMS, and (D) 14, 14′ and 16, 16′ of thiocoraline (1).
Table 1.
Manually integrated peak volume from constant-time phase-cycled HSQCi of sample #1
| csC | csH | HSQC1 | HSQC2 | HSQC3 | Corr. Coef. | Scaling factor | A0 | # of H | Normalized A0 | Ave./Stdev | w/w % of thiocoraline | |
|---|---|---|---|---|---|---|---|---|---|---|---|---|
| 13,13′ | 15.166 | 2.137 | 2.55E+09 | 1.63E+09 | 1.41E+09 | −0.9592 | 0.7436 | 3.26E+09 | 6 | 5.43E+08 | 5.81E+08 | |
| 14,14′ | 30.773 | 3.059 | 2.63E+09 | 2.00E+09 | 1.33E+09 | −0.9936 | 0.7111 | 3.78E+09 | 6 | 6.30E+08 | 7.69% | 1.12% |
| 16,16 | 30.627 | 3.013 | 2.31E+09 | 1.69E+09 | 1.10E+09 | −0.9959 | 0.6901 | 3.41E+09 | 6 | 5.69E+08 | Mol. of TMS | |
| TMS | 19.999 | 0 | 1.96E+09 | 1.72E+09 | 1.17E+09 | −0.9617 | 0.7726 | 2.65E+09 | 12 | 2.21E+08 | 2.93584E-08 |
Table 3.
Manually integrated peak volume from constant time phase-cycled HSQCi of sample #2
| csC | csH | HSQC1 | HSQC2 | HSQC3 | Corr. Coef. | Scaling factor | A0 | # of H | Normalized A0 | Ave./Stdev | w/w % of thiocoraline | |
|---|---|---|---|---|---|---|---|---|---|---|---|---|
| 13,13′ | 15.153 | 2.139 | 6.98E+08 | 5.13E+08 | 4.51E+08 | −0.9731 | 0.8038 | 8.43E+08 | 6 | 1.40E+08 | 1.73E+08 | |
| 14,14′ | 30.754 | 3.059 | 7.98E+08 | 4.44E+08 | 4.07E+08 | −0.9193 | 0.7142 | 1.03E+09 | 6 | 1.71E+08 | 19.15% | 0.90% |
| 16,16 | 30.608 | 3.011 | 7.97E+08 | 4.42E+08 | 3.06E+08 | −0.9912 | 0.6196 | 1.24E+09 | 6 | 2.07E+08 | Mol. of TMS | |
| TMS | 19.997 | 0 | 2.11E+09 | 1.60E+09 | 1.24E+09 | −0.9997 | 0.7666 | 2.74E+09 | 12 | 2.29E+08 | 4.11471E-08 |
NMR sample #2: 82.3 μM TMS (3.63 μg in 500 μL) was added as concentration reference into the NMR sample solution with 4.0 mg extract. Molecular weights of TMS and thiocoraline are 88.22 and 1157.41, respectively.
As shown in Figure 2, the peak intensities of the (13, 13′), (14, 14′) and (16, 16′) methyl groups of thiocoraline (1) and that of methyl groups of TMS in HSQC0 were extrapolated by linear regression according to Eq. (1) or Eq. (2). As predicted, the slopes of the linear regressions of the gradient-selective data (Figure 2B) are steeper due to the scaling factor of 0.5 (Eq. 1) than those for the constant-time data (Figure 2A, C; Eq. 2). The intercepts from the linear regressions that were obtained using the gradient-selective pulse program in Figure 2B are larger because of the signal enhancement due to the linear recombination of the time-domain NMR data recorded in the echo-antiecho mode before Fourier transformation. The extrapolated HSQC0 peak intensities, A0, are shown in Tables 1–3 along with the values normalized by the corresponding number of attached protons. The averaged normalized peak intensities in HSQC0 from the cross-peaks of the (13, 13′), (14, 14′), and (16, 16′) methyl groups of thiocoraline (1) were used to calculate the final quantity of thiocoraline (1) in the extract by reference to the TMS reference standard:
| (3) |
Figure 2.

Extrapolations of the peak intensities of 13, 13′ (◆), 14, 14′, (■) and 16, 16′ (▲) methyl groups of thiocoraline and that of the methyl groups of TMS (×) to yield HSQC0 intensities from (A) constant-time phase-cycled HSQCi of sample #1, (B) Non-constant-time gradient-selective HSQCi of sample #1, (C) constant time phase-cycled HSQCi of sample #2.
As shown in Tables 1–3, the quantities of thiocoraline (1) in the extract of a Verrucosispora sp. were determined to be 1.12%, 1.17%, and 0.90% from the constant time phase-cycled HSQCi, non-constant time gradient selective HSQCi of sample #1, and constant time phase-cycled HSQCi of sample #2, respectively. Thus, the quantity of thiocoraline (1) in the extract of a Verrucosispora sp. is estimated to be 1.0 % (w/w). This calculated concentration equates to ~8.5 mg of thiocoraline (1) produced per liter of medium cultured, in agreement with actual quantities of thiocoraline (1) isolated in the laboratory.
In this paper, we demonstrated how to use the newly developed HSQC0 NMR approach to selectively quantify thiocoraline (1) in an extract from a Verrucosispora sp. isolated from the sponge Chondrilla caribensis f. caribensis without any purification. The HSQC0 approach can be used to quantify a variety of natural products of interest at low concentrations (μM) in complex extracts even if they are difficult to isolate or purify. It can be used to standardize herbal extracts through quantification of the standard ingredients. Furthermore, it can be used in the selection or optimization of media for the production of (isotope labeled) compounds and for optimization of protocols for compound isolation and purification.
EXPERIMENTAL SECTION
Biological Material
Sponge specimens were collected on February 10, 2010, in the Florida Keys (24° 39′ 17.90″, 81° 17′ 51.09″). A voucher specimen for Chondrilla caribensis f. caribensis (FLK-10-4-24) is housed at the University of Wisconsin-Madison. Strain WMMA107 was isolated from the sponge Chondrilla caribensis f. caribensis (FLK-10-4-24) and was identified as a marine actinomycete, Verrucosispora sp. Details of the cultivation, purification and 16S ribosomal DNA sequencing16, 17 of the Verrucosispora sp. have been reported.15
Fermentation and Extraction
Strain WMMA107 was fermented in 25 × 150 mm culture tubes (4 × 10 mL) in medium ASW-A (20 g soluble starch, 10 g glucose, 10 g peptone, 5 g yeast extract, 5 g CaCO3 per liter of artificial seawater) for one week at 28 °C. A 250 mL baffled flask containing 50 mL medium ASW-A with Diaion HP20 (4% by weight) was inoculated with 2 mL from culture tube and shaken at 200 RPM at 28 °C for one week. Filtered HP20 was washed with H2O and extracted with 50 mL acetone for 2 hrs.
NMR Sample Preparation
The dry extract (40.0 mg) was dissolved in 3 mL CHCl3. 600 μL (Sample #1) and 300 μL (Sample #2) aliquots were removed and dried (8.0 and 4.0 mg, respectively). Standard solutions of TMS were prepared by dilutions of a stock solution of TMS in CDCl3 (0.147 mM). The NMR samples were prepared by dissolving Sample #1 and Sample #2 in 500 μL of CDCl3 containing TMS at concentrations of 58.7 μM and 82.3 μM, respectively. 40 μL of 4% Cr(AcAc)3 in CDCl3 was added as a relaxation enhancing agent to each sample. NMR-grade CDCl3 (99.8% D, Cambridge Isotopes Laboratory) was used for both samples.
NMR Experiments
All NMR data were collected at 25 °C on a Bruker Avance III 700 MHz spectrometer equipped with 5 mm QCI probe, with radio-frequency pulses applied on 1H and 13C at 2.5 ppm and 23 ppm, respectively. GARP 13C decoupling used a field strength of γB2 = 2.5 kHz. 2048 × 42 complex data points with spectral width of 16 ppm and 20 ppm, respectively, were collected along the 1H and 13C dimensions, with 64 scans per FID and an inter-scan delay of 2.6 s (longer than 5 times of the longest proton T1), resulting in a total acquisition time of 4 h 15 min for each HSQCi. Measurement of proton T1 values was conducted by using a standard inversion recovery pulse sequence (180°- τ −90°). For non-constant-time gradient-selective HSQCi, the strength of the pulsed field gradients applied along the z-axis were: g1 = 80%; g2 = 20.1%; g3 = 70%; g4 = 17.5875%, g5 = 60%; g6 = 15.075%; g13 = 70%; g14 = 85%, g15 = 15%; g6 = 90% of the maximum of 53 G/cm; all with a duration of 1 ms followed by a gradient recovery period of 200 μs. Quadrature detection in the 13C (t1) dimension was achieved by echo-antiecho by flipping the polarity of gradient g1. For constant-time phase-cycled HSQCi, the constant time T was set to 12 ms without applying gradients g1 to g6. Quadrature detection in the 13C (t1) dimension was achieved using States-TPPI applied to the phase φ2. Intensities of relevant peaks are manually integrated as described before7 and the data are shown in Table 1–3.
Table 2.
Manually integrated peak volume from Non-constant-time gradient-selective HSQCi of sample #1
| csC | csH | HSQC1 | HSQC2 | HSQC3 | Corr. Coef. | Scaling factor | A0 | # of H | Normalized A0 | Ave./Stdev | w/w % of thiocoraline | |
|---|---|---|---|---|---|---|---|---|---|---|---|---|
| 13,13′ | 15.16 | 2.136 | 2.64E+09 | 8.92E+08 | 3.82E+08 | −0.9975 | 0.3804 | 6.67E+09 | 6 | 1.11E+09 | 1.26E+09 | |
| 14,14′ | 30.77 | 3.059 | 2.70E+09 | 1.04E+09 | 3.08E+08 | −0.9976 | 0.3377 | 8.35E+09 | 6 | 1.39E+09 | 11.16% | 1.17% |
| 16,16 | 30.615 | 3.012 | 2.58E+09 | 1.07E+09 | 3.27E+08 | −0.9964 | 0.3560 | 7.63E+09 | 6 | 1.27E+09 | Mol. of TMS | |
| TMS | 19.996 | 0 | 2.10E+09 | 7.77E+08 | 3.01E+08 | −0.9999 | 0.3786 | 5.50E+09 | 12 | 4.59E+08 | 2.93584E-08 |
NMR sample #1: 58.7 μM TMS (2.59 μg in 500 μL) was added as concentration reference into the NMR sample solution with 8.0 mg extract. Molecular weights of TMS and thiocoraline are 88.22 and 1157.41, respectively.
Acknowledgments
This work was supported by funding from the University of Wisconsin-Madison School of Pharmacy, the Graduate School at the University of Wisconsin, and the UW College of Agriculture and Life Sciences. This study made use of the National Magnetic Resonance Facility at Madison, which is supported by NIH grants P41RR02301 and 1S10RR025062 (BRTP/NCRR). We thank M. K. Harper, Department of Medicinal Chemistry, College of Pharmacy, University of Utah, for assistance with taxonomy.
References
- 1.Pauli GF, Jaki BU, Lankin DC. J Nat Prod. 2005;68:133–149. doi: 10.1021/np0497301. [DOI] [PubMed] [Google Scholar]
- 2.Schoen J, Modha A, Maslow K, Novak M, Blackburn BJ. Int J Parasitol. 1996;26:713–722. doi: 10.1016/0020-7519(96)00050-1. [DOI] [PubMed] [Google Scholar]
- 3.Rivero-Cruz B, Rivero-Cruz I, Rodriguez JM, Cerda-Garcia-Rojas CM, Mata R. J Nat Prod. 2006;69:1172–1176. doi: 10.1021/np060180b. [DOI] [PubMed] [Google Scholar]
- 4.Jaki B, Sticher O, Veit M, Frohlich R, Pauli GF. J Nat Prod. 2002;65:517–522. doi: 10.1021/np0100800. [DOI] [PubMed] [Google Scholar]
- 5.Akoka S, Barantin L, Trierweiler M. Anal Chem. 1999;71:2554–2557. doi: 10.1021/ac981422i. [DOI] [PubMed] [Google Scholar]
- 6.Lewis IA, Schommer SC, Hodis B, Robb KA, Tonelli M, Westler WM, Sussman MR, Markley JL. Anal Chem. 2007;79:9385–9390. doi: 10.1021/ac071583z. [DOI] [PMC free article] [PubMed] [Google Scholar]
- 7.Hu KF, Westler WM, Markley JL. J Am Chem Soc. 2011;133:1662–1665. doi: 10.1021/ja1095304. [DOI] [PMC free article] [PubMed] [Google Scholar]
- 8.Hu KF, Ellinger JJ, Chylla RA, Markley JL. Anal Chem. 2011 doi: 10.1021/ac200536b. submitted. [DOI] [PMC free article] [PubMed] [Google Scholar]
- 9.Perez Baz J, Canedo LM, Fernandez Puentes JL, Silva Elipe MV. J Antibiot. 1997;50:738–741. doi: 10.7164/antibiotics.50.738. [DOI] [PubMed] [Google Scholar]
- 10.Romero F, Espliego F, Baz JP, DeQuesada TG, Gravalos D, DelaCalle F, Fernadez Puertes JL. J Antibiot. 1997;50:734–737. doi: 10.7164/antibiotics.50.734. [DOI] [PubMed] [Google Scholar]
- 11.Erba E, Bergamaschi D, Ronzoni S, Faretta M, Taverna S, Bonfanti M, Catapano CV, Faircloth G, Jimeno J, D’Incalci M. Br J Cancer. 1999;80:971–980. doi: 10.1038/sj.bjc.6690451. [DOI] [PMC free article] [PubMed] [Google Scholar]
- 12.Negri A, Marco E, Garcia-Hernandez V, Domingo A, Llamas-Saiz AL, Porto-Sanda S, Riguera R, Laine W, David-Cordonnier MH, Bailly C, Garcia-Fernandez LF, Vaquero JJ, Gago F. J Med Chem. 2007;50:3322–3333. doi: 10.1021/jm070381s. [DOI] [PubMed] [Google Scholar]
- 13.Faircloth G, Jimeno J, Dincalci M. Eur J Cancer. 1997;33:781–781. [Google Scholar]
- 14.Rutzler K, Duran S, Piantoni C. Mar Ecol. 2007;28(Suppl 1):95–111. [Google Scholar]
- 15.Wyche TP, Hou Y, Braun D, Cohen HC, Xiong MP, Bugni TS. J Org Chem. 2011 doi: 10.1021/jo200661n. in press. [DOI] [PMC free article] [PubMed] [Google Scholar]
- 16.Drancourt M, Bollet C, Carlioz A, Martelin R, Gayral JP, Raoult D. J Clin Microbiol. 2000;38:3623–3630. doi: 10.1128/jcm.38.10.3623-3630.2000. [DOI] [PMC free article] [PubMed] [Google Scholar]
- 17.Zhu S, Fushimi H, Cai SQ, Komatsu K. Planta Medica. 2003;69:647–653. doi: 10.1055/s-2003-41117. [DOI] [PubMed] [Google Scholar]