

Abstract
In many kidney diseases, the original insult primarily involves the glomerulus and may then pass onto the tubulointerstitium. Several hypotheses link glomerular disease to tubular injury; perhaps the foremost hypothesis involves chronic tubular hypoxia. The reported effects of hypoxia and consecutive stabilization of hypoxia-inducible factors (HIFs), however, are controversial. Hypoxia induces interstitial fibrosis but also has beneficial effects on renal disease progression when HIF is activated pharmacologically. To analyze the impact of HIF on tubulointerstitial disease development in primary glomerular disease, transgenic von Hippel Lindau (VHL)-knockout mice were generated and null expression was induced before the onset of autoimmune IgG-mediated anti–glomerular basement membrane glomerulonephritis (GN). Tubular VHL knockout and, thus, local HIF-α stabilization increased renal production of vascular endothelial growth factor, tumor growth factor–β1, and platelet-derived growth factor-B, resulting in augmented formation of capillaries and interstitial matrix, and conversion of fibroblasts to myofibroblasts. Within the glomerular disease, VHL knockout reduced the glomerular damage and attenuated tubulointerstitial injury. Likewise, proteinuria, plasma urea concentration, and tubulointerstitial matrix were decreased in VHL knockout with GN. These findings shown that tubular HIF-α stabilization in glomerular disease is beneficial for disease outcome. In comparison with VHL knockout alone, GN is a much stronger activator of fibrosis such that stimuli other than hypoxia may be considered important for renal disease progression.
Many forms of acute glomerulonephritis (GN) tend to progress to chronic GN, which is characterized by irreversible, progressive glomerular and tubulointerstitial fibrosis. The insult involves primarily the glomerulus and then may be transferred to the tubulointerstitium, but the relationship between glomerular damage and tubular injury remains incompletely understood.1, 2, 3 There are several hypotheses linking primary glomerular disease to tubular injury; perhaps the foremost involves the occurrence of tubular hypoxia.4, 5
Renal hypoxia may result from a combination of structural and functional changes. Structural alterations include capillary rarefaction; compromised peritubular blood flow resulting from glomerular injury, which may involve the efferent arterioles and affect the blood supply for the tubule; and limited oxygen diffusion as a consequence of extracellular matrix expansion. Functional changes comprise vasoconstriction from altered levels of vasoactive factors and signaling molecules, increased oxygen demand from hyperfiltration and tubular hypertrophy, and renal anemia.4, 6, 7
Hypoxic conditions lead to stabilization of hypoxia-inducible factors (HIF) belonging to the Per-ARNT-Sim family of basic helix-loop-helix transcription factors and consisting of an oxygen-sensitive α-subunit and a constitutively expressed β-subunit.8 Under conditions of normal oxygen tension HIF is hydroxylated and rapidly degraded by proteasomal inactivation. von Hippel-Lindau (VHL) is a component of the E3 ubiquitin ligase that targets proteins for degradation in the proteasome. Loss of VHL leads to stabilization of HIF-α subunits. On increased stability of HIF-α subunits, they translocate into the nucleus to form a heterodimer with the β-subunit. The heterodimer then binds to the hypoxia-response elements and activates the transcription of HIF-mediated genes participating in cell adaptation to hypoxia. There are more than 100 genes whose expression is mediated by HIF, and that control cell metabolism, survival, angiogenesis, vascular tone, and tissue oxygenation.6 The effects of hypoxia and HIF-α induction on the progression of a renal disease, however, are discussed controversially. Renal HIF-1α expression correlates with the degree of tissue injury and fibrosis,9 suggesting a relevance to the development and progression of kidney diseases. Conversely, activation of HIF has been shown to ameliorate disease development in anti-Thy1 GN,10 remnant kidney model,11 and in a model of diabetic nephropathy.12
To analyze the impact of tubular HIF-α induction in the setting of a transfer from a primary glomerular disease onto the tubulointerstitium, a preventive strategy was chosen. Therefore, a tetracycline-inducible VHL-knockout mouse model was generated and induced before the onset of a rapid progressive GN. VHL knockout resulted in augmented interstitial capillary proliferation and marginal matrix production. However, anti–glomerular basement membrane (GBM) GN was significantly less developed in VHL knockout mediated through diminished glomerular disease development. In this context, the beneficial effects of tubular HIF-α stabilization clearly overbalanced the harmful increase in interstitial matrix, leading to attenuation in disease progression.
Materials and Methods
Transgenic Animals
A conditional transgenic system was used to disrupt VHL expression within the renal tubular system of adult mice. Three transgenic mouse lines were cross-bred: i) Pax8–reverse tetracycline-dependent transactivator mice, which express the reverse tetracycline-dependent transactivator under control of the Pax8 promoter (expressed along the tubular system and periportal hepatocytes with an efficiency of ∼65%),13 ii) LC-1 mice, which express Cre recombinase under the control of the bidirectional Ptet promoter,14 and iii) VHLflox/flox mice for targeted disruption of VHL.15 All mice were genotyped by PCR analysis of tail DNA for Pax8–reverse tetracycline-dependent transactivator, LC-1, and VHLflox/flox.
Experimental Design
A total of 32 3-month-old male mice from several litters were used and divided into four groups. For the induction of the VHL knockout, mice (n = 16) received 0.2 mg/mL doxycycline/5% glucose in the drinking water for 2 days. The control mice (n = 16) received only 5% glucose in the drinking water. Initiation of VHL knockout was performed 3 days before the anti-GBM administration. For the induction of the anti-GBM GN all mice were primed immunologically by subcutaneous injection of rabbit IgG in complete Freund's adjuvant. GN was induced 6 days later by the intravenous injection of a rabbit anti-mouse GBM serum16 (n = 20), whereas the control mice (n = 12) received an injection of vehicle (0.9% NaCl). All mice were sacrificed after 18 days of anti-GBM GN treatment.
Group specification was as follows: group 1 (−DOX; n = 6) received vehicle injection; group 2 (+DOX; n = 6) received 0.2 mg/mL doxycycline and vehicle injection; group 3 (−DOX/GN; n = 10) received injection of rabbit anti-GBM serum; and group 4 (+DOX/GN; n = 10) received 0.2 mg/mL doxycycline and injection of anti-GBM serum. The experimental design of this study was approved by the local authorities according to the German and Swiss laws for protection of animals (registered under G 0178/03 and Fr 51/10).
Before the experiment and then once a week afterward, ∼200 μL of blood was collected by puncture of the submandibular vein from each animal under isoflurane anesthesia. Hemoglobin concentration was determined by ABL800 FLEX (Radiometer, Willich, Germany). Plasma urea nitrogen was quantified enzymatically using routine automated methods (Modular Analytics; Roche Diagnostics, Mannheim, Germany). Plasma vascular endothelial growth factor (VEGF) levels were determined by a commercial enzyme-linked immunosorbent assay (Raybiotech, Heidelberg, Germany). For urinary protein analysis, mice were placed individually in metabolic cages for 24 hours and urine protein concentration was measured with a standardized autoanalyzer (Hitachi 747; Roche Diagnostics).
Detection of Circulating Anti-Rabbit IgG
For the detection of circulating anti-rabbit IgG, microtiter plates were coated with 100 μg/mL rabbit IgG (Jackson Laboratories, West Grove, PA) followed by blocking with 5% skim milk and incubation with mouse serum obtained from each animal at the end of the experiment. After the incubation with horseradish-peroxidase–conjugated goat anti-mouse IgG (Abcam, Cambridge, UK) the signal was generated using 3,3′,5,5′-tetramethylbenzidine (Sigma Aldrich, München, Germany) and measured at 450 nm.
Perfusion, Fixation, and Tissue Processing
Mice were anesthetized by an intraperitoneal injection of sodium pentobarbital (0.06 mg/g body weight). After laparotomy, one kidney was clamped, removed, and shock-frozen for biochemical analysis and the other kidney then was perfused in vivo via the abdominal aorta using 3% paraformaldehyde. For cryostat sectioning, tissues were shock-frozen and stored at −80°C. Alternatively, tissues were postfixed in 3% paraformaldehyde, dehydrated, and standard paraffin-embedded. For ultrastructural analysis, kidney specimens were postfixed in 1.5% paraformaldehyde/PBS containing 1.5% glutaraldehyde, and 0.05% picric acid, rinsed, and stored in PBS until embedding in Epon (Serva, Heidelberg, Germany). Ultrathin sections were viewed in a Zeiss EM 906 electron microscope (Zeiss, Oberkochen, Germany).
RNA Isolation, Reverse Transcription, and Real-Time PCR
Total RNA was extracted from kidney homogenates using the RNeasy Mini kit (Qiagen, Hilden, Germany). Genomic DNA was digested by DNase I (Invitrogen, Carlsbad, CA), and cDNA was synthesized by reverse transcription of 5 μg of total RNA (SuperScript First-Strand Synthesis System; Invitrogen). TaqMan Gene Expression Assays were used, and the product IDs were as follows: erythropoietin, Mm01202755_m1; VEGF-A, Mm00437306_m1; tumor growth factor–β1 (TGF-β1), Mm03024053_m1; and platelet-derived growth factor-B (PDGF-B), Mm01298578_m1. The experiments were performed according to the manual provided by Applied Biosystems (Foster City, CA). Amplifications were performed using the real-time PCR TaqMan Fast 7500 (Applied Biosystems). Threshold cycle values were set in the linear phase of exponential amplification. The difference (Δ threshold cycle) between values obtained for erythropoietin, VEGF, TGF-β1, PDGF-B, and the housekeeping genes 28S ribosomal RNA Mm03682676_s1 and TATA-box binding protein Mm00446973_m1 were calculated and the mRNA abundance of all four groups is presented in percentages.
In Situ Hybridization
The mRNA expression of TGF-β1 and osteopontin was investigated by in situ hybridization using digoxigenin-labeled riboprobes (Roche). Sense and antisense probes were generated by in vitro transcription of a 700-bp TGF-β1 cDNA and a 1100-bp osteopontin cDNA template. In situ hybridization was performed on 5-μm–thick paraffin sections according to an established protocol.17 Signal was generated with 4-nitroblue tetrazolium chloride. For control, sense probes were applied in parallel with antisense probes.
Immunohistochemistry
Immunohistochemistry for VHL, HIF-1α, HIF-2α, and heme oxygenase-1 (HO-1) was performed on 4-μm–thick paraffin sections using the Catalyzed Signal Amplification System (Dako, Baar, Switzerland). VEGF immunostaining was performed with the Vectastain ABC kit (Vector, Burlingame, CA). Immunohistochemistry using fluorescence-coupled secondary antibodies was used for all other immunodetections. The following antibodies were used: polyclonal rabbit anti-VHL (Labforce, Nunningen, Switzerland), polyclonal rabbit anti-HIF1α (Cayman Chemicals, Ann Arbor, MI), polyclonal rabbit anti-HIF2α (PM9 kindly provided by Patrick Maxwell), polyclonal goat anti-VEGF antibody (R&D Systems, Minneapolis, MN), polyclonal rabbit anti-rat type I collagen antibody (Biotrend, Köln, Germany), polyclonal rabbit anti–Wilms tumor-1 antibody (Santa Cruz Biotechnology, Heidelberg, Germany), monoclonal rat anti–Ki-67 antibody (Dako), rabbit anti-5′ectonucleotidase (kind gift from Johannes Loffing), polyclonal rabbit anticaveolin (Santa Cruz Biotechnology), polyclonal rabbit anti–TGF-β1 (Acris, Herford, Germany), rabbit anti–α-smooth muscle actin (α-SMA; Abcam), and rabbit anti–HO-1 (Acris). For all antibodies, negative controls were used in which the primary antibody was omitted. For double-labeling, primary antibodies were administered consecutively. Light microscopy specimens were evaluated using a Leica DMRB fluorescence microscope (Leica Microsystems, Heerbrugg, Switzerland) equipped with a digitized camera system and MetaView software (Visitron Systems, München, Germany). Immunofluorescence microscopy specimens were analyzed using a confocal scanning microscope (TCS SP-2; Leica Microsystems).
Western Blotting
Total kidney homogenate was produced using sucrose buffer containing 250 mmol/L sucrose, 10 mmol/L triethanolamine, and protease inhibitor cocktail (Complete, Roche Diagnostics) and centrifuged to remove nuclei and cellular debris. Total protein concentration was measured using the Pierce BCA Protein Assay reagent kit (Rockford, IL) and controlled by Coomassie staining. Fifty micrograms of protein was loaded onto 10% to 12% gradient polyacrylamide gels. After SDS-PAGE and electrophoretic transfer of proteins to nitrocellulose membranes, equal protein loading and blotting was verified by membrane staining using Ponceau red. Membranes were probed overnight with antibodies directed against VHL, VEGF, TGF-β1, α-SMA, type 1 collagen, and HO-1, followed by exposure to horseradish-peroxidase–conjugated secondary antibodies (Dako). Immunoreactive bands were detected on the basis of chemiluminescence, using an enhanced chemiluminescence kit (Amersham Biosciences, Buckinghamshire, UK) before exposure to X-ray films (Hyperfilm, Amersham Biosciences). For densitometric evaluation of the resulting bands, films were scanned and analyzed using BIO-PROFIL Bio-1D image software (Vilber Lourmat, Marne-la-Vallée, France).
Morphometry
Damage Scoring
Glomerular and tubulointerstitial damage was determined as described,16, 18, 19 and assessed on PAS-stained paraffin sections. A semiquantitative glomerulosclerosis score was established by grading the severity of sclerosis for each glomerulus. Grading was set from 0 to 4 with 0 representing no lesion, 1 representing sclerosis of less than 25% of the glomerulus, and 2, 3, and 4 representing sclerosis of 25% to 50%, 50% to 75%, and more than 75% of the glomerulus, respectively. A whole kidney average sclerosis index was obtained by averaging scores of all glomeruli on one section. On average, 100 to 150 glomeruli were assessed per mouse. The glomerular damage comprised segmental or global collapse of capillaries, with or without associated hyaline deposition, adhesion of the capillary tuft to Bowman's capsule, detachment of podocytes from the GBM, and thickening of mesangial matrix. To assess tubulointerstitial changes a semiquantitative score was established to evaluate the degree and extent of tubulointerstitial damage of each field and was graded from 0 to 4 as follows: 0 represents no lesion, 1 represents tubulointerstitial damage of less than 25% per field, and 2, 3, and 4 represent tubulointerstitial damage of 25% to 50%, 50% to 75%, and more than 75% of the tubulointerstitium, respectively. Approximately 30 cortical and medullary visual fields (20×) per kidney were evaluated. Tubulointerstitial injury was defined by features such as tubular collapse, cast formation with tubular dilatation or atrophy, detachment of cells from the basement membrane, thickening of the tubular basement membrane, number of interstitial cells, and interstitial fibrosis.
Podocyte Density
Paraffin sections were stained with antibodies against WT-1 and positive podocyte nuclei were counted in 40 to 50 glomerular profiles per animal. The podocyte density was calculated by relating the number of positive nuclei to the measured tuft area, which was estimated by stereology using image analysis software from MetaView.
Tuft volume was calculated from the mean tuft area by using the following formula: VT = (β/k)(tuft areas)3/2, where β = 1.38 (shape coefficient for spheric particles) and k = 1.1 (size distribution coefficient for spheres).19
Glomerular Capillary Density
Semithin plastic sections were stained with Richardson's solution. The area of perfused glomerular capillaries was estimated stereologically on 30 glomeruli per animal. The density of perfused capillaries was calculated by relating the area of perfused capillaries to the measured tuft area.
Tubulointerstitial Capillary Density
Semithin sections were used to estimate the fraction of the tubular circumference that is in close contact to capillaries. Approximately 50 cortical tubules per animal were evaluated stereologically and capillary-epithelial contact areas were calculated for all four grades of tubular degeneration as described by Le Hir and Besse-Eschmann.20
Cellular Proliferation
Cell proliferation was assessed with the Ki-67 antibody technique using paraffin sections. The number of Ki-67–positive endothelial nuclei (as determined by double-labeling with caveolin) was estimated. Results from numeric evaluation were expressed as the number of labeled glomerular cells per glomeruli or tubulointerstitial cells per visual field (40×). The number of Ki-67–positive epithelial cells were counted and expressed as the number of Ki-67–positive epithelial cells per visual field (40×).
Presentation of Data and Statistical Analysis
Quantitative data are presented as means ± SD. For statistical comparison, the Mann-Whitney U-test was used. P < 0.05 were considered statistically significant.
Results
Induction of VHL Knockout and GN
Immunohistochemistry of VHL revealed an expression in the proximal tubule with predominance in the convoluted portion. In +DOX and +DOX/GN, conditional VHL knockout resulted in a strongly reduced tubular epithelial VHL expression (Figure 1A) appearing in a mosaic pattern. Western blot analysis of VHL on renal tissue confirmed the kidney targeted deletion of about 65% (see Supplemental Figure S1 at http://ajp.amjpathol.org). Administration of doxycycline resulted in the well-established reduction of target gene degradation as shown by the strong nuclear expression of HIF-1α and HIF-2α in the +DOX groups (Figure 1, B and C). As expected, no signal was observed in podocytes.13 Occasionally, GN induced epithelial HIF-1α expression in the distal tubule and HIF-2α in single cells of the proximal tubule. In some mice strains, the transition of the parietal epithelial cells toward the proximal tubule occurs in the Bowman's capsule, therefore positive HIF-1α and HIF-2α signals within the early proximal tubule can be observed in the glomerulus.
Figure 1.
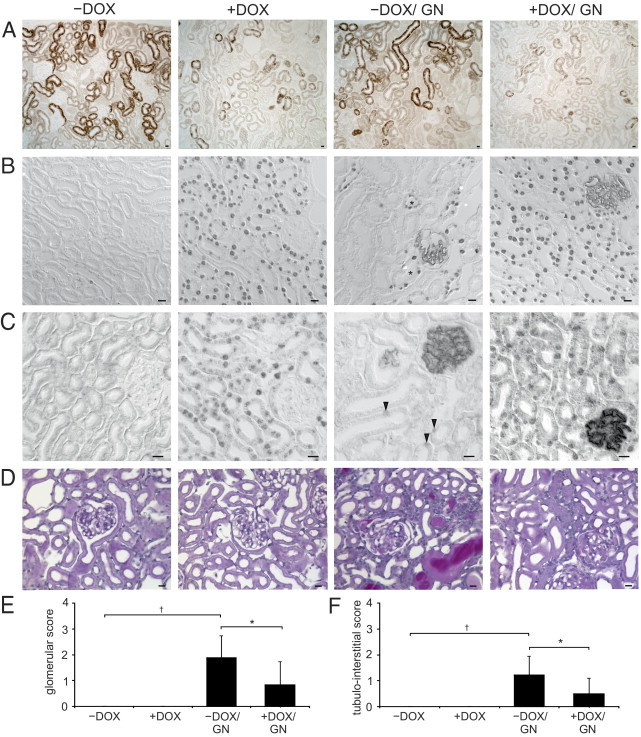
Induction of VHL knockout and anti-GBM GN. A: Immunohistochemical staining of VHL. The proximal tubule shows strong signals with predominance in the convoluted portion. Induction of the VHL knockout is depicted in +DOX and +DOX/GN showing a strong reduction in VHL abundance appearing with a mosaic pattern. B and C: Immunohistochemical staining of HIF-1α (B) and HIF-2α (C). Administration of doxycycline induced strong nuclear HIF-1α/HIF-2α accumulation in the tubular epithelial cells of +DOX and +DOX/GN. No signal was detectable in −DOX. On induction of GN (−DOX/GN), connecting tubule cells revealed HIF-1α (asterisks) and single proximal tubule cell HIF-2α (arrowheads) expression. D: PAS staining. In +DOX increased glomerular and peritubular formation of capillaries without structural alteration of the tubulointerstitium are shown. GN presents the typical features, however, less glomerular and tubulointerstitial injury were encountered in +DOX/GN compared with −DOX/GN. E and F: Glomerular damage score (E) and tubulointerstitial damage score (F). *P < 0.05 for −DOX versus +DOX; †P < 0.05 for control versus GN. Scale bars: 20 μm.
Morphologic analysis of glomeruli and the tubulointerstitium did not reveal signs of damage on induction of VHL knockout (Figure 1, D–F). Both −DOX/GN and +DOX/GN groups developed crescentic GN with tubulointerstitial disease after injection of the anti-GBM serum. The histopathologic changes were qualitatively identical in both groups but were quantitatively significantly less pronounced in +DOX/GN than in −DOX/GN. Glomeruli of the +DOX/GN displayed less hyaline deposits, sclerotic capillaries, tuft adhesions, and cellular crescent formation. Similarly, tubulointerstitial damage was less pronounced in +DOX/GN compared with −DOX/GN, showing fewer tubular dilations, cast formations, tubular atrophy, and degeneration.
Next, we correlated the damage scores of glomeruli and tubulointerstitium in −DOX/GN and +DOX/GN. A strict linear correlation (−DOX/GN, r = 0.897; +DOX/GN, r = 0.946; both P < 0.05) with similar correlation coefficients was found in the two groups that were compared.
Administration of doxycycline increased the blood hemoglobin concentration (−DOX: 14.7 ± 0.2 g/dL versus +DOX: 18.5 ± 1.3 g/dL; P < 0.05) and hematocrit (−DOX: 40.8% ± 1.7% versus +DOX: 47.3% ± 3.2%; P < 0.05) in +DOX groups compared with −DOX groups. Mice were bled once a week to avoid secondary effects of polycythemia as shown by the time-course of hemoglobin concentration (see Supplemental Table S1 at http://ajp.amjpathol.org). However, renal erythropoietin mRNA concentration was reduced significantly in both +DOX and +DOX/GN groups (Table 1). Therefore, we assume that Pax8-driven hepatic erythropoietin production could be responsible for the increased blood hemoglobin concentration and hematocrit. Furthermore, the results foster the idea of an exclusively interstitial source of renal erythropoietin mRNA production.
Table 1.
Abundance of EPO, VEGF, TGF-β1, and PDGF-B mRNAs
| −DOX | +DOX | −DOX/GN | +DOX/GN | |
|---|---|---|---|---|
| EPO | 1.00 ± 0.47 | 0.03 ± 0.02⁎ | 0.54 ± 0.33 | 0.01 ± 0.01⁎ |
| VEGF | 1.00 ± 0.09 | 2.17 ± 0.62⁎ | 1.44 ± 0.59 | 2.38 ± 0.46⁎ |
| TGF-β1 | 1.00 ± 0.34 | 1.52 ± 0.51 | 2.18 ± 0.65† | 1.89 ± 0.25 |
| PDGF-B | 1.00 ± 0.67 | 2.75 ± 0.98⁎ | 0.95 ± 0.25 | 2.35 ± 0.86⁎ |
Control levels −DOX are set as 1 = 100%. Means ± SD; n = 7.
P < 0.05 −DOX versus +DOX.
P < 0.05 control versus GN.
Induction of GN led to strongly increased plasma urea concentration and proteinuria in −DOX/GN and +DOX/GN. However, in agreement with the reduced glomerular and tubulointerstitial damage of +DOX/GN compared with −DOX/GN, plasma urea concentration and urinary protein excretion were less pronounced (Table 2). In addition, the time-course of plasma urea concentration showed a lower augmentation in +DOX/GN compared with −DOX/GN (see Supplemental Table S1 at http://ajp.amjpathol.org).
Table 2.
Clinical Parameters
| −DOX | +DOX | −DOX/GN | +DOX/GN | |
|---|---|---|---|---|
| P-urea (mg/dL) | 27.7 ± 4.8 | 21.8 ± 5.8 | 43.7 ± 10.9⁎ | 34.8 ± 4.1⁎† |
| U-protein (mg/24 hours) | 0.6 ± 0.5 | 0.9 ± 0.7 | 22.1 ± 15.3⁎ | 11.0 ± 8.1⁎† |
Values were determined on the last day of the experiment and are means ± SD; n = 7.
P-urea, plasma ureal; U-protein, urinary protein.
P < 0.05 control versus GN.
P < 0.05 −DOX versus +DOX.
The difference in disease progression may not be related to the humoral immune response to the injected rabbit anti-GBM serum because comparable amounts of mouse anti-rabbit IgG were produced in both GN groups (arbitrary units at OD 450: −DOX/GBM 0.48 ± 0.09 and +DOX/GBM 0.49 ± 0.12).
Analysis of Capillary Density and Endothelial Cell Proliferation
Morphologic analysis of both +DOX and +DOX/GN revealed an increase in capillary density. VEGF and PDGF-B are HIF target genes and are important regulators for vascular growth, therefore their mRNA concentration was assessed. Both +DOX and +DOX/GN showed a significant increase in VEGF mRNA and PDGF-B mRNA levels compared with −DOX and −DOX/GN (Table 1).
Then, renal VEGF protein abundance was determined by Western blot analysis and immunohistochemistry. In comparison with −DOX, immunohistochemical analysis of VEGF revealed in +DOX and +DOX/GN a strong augmented expression along the tubule, whereas the podocyte VEGF expression was decreased (Figure 2A). −DOX/GN showed a slight increase in tubular and glomerular VEGF expression levels in animals with low disease score and showed the tendency to be reduced in mice with higher glomerular and tubulointerstitial damage. Immunohistochemical data were confirmed by Western blot analysis (Figure 2B). Similarly, in comparison with −DOX, serum VEGF levels started to augment continuously by 1 week after administration of doxycycline and/or anti-GBM GN induction. The highest levels of circulating VEGF were observed in both +DOX groups (Figure 2C; see also Supplemental Table S1 at http://ajp.amjpathol.org).
Figure 2.

Renal VEGF expression. A: Immunohistochemistry of renal VEGF expression. Compared with −DOX, tubular VEGF abundance is increased and podocyte VEGF expression is reduced in +DOX and +DOX/GN. Induction of GN tended to decrease glomerular and tubular VEGF signal in −DOX/GN in advanced disease progression. Scale bars: 20 μm. B: Western blot analysis of VEGF and densitometric evaluation. C: Serum VEGF levels determined by enzyme-linked immunosorbent assay technique. *P < 0.05 for −DOX versus +DOX; †P < 0.05 for control versus GN.
Next, glomerular and tubulointerstitial endothelial cell proliferation were assessed. In comparison with −DOX, in which no glomerular endothelial cell proliferation was found, a strongly increased number of Ki-67–positive endothelial cells per glomeruli was detected in all three groups with the highest amount observed in +DOX and +DOX/GN (Figure 3, A and B). Similar results were obtained for the tubulointerstitial endothelial cell proliferation. In −DOX only minor tubulointerstitial endothelial cell proliferation was found. A strong increase in the number of Ki-67–positive endothelial cells per visual field were observed in all three groups, again with highest expression levels in +DOX and +DOX/GN (Figure 3, C and D).
Figure 3.
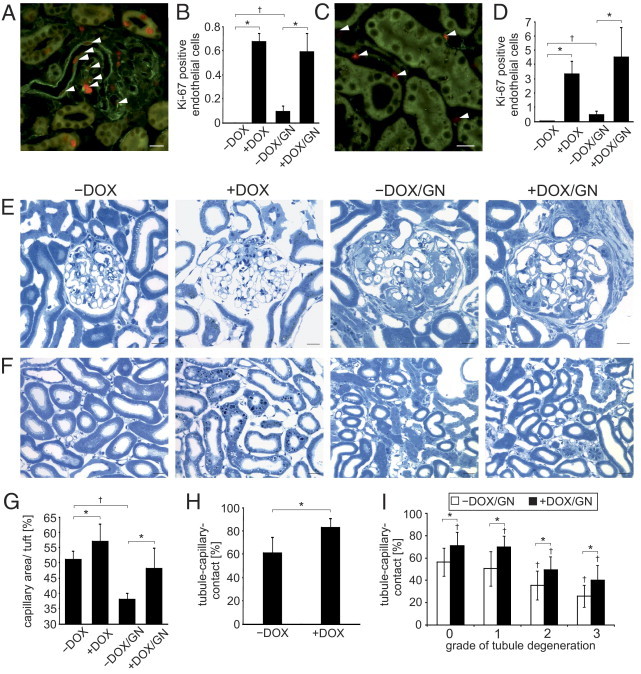
Endothelial cell proliferation and capillary growth. A–D: Assessment of proliferating endothelial cells. Double-labeling against Ki-67 (red) and caveolin (green) marks the proliferation of glomerular (A) and tubulointerstitial (C) endothelial cells (arrowheads). The respective numeric evaluations are shown in B and D. E and F: Comparative presentations of glomeruli (E) and tubulointerstitium (F) of semithin sections. An increased glomerular and tubulointerstitial capillary growth in +DOX compared with −DOX is shown and remains higher after the induction of GN. Note the increased interstitial spaces in +DOX groups compared with −DOX groups. Reduced glomerular and tubulointerstitial damage of +DOX/GN compared with −DOX/GN is encountered. G: Stereologic evaluation of glomerular capillary length. H: Stereologic evaluation of tubule-capillary contact area of +DOX compared with −DOX. I: Stereologic evaluation of tubule-capillary contact area of +DOX/GN compared with −DOX/GN according to the grade of tubule degeneration. *P < 0.05 for −DOX versus +DOX; †P < 0.05 for control versus GN. Scale bars: 20 μm.
We then assessed the glomerular capillary density and the tubular-capillary contact. Compared with −DOX, glomeruli of +DOX showed a significant augmented capillary density (Figure 3, E and G). Induction of GN strongly reduced the glomerular capillary density but remained higher in +DOX/GN compared with −DOX/GN. Similar to the glomeruli, the tubular-capillary contact area was higher in +DOX than in −DOX (Figure 3, F and H). To analyze whether the grade of the tubular degeneration affects the proportion of the tubular-capillary contact area, stereologic analysis was performed on all four grades of degeneration according to the established description.20 With increased tubular degeneration the fraction of the tubular-capillary contact area continuously decreased in both −DOX/GN and +DOX/GN, but remained constantly higher in +DOX/GN (Figure 3I).
Analysis of Interstitial Alterations
VHL knockout was proposed to induce interstitial matrix production. Therefore, the expression levels of TGF-β1, α-SMA, and type 1 collagen were determined. Compared with −DOX, TGF-β1 mRNA was increased significantly in all three groups with the highest mRNA expression level in +DOX and +DOX/GN (Table 1). TGF-β1 protein expression levels were increased significantly in all three groups compared with −DOX. However, the highest abundance was found in both GN groups (Figure 4A). In −DOX kidneys, immunohistochemical analysis showed only faint TGF-β1 expression in medullary collecting ducts; in +DOX kidneys additional interstitial expression was found (Figure 4D). Induction of GN strongly augmented TGF-β1 expression in tubular and interstitial cells. Immunohistochemical staining was confirmed by in situ hybridization of TGF-β1 mRNA showing the same expression pattern and changes in intensity levels (not shown). Similar variations in expression levels were obtained for α-SMA and type 1 collagen (Figure 4, B and C). Compared with −DOX, kidneys of +DOX showed increased interstitial α-SMA and type 1 collagen expression (Figure 4, F and G). Again, the strongest augmentation of both proteins was found after induction of GN in −DOX/GN and +DOX/GN.
Figure 4.

Induction of interstitial matrix production on administration of doxycycline and GN. A–C: Western blot and densitometric analysis of TGF-β1 (A), α-SMA (B), and type 1 collagen (C) expression. D–F: Immunohistochemistry of TGF-β1 (D), α-SMA (E), and type 1 collagen (F). Administration of doxycycline increased the interstitial expression of TGF-β1, α-SMA, and type 1 collagen. Induction of GN strongly augmented their production with no significant difference between −DOX/GN and +DOX/GN. *P < 0.05 for −DOX versus +DOX; †P < 0.05 for control versus GN. Scale bars: 20 μm.
The observed strong increase in α-SMA–positive interstitial cells suggests an increased formation of myofibroblasts. To analyze whether the latter could be owing to increased fibroblast/myofibroblast proliferation Ki-67 and 5′ectonucleotidase-positive cells were counted. Compared with the −DOX condition, a significant increase of proliferating fibroblast/myofibroblasts were observed in +DOX, −DOX/GN, and +DOX/GN (Figure 5, A and B).
Figure 5.

Interstitial cell proliferation. A: Numeric evaluation of proliferating interstitial cells. B: Representative double labeling of Ki-67 (red) and 5′ectonucleotidase (green) of +DOX. Arrowheads mark proliferating interstitial cells. Scale bar = 20 μm. *P < 0.05 for −DOX versus +DOX; †P < 0.05 for control versus GN.
Analysis of Tubular Epithelial Alterations
To analyze tubular epithelial alterations the renal expression of osteopontin, Ki-67, and HO-1 was determined. −DOX kidneys showed osteopontin expression only in medullary collecting ducts (Figure 6A), in +DOX kidneys an additional cortical distal tubular signal was found. However, strong osteopontin expression was observed along the nephron in −DOX/GN and less in +DOX/GN. Then, the epithelial proliferation index was determined by counting Ki-67–positive epithelial cells per visual field. Compared with −DOX, the number of Ki-67–positive epithelial cells strongly increased in +DOX and −DOX/GN and the highest proliferation rate was assessed in +DOX/GN (Figure 6B; respective values are as follows: −DOX 1.0 ± 0.2 g/dL; +DOX 3.5 ± 1.3 g/dL, P < 0.05; −DOX/GN 3.9 ± 1.9, P < 0.05; +DOX/GN 12.2 ± 1.7, P < 0.05).
Figure 6.

Expression of tubular damage marker. A:In situ hybridization of osteopontin mRNA expression. In −DOX kidneys no cortical osteopontin mRNA is observed. Administration of doxycycline induced a faint expression in the distal tubule. On GN induction, strong proximal and distal tubular osteopontin expression is found in −DOX/GN and +DOX/GN with less abundance in +DOX/GN. B: Representative immunohistochemical images of Ki-67–positive epithelial cells. Compared to −DOX, administration of doxycyclin and induction of GN increased the number in proliferating epithelial cells with highest amount in +DOX/GN. Scale bars: 20 μm.
HO-1 expression could not be determined in −DOX kidneys. Administration of doxycycline and GN, however, induced its expression in all tubular epithelial cells, with the highest expression levels found in +DOX and +DOX/GN (Figure 7, A and B).
Figure 7.
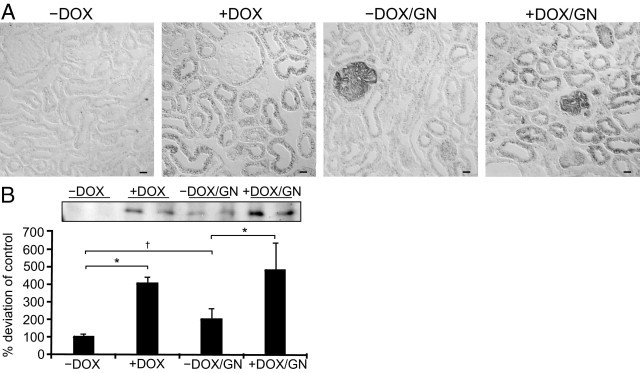
Expression of HO-1. Immunohistochemistry (A) and Western blot analysis (B) with densitometric evaluation of HO-1. Compared with −DOX, in which no signal was detectable, administration of doxycycline and induction of GN strongly increased HO-1 expression level with the highest abundance in +DOX/GN. Scale bars: 20 μm. *P < 0.05 for −DOX versus +DOX; †P < 0.05 for control versus GN.
Discussion
VHL knockout was associated with increased renal tubular stability of the transcription factors HIF-1α and HIF-2α. Renal epithelial expression of HIF-1α is well documented, whereas HIF-2α was found mainly in renal interstitial fibroblasts and endothelial cells.21 However, greater nuclear HIF-1α and HIF-2α stabilization was observed in the pathogenesis of VHL disease with constitutive epithelial expression of both HIF-1α and HIF-2α,22 confirming the potential of epithelial cells to generate HIF-2α.
VEGF, a target common to both HIF-1α and HIF-2α,23 was strongly produced in renal tubules of +DOX and +DOX/GN, leading to a concomitant fourfold increase in plasma VEGF concentration. As shown in a recent study by Hakroush et al,19 renal VEGF production is indeed capable in increasing systemic VEGF serum levels, initiating a feedback-mediated decrease in VEGF production by podocytes, which is similar to what we encountered in +DOX and +DOX/GN. Augmented VEGF levels were reported to induce glomerular changes19, 24, 25; however, glomerular morphology strongly differed between transgenic mice models overexpressing VEGF, which most likely is owing to the varying concentrations of VEGF. Serum VEGF levels increase as a consequence of renal epithelial VHL knockout, leading to glomerular endothelial proliferation associated with capillary growth.26, 27 Surprisingly, GN induced continuously higher serum VEGF levels over time, albeit with unchanged or diminished expression in the kidney at the end of the animal experiment. A possible explanation could be the time-course of renal VEGF expression/secretion, which was shown to be increased at the beginning of acute GN and decreased with ongoing disease progression.28, 29
In VHL knockout mice, the magnitude of GN was reduced and glomerular morphologic alterations were ameliorated, leading to significantly reduced proteinuria and plasma urea concentration. VEGF-induced reduction in glomerular hydrostatic pressure by arteriolar vasodilation30 and/or increased glomerular surface area available for filtration affecting the filtration coefficient may be responsible. Brenner and colleagues31 were able to show that chronic moderate anemia, known to induce epithelial HIF-1α expression,32 prevented the development of glomerular hypertension and retarded the progression of structural injury in the deoxycorticosterone acetate-salt model of progressive renal disease. A protective effect of VEGF administration also was observed in the remnant kidney model33 with increased glomerular capillary density associated with preservation of the glomerular filtration rate. In addition, increased circulating VEGF also may account for the disease amelioration by mediating endothelial cell maintenance and survival.34
Progressive interstitial fibrosis is associated with the loss of peritubular capillaries,35 which would be expected to result in chronic ischemia and hypoxia, which, in turn, was assumed to induce endothelial cell apoptosis and therefore to further stimulate the scarring process.7 In our model, the high VEGF levels induced a strong proliferation of peritubular endothelial cells, showing the capacity to respond to hypoxia similarly as endothelial cells elsewhere. Increased formation of capillaries in both +DOX groups led to an augmented fraction of tubular epithelial cells being surrounded by capillaries. The fraction of the tubule-capillary contact area was always significantly higher in +DOX/GN compared with −DOX/GN. However, both tended to analogously decrease with the grade of tubule degeneration despite maximal HIF-α stabilization, VEGF generation, and angiogenesis in +DOX/GN. Moreover, the correlation of the glomerular with the tubulointerstitial damage of −DOX/GN and +DOX/GN resulted in very similar correlation coefficients. This shows that VHL knockout with presumably improved oxygen supply does not prevent or ameliorate tubular degeneration in this mouse model of GN. We share the concept that the normal tubular epithelium secretes angiogenetic factors for proper oxygen supply, but when degenerating the secretion is diminished and capillaries disappear secondarily.36
Profibrotic properties of HIF have been described,9 leading to the hypothesis that hypoxia is not only a result of but also a cause for fibrosis, leading to a vicious circle. VEGF, as a HIF-target gene, was shown to induce TGF-β1 production and secretion in vitro.37 Recently, transgenic mice overexpressing VEGF in renal epithelia19 stimulated endothelial cells to produce TGF-β1 and PDGF-B, both cytokines are known to induce the conversion of fibroblasts into myofibroblasts.38, 39 In our study, VHL knockout induced mild endothelial TGF-β1 and PDGF-B production and enhanced expression of myofibroblasts, as revealed by α-SMA–positive interstitial staining associated with increased type 1 collagen synthesis. These results are in agreement with the reduced fibrotic effect in HIF-1α knockout mice after ureteral ligation.9 However, in +DOX, renal tubules remained unaffected by the increased interstitial matrix production and renal function persisted at control level during the experiment. Induction of GN induced a strong increase in TGF-β1 and interstitial matrix production assuming that other stronger stimuli than hypoxia may account for the massive fibroblast conversion and collagen production in GN.
For analysis of tubular affections the expression of the adhesion molecule osteopontin and the epithelial proliferation index were determined. Both were associated with tubular damage and fibrosis. The strongest osteopontin expression levels were found after induction of GN, with the highest expression in −DOX/GN and to a lesser extent in +DOX/GN. This expression pattern showed similar characteristics to the morphologic alterations in both disease groups. Osteopontin induced TGF-β1 production and fibrosis,40 which is in line with the reduced tubulointerstitial damage score, TGF-β1, α-SMA, and type 1 collagen expression in +DOX/GN compared with −DOX/GN. An increased number of proliferating tubular cells were observed on VHL knockout and anti-GBM GN, most likely through different mechanisms, as shown by the additive effect obtained in +DOX/GN. Recent publications have indicated that limiting cell proliferation could reduce fibrosis development.41 Furthermore, cell proliferation was shown to be associated with a less-differentiated state, and therefore proliferating cells might be more prone to deposit matrix proteins. On the contrary, HO-1, an HIF target gene and redox-sensitive protein, provides protection from disease. HO-1 is the rate-limiting enzyme involved in the degradation of heme and is known to have cytoprotective effects6 by the anti-inflammatory, anti-apoptotic, and antiproliferative actions of its end by-products.42 The role of HO-1 in renal fibrosis was clarified by Kie et al,43 showing that HO-1 knockout mice had significantly greater tubular TGF-β1 expression, inflammation, and fibrosis after unilateral ureteral obstruction. In our experimental outline HO-1 was expressed most abundantly in all tubular epithelial cells of both +DOX and +DOX/GN groups compared with a moderate expression pattern in −DOX/GN. These results show that induction of HIF-α may have damaging and protective impacts on the tubulointerstitium; however, net effects seem to be counterbalanced, as established in our experiment showing the same correlation coefficient between glomerular and tubulointerstitial damage scores.
In conclusion, we can confirm that stabilization of HIFs through VHL knockout has renoprotective effects by ameliorating glomerular disease progression in the anti-GBM GN mouse model, most probably mediated by increased circulating VEGF and associated angiogenesis. However, related to the tubulointerstitium, VHL knockout–induced effects were balanced within the anti-GBM GN; therefore, neither beneficial nor destructive properties were encountered. Hypoxia with concomitant HIF stabilization thus may be only a mild stimulus for the renal disease progression, and other factors need to be identified for the strong progression observed in anti-GBM GN. In addition, increased tubulointerstitial capillary formation did not halt disease progression. We hypothesize that as long as the tubule functions properly, angiogenetic factors are secreted, establishing the desired oxygen supply. Rarefaction of interstitial capillaries may be secondary to tubule degeneration.
Acknowledgments
We thank Christian Rosenberger for assistance in HIF-1α and HIF-2α immunohistochemistry and Anja Dietrich for technical assistance.
Footnotes
Supported by the Deutsche Forschungsgemeinschaft (FOR 667 to F.T. and S.B.).
Supplemental material for this article can be found at http://ajp.amjpathol.org or at doi:10.1016/j.ajpath.2011.07.012
Supplementary data
Abundance of VHL. Western blot analysis with densitometric evaluation of VHL revealed in comparison with −DOX and −DOX/GN a strong reduction in VHL abundance in +DOX and +DOX/GN. *P < 0.05 for −DOX versus +DOX.
References
- 1.Kang D.H., Joly A.H., Oh S.W., Hugo C., Kerjaschki D., Gordon K.L., Mazzali M., Jefferson J.A., Hughes J., Madsen K.M., Schreiner G.F., Johnson R.J. Impaired angiogenesis in the remnant kidney model: i: Potential role of vascular endothelial growth factor and thrombospondin-1. J Am Soc Nephrol. 2001;12:1434–1447. doi: 10.1681/ASN.V1271434. [DOI] [PubMed] [Google Scholar]
- 2.Kriz W., LeHir M. Pathways to nephron loss starting from glomerular diseases-insights from animal models. Kidney Int. 2005;67:404–419. doi: 10.1111/j.1523-1755.2005.67097.x. [DOI] [PubMed] [Google Scholar]
- 3.Nangaku M. Chronic hypoxia and tubulointerstitial injury: a final common pathway to end-stage renal failure. J Am Soc Nephrol. 2006;17:17–25. doi: 10.1681/ASN.2005070757. [DOI] [PubMed] [Google Scholar]
- 4.Eckardt K.U., Bernhardt W.M., Weidemann A., Warnecke C., Rosenberger C., Wiesener M.S., Willam C. Role of hypoxia in the pathogenesis of renal disease. Kidney Int Suppl. 2005;99:S46–S51. doi: 10.1111/j.1523-1755.2005.09909.x. [DOI] [PubMed] [Google Scholar]
- 5.Fine L.G., Orphanides C., Norman J.T. Progressive renal disease: the chronic hypoxia hypothesis. Kidney Int Suppl. 1998;65:S74–S78. [PubMed] [Google Scholar]
- 6.Heyman S.N., Khamaisi M., Rosen S., Rosenberger C. Renal parenchymal hypoxia, hypoxia response and the progression of chronic kidney disease. Am J Nephrol. 2008;28:998–1006. doi: 10.1159/000146075. [DOI] [PubMed] [Google Scholar]
- 7.Fine L.G., Norman J.T. Chronic hypoxia as a mechanism of progression of chronic kidney diseases: from hypothesis to novel therapeutics. Kidney Int. 2008;74:867–872. doi: 10.1038/ki.2008.350. [DOI] [PubMed] [Google Scholar]
- 8.Semenza G.L. Intratumoral hypoxia, radiation resistance, and HIF-1. Cancer Cell. 2004;5:405–406. doi: 10.1016/s1535-6108(04)00118-7. [DOI] [PubMed] [Google Scholar]
- 9.Higgins D.F., Kimura K., Bernhardt W.M., Shrimanker N., Akai Y., Hohenstein B., Saito Y., Johnson R.S., Kretzler M., Cohen C.D., Eckardt K.U., Iwano M., Haase V.H. Hypoxia promotes fibrogenesis in vivo via HIF-1 stimulation of epithelial-to-mesenchymal transition. J Clin Invest. 2007;117:3810–3820. doi: 10.1172/JCI30487. [DOI] [PMC free article] [PubMed] [Google Scholar]
- 10.Tanaka T., Kojima I., Ohse T., Ingelfinger J.R., Adler S., Fujita T., Nangaku M. Cobalt promotes angiogenesis via hypoxia-inducible factor and protects tubulointerstitium in the remnant kidney model. Lab Invest. 2005;85:1292–1307. doi: 10.1038/labinvest.3700328. [DOI] [PubMed] [Google Scholar]
- 11.Tanaka T., Matsumoto M., Inagi R., Miyata T., Kojima I., Ohse T., Fujita T., Nangaku M. Induction of protective genes by cobalt ameliorates tubulointerstitial injury in the progressive Thy1 nephritis. Kidney Int. 2005;68:2714–2725. doi: 10.1111/j.1523-1755.2005.00742.x. [DOI] [PubMed] [Google Scholar]
- 12.Ohtomo S., Nangaku M., Izuhara Y., Takizawa S., Strihou C.Y., Miyata T. Cobalt ameliorates renal injury in an obese, hypertensive type 2 diabetes rat model. Nephrol Dial Transplant. 2008;23:1166–1172. doi: 10.1093/ndt/gfm715. [DOI] [PubMed] [Google Scholar]
- 13.Traykova-Brauch M., Schonig K., Greiner O., Miloud T., Jauch A., Bode M., Felsher D.W., Glick A.B., Kwiatkowski D.J., Bujard H., Horst J., von Knebel Doeberitz M., Niggli F.K., Kriz W., Grone H.J., Koesters R. An efficient and versatile system for acute and chronic modulation of renal tubular function in transgenic mice. Nat Med. 2008;14:979–984. doi: 10.1038/nm.1865. [DOI] [PMC free article] [PubMed] [Google Scholar]
- 14.Schonig K., Schwenk F., Rajewsky K., Bujard H. Stringent doxycycline dependent control of CRE recombinase in vivo. Nucleic Acids Res. 2002;30:e134. doi: 10.1093/nar/gnf134. [DOI] [PMC free article] [PubMed] [Google Scholar]
- 15.Haase V.H., Glickman J.N., Socolovsky M., Jaenisch R. Vascular tumors in livers with targeted inactivation of the von Hippel-Lindau tumor suppressor. Proc Natl Acad Sci U S A. 2001;98:1583–1588. doi: 10.1073/pnas.98.4.1583. [DOI] [PMC free article] [PubMed] [Google Scholar]
- 16.Theilig F., Kriz W., Jerichow T., Schrade P., Hahnel B., Willnow T., Le Hir M., Bachmann S. Abrogation of protein uptake through megalin-deficient proximal tubules does not safeguard against tubulointerstitial injury. J Am Soc Nephrol. 2007;18:1824–1834. doi: 10.1681/ASN.2006111266. [DOI] [PubMed] [Google Scholar]
- 17.Theilig F., Bostanjoglo M., Pavenstadt H., Grupp C., Holland G., Slosarek I., Gressner A.M., Russwurm M., Koesling D., Bachmann S. Cellular distribution and function of soluble guanylyl cyclase in rat kidney and liver. J Am Soc Nephrol. 2001;12:2209–2220. doi: 10.1681/ASN.V12112209. [DOI] [PubMed] [Google Scholar]
- 18.Ma L.J., Nakamura S., Whitsitt J.S., Marcantoni C., Davidson J.M., Fogo A.B. Regression of sclerosis in aging by an angiotensin inhibition-induced decrease in PAI-1. Kidney Int. 2000;58:2425–2436. doi: 10.1046/j.1523-1755.2000.00426.x. [DOI] [PubMed] [Google Scholar]
- 19.Hakroush S., Moeller M.J., Theilig F., Kaissling B., Sijmonsma T.P., Jugold M., Akeson A.L., Traykova-Brauch M., Hosser H., Hahnel B., Grone H.J., Koesters R., Kriz W. Effects of increased renal tubular vascular endothelial growth factor (VEGF) on fibrosis, cyst formation, and glomerular disease. Am J Pathol. 2009;175:1883–1895. doi: 10.2353/ajpath.2009.080792. [DOI] [PMC free article] [PubMed] [Google Scholar]
- 20.Le Hir M., Besse-Eschmann V. A novel mechanism of nephron loss in a murine model of crescentic glomerulonephritis. Kidney Int. 2003;63:591–599. doi: 10.1046/j.1523-1755.2003.00782.x. [DOI] [PubMed] [Google Scholar]
- 21.Gunaratnam L., Bonventre J.V. HIF in kidney disease and development. J Am Soc Nephrol. 2009;20:1877–1887. doi: 10.1681/ASN.2008070804. [DOI] [PubMed] [Google Scholar]
- 22.Clifford S.C., Maher E.R. Von Hippel-Lindau disease: clinical and molecular perspectives. Adv Cancer Res. 2001;82:85–105. doi: 10.1016/s0065-230x(01)82003-0. [DOI] [PubMed] [Google Scholar]
- 23.Hu C.J., Wang L.Y., Chodosh L.A., Keith B., Simon M.C. Differential roles of hypoxia-inducible factor 1alpha (HIF-1alpha) and HIF-2alpha in hypoxic gene regulation. Mol Cell Biol. 2003;23:9361–9374. doi: 10.1128/MCB.23.24.9361-9374.2003. [DOI] [PMC free article] [PubMed] [Google Scholar]
- 24.Eremina V., Sood M., Haigh J., Nagy A., Lajoie G., Ferrara N., Gerber H.P., Kikkawa Y., Miner J.H., Quaggin S.E. Glomerular-specific alterations of VEGF-A expression lead to distinct congenital and acquired renal diseases. J Clin Invest. 2003;111:707–716. doi: 10.1172/JCI17423. [DOI] [PMC free article] [PubMed] [Google Scholar]
- 25.Liu E., Morimoto M., Kitajima S., Koike T., Yu Y., Shiiki H., Nagata M., Watanabe T., Fan J. Increased expression of vascular endothelial growth factor in kidney leads to progressive impairment of glomerular functions. J Am Soc Nephrol. 2007;18:2094–2104. doi: 10.1681/ASN.2006010075. [DOI] [PubMed] [Google Scholar]
- 26.Semenza G.L. Regulation of vascularization by hypoxia-inducible factor 1. Ann N Y Acad Sci. 2009;1177:2–8. doi: 10.1111/j.1749-6632.2009.05032.x. [DOI] [PubMed] [Google Scholar]
- 27.Germain S., Monnot C., Muller L., Eichmann A. Hypoxia-driven angiogenesis: role of tip cells and extracellular matrix scaffolding. Curr Opin Hematol. 2010;17:245–251. doi: 10.1097/MOH.0b013e32833865b9. [DOI] [PubMed] [Google Scholar]
- 28.Horita Y., Miyazaki M., Koji T., Kobayashi N., Shibuya M., Razzaque M.S., Cheng M., Ozono Y., Kohno S., Taguchi T. Expression of vascular endothelial growth factor and its receptors in rats with protein-overload nephrosis. Nephrol Dial Transplant. 1998;13:2519–2528. doi: 10.1093/ndt/13.10.2519. [DOI] [PubMed] [Google Scholar]
- 29.Haas C.S., Campean V., Kuhlmann A., Dimmler A., Reulbach U., Forster C., Aigner T., Acker T., Plate K., Amann K. Analysis of glomerular VEGF mRNA and protein expression in murine mesangioproliferative glomerulonephritis. Virchows Arch. 2007;450:81–92. doi: 10.1007/s00428-006-0340-0. [DOI] [PubMed] [Google Scholar]
- 30.Klanke B., Simon M., Rockl W., Weich H.A., Stolte H., Grone H.J. Effects of vascular endothelial growth factor (VEGF)/vascular permeability factor (VPF) on haemodynamics and permselectivity of the isolated perfused rat kidney. Nephrol Dial Transplant. 1998;13:875–885. doi: 10.1093/ndt/13.4.875. [DOI] [PubMed] [Google Scholar]
- 31.Lafferty H.M., Garcia D.L., Rennke H.G., Troy J.L., Anderson S., Brenner B.M. Anemia ameliorates progressive renal injury in experimental DOCA-salt hypertension. J Am Soc Nephrol. 1991;1:1180–1185. doi: 10.1681/ASN.V1101180. [DOI] [PubMed] [Google Scholar]
- 32.Rosenberger C., Mandriota S., Jurgensen J.S., Wiesener M.S., Horstrup J.H., Frei U., Ratcliffe P.J., Maxwell P.H., Bachmann S., Eckardt K.U. Expression of hypoxia-inducible factor-1alpha and -2alpha in hypoxic and ischemic rat kidneys. J Am Soc Nephrol. 2002;13:1721–1732. doi: 10.1097/01.asn.0000017223.49823.2a. [DOI] [PubMed] [Google Scholar]
- 33.Kang D.H., Hughes J., Mazzali M., Schreiner G.F., Johnson R.J. Impaired angiogenesis in the remnant kidney model: II: Vascular endothelial growth factor administration reduces renal fibrosis and stabilizes renal function. J Am Soc Nephrol. 2001;12:1448–1457. doi: 10.1681/ASN.V1271448. [DOI] [PubMed] [Google Scholar]
- 34.Sison K., Eremina V., Baelde H., Min W., Hirashima M., Fantus I.G., Quaggin S.E. Glomerular structure and function require paracrine, not autocrine, VEGF-VEGFR-2 Signaling. J Am Soc Nephrol. 2010;21:1691–1701. doi: 10.1681/ASN.2010030295. [DOI] [PMC free article] [PubMed] [Google Scholar]
- 35.Bohle A., Mackensen-Haen S., Wehrmann M. Significance of postglomerular capillaries in the pathogenesis of chronic renal failure. Kidney Blood Press Res. 1996;19:191–195. doi: 10.1159/000174072. [DOI] [PubMed] [Google Scholar]
- 36.Humphreys B.D., Lin S.L., Kobayashi A., Hudson T.E., Nowlin B.T., Bonventre J.V., Valerius M.T., McMahon A.P., Duffield J.S. Fate tracing reveals the pericyte and not epithelial origin of myofibroblasts in kidney fibrosis. Am J Pathol. 2010;176:85–97. doi: 10.2353/ajpath.2010.090517. [DOI] [PMC free article] [PubMed] [Google Scholar]
- 37.Li Z.D., Bork J.P., Krueger B., Patsenker E., Schulze-Krebs A., Hahn E.G., Schuppan D. VEGF induces proliferation, migration, and TGF-beta1 expression in mouse glomerular endothelial cells via mitogen-activated protein kinase and phosphatidylinositol 3-kinase. Biochem Biophys Res Commun. 2005;334:1049–1060. doi: 10.1016/j.bbrc.2005.07.005. [DOI] [PubMed] [Google Scholar]
- 38.Hinz B. Formation and function of the myofibroblast during tissue repair. J Invest Dermatol. 2007;127:526–537. doi: 10.1038/sj.jid.5700613. [DOI] [PubMed] [Google Scholar]
- 39.Floege J., Eitner F., Alpers C.E. A new look at platelet-derived growth factor in renal disease. J Am Soc Nephrol. 2008;19:12–23. doi: 10.1681/ASN.2007050532. [DOI] [PubMed] [Google Scholar]
- 40.Nicholas S.B., Liu J., Kim J., Ren Y., Collins A.R., Nguyen L., Hsueh W.A. Critical role for osteopontin in diabetic nephropathy. Kidney Int. 2010;77:588–600. doi: 10.1038/ki.2009.518. [DOI] [PubMed] [Google Scholar]
- 41.Yang L., Besschetnova T.Y., Brooks C.R., Shah J.V., Bonventre J.V. Epithelial cell cycle arrest in G2/M mediates kidney fibrosis after injury. Nat Med. 2010;16:535–543. doi: 10.1038/nm.2144. [DOI] [PMC free article] [PubMed] [Google Scholar]
- 42.Kirkby K.A., Adin C.A. Products of heme oxygenase and their potential therapeutic applications. Am J Physiol Renal Physiol. 2006;290:F563–F571. doi: 10.1152/ajprenal.00220.2005. [DOI] [PubMed] [Google Scholar]
- 43.Kie J.H., Kapturczak M.H., Traylor A., Agarwal A., Hill-Kapturczak N. Heme oxygenase-1 deficiency promotes epithelial-mesenchymal transition and renal fibrosis. J Am Soc Nephrol. 2008;19:1681–1691. doi: 10.1681/ASN.2007101099. [DOI] [PMC free article] [PubMed] [Google Scholar]
Associated Data
This section collects any data citations, data availability statements, or supplementary materials included in this article.
Supplementary Materials
Abundance of VHL. Western blot analysis with densitometric evaluation of VHL revealed in comparison with −DOX and −DOX/GN a strong reduction in VHL abundance in +DOX and +DOX/GN. *P < 0.05 for −DOX versus +DOX.