

Abstract
ABCB6 is a mitochondrial transporter that regulates porphyrin biosynthesis. ABCB6 expression is upregulated in hepatocellular carcinoma (HCC) but the significance of this upregulation to HCC is not known. In the present study, we investigated: 1) ABCB6 expression in 18 resected human hepatocellular carcinoma (HCC) tissues and 3 human hepatoma cell lines; 2) pattern of ABCB6 expression during liver disease progression; and 3) functional significance of ABCB6 expression to HCC using the hepatoma cell line Huh7. ABCB6 expression was determined by real‐time quantitative reverse transcription‐polymerase chain reaction and western blotting. ABCB6 expression was upregulated in all the HCC specimens and the three‐hepatoma cell lines. Increased ABCB6 expression correlated with liver disease progression with the pattern of expression being HCC > cirrhosis > steatosis. Small hairpin RNA (shRNA)‐mediated knockdown of ABCB6 in Huh7 cells lead to decreased cellular proliferation and colony formation. Attenuation of ABCB6 expression did not affect Huh7 apoptosis but lead to a delay in G2/M phase of the cell cycle. In contrast, ABCB6 overexpression resulted in increased growth and proliferation of Huh7 cells. Since ABCB6 expression is induced in multiple tumor types we explored the role of ABCB6 in other cancer cells. ShRNA mediated knockdown of ABCB6 in HEK293 and K562 cells reduced cellular proliferation leading to a delay in G2/M phase, while ABCB6 overexpression promoted cell growth and proliferation. Collectively, these findings, obtained by loss of function and gain of function analysis, suggest that ABCB6 plays a role in cell growth and proliferation by targeting the cell cycle.
Keywords: ABC transporters, Carcinoma, Hepatocellular carcinoma, Growth and proliferation
Highlights
ABCB6 expression is induced in human hepatocellular carcinoma.
ABCB6 expression is induced with liver disease progression (HCC > cirrhosis > steatosis).
ABCB6 expression promotes growth and proliferation.
Knockdown of ABCB6 results in G2/M phase arrest.
Abbreviations
- ABCB6
ATP binding cassette transporter B6
- HCC
Hepatocellular carcinoma
- PPIX
protoporphyrin IX
- SA
succinylacetone
- FACS
Fluorescent activated cell sorting
1. Introduction
ATP binding cassette (ABC) transporter family of proteins play important role in cell physiology and in the therapeutic response to medications (Dean and Annilo, 2005; Zutz et al., 2009). ABCB6, a member of this transporter superfamily localizes to the mitochondria and regulates porphyrin biosynthesis (Krishnamurthy et al., 2006). ABCB6 was initially identified while screening for novel drug resistant genes in the liver (Furuya et al., 1997). Interestingly it was later discovered that ABCB6 transcript is significantly increased in human hepatocellular carcinoma and in the rat model of hepatocarcinogenesis (Emadi‐Konjin et al., 2002; Furuya et al., 1997). However, the significance of this increased ABCB6 expression to carcinogenesis is not clearly understood.
Hepatocellular carcinoma is a global health problem being the fifth most common cancer worldwide with an estimated incidence of a million cases per year (Bosch et al., 2005; Bruix et al., 2004; Llovet et al., 2003; Parkin et al., 2005). HCC has received considerable attention in recent years because of its rapidly increasing incidence (Parkin et al., 2005; Pons‐Renedo and Llovet, 2003). Patients diagnosed with HCC have a poor prognosis because of the aggressive features of the disease. Surgical resection, ablation therapy, and liver transplantation are effective but only at an early stage of HCC development (Mulcahy, 2005).
Although the causative links of etiologic factors, including chronic hepatitis infections (Anzola, 2004), chronic alcohol consumption (Sanyal et al., 2010; Takuma and Nouso, 2010) and dietary aflotoxin‐B1 (Chen et al., 1996) have been firmly established in the development of HCC, the molecular pathways by which HCC develops and progresses remain largely elusive. (Feitelson et al., 2002; Laurent‐Puig et al., 2001; Marotta et al., 2004; Sun et al., 2007; Thorgeirsson and Grisham, 2002; Thorgeirsson et al., 2006). The current understanding of carcinogenesis mechanisms suggests that development and progression of HCC is caused by accumulated genetic changes that influence the survival of cancer cells by promoting cell growth and proliferation or suppressing apoptosis and regulating cell cycle (Imbeaud et al., 2010; Severi et al., 2010; Whittaker et al., 2010). Further, results from these studies suggest that the molecular basis of the malignant phenotype in HCC is highly heterogeneous, and it is thought that several of the proteins that play a role in the progression of this disease remain to be identified.
In studies presented in this manuscript, we demonstrate that ABCB6 expression directly correlates with liver disease progression and that ABCB6 expression regulates cell growth, proliferation and tumorigenicity in human hepatoma, human embryonic kidney and human erythroleukemia cells. More importantly, we show that ABCB6 expression regulates cell cycle with loss of ABCB6 expression resulting in G2/M phase arrest.
2. Materials and methods
2.1. Chemicals, cell culture, transfection and transduction
We used three human hepatoma cell lines, one human kidney cell line and one human leukemia cell line. The human hepatoma cell lines were Huh7, HepG2 and Hep3B. The human kidney cell line was HEK293 and the human leukemia cell line was K562. All cell lines were obtained from the American Type Culture Collection (ATCC, Manassas, VA). Huh7, HepG2, Hep3B and K562 cells were cultured in modified eagle's medium supplemented with 10% fetal bovine serum (FBS) and 100 units/ml penicillin/streptomycin. HEK293 cells were cultured in eagle's minimum essential medium supplemented with 10% FBS and 100 units/ml penicillin/streptomycin. All cells were cultured at 37 °C in 5% CO2.
ABCB6‐shRNA and control shRNA viral particles were obtained from Sigma–Aldrich Corporation (St.louis, MO). Stable cell lines harboring either ABCB6‐shRNA or the control shRNA were generated by transduction of viral particles following the manufacturer's protocol, followed by selection in puromycin (0.6 μg/ml for HEK293 cells and 2.5 μg/ml for Huh7 and K562 cells). Knockdown of ABCB6 expression was confirmed by RT‐PCR and western blot analysis of ABCB6 protein.
ABCB6 overexpressing cells were engineered to overexpress a flag tagged ABCB6 as described (Krishnamurthy et al., 2006). ABCB6 overexpressing cells were cultured in Dulbecco's modified eagle's medium supplemented with 10% FBS, 100 units/ml penicillin, 2 mM l‐glutamine, and 500 μg/ml geneticin (G418) or 0.6–2.5 μg/ml puromycin. All chemicals were from Sigma–Aldrich Corporation unless otherwise stated.
2.2. Real‐time PCR and western analysis
Real time PCR was performed as previously described (Krishnamurthy et al., 2006) using primer sets specific for the human ABCB6 or mouse Abcb6 gene and human or mouse Actin gene. For western analysis, cell lysates were prepared as described previously (Krishnamurthy et al., 2006), and 100 μg of total protein or mitochondrial protein was analyzed by polyacrylamide gel electrophoresis (PAGE) followed by transfer to polyvinylidene difluoride membranes (PVDF; BioRad, Hercules, CA). Blots were probed with mono and/or polyclonal anti‐ABCB6 antibody, monoclonal anti‐actin (Sigma, St.louis, MO), mono and/or polyclonal anti‐flag (Sigma, St.Louis, MO) and monoclonal anti‐porin (Mitosciences, Eugene, OR) antibodies. We detected the secondary antibody by using a chemiluminescence detection kit (Amersham Biosciences, Piscataway, NJ). ABCB6 antibodies were generated using a portion of the ABCB6 protein (aa 592‐894) that is predicted to localize to the cytosol and is unique among the Abc transporters. The antibody was affinity purified and characterized for its ability to recognize the native ABCB6 protein as described (Chavan et al., 2011). Fold increase and percent reduction in mRNA and protein expression were determined by densitometric analysis of respective bands using the NIH Image software (Abramoff et al., 2004).
2.3. Isolation of mitochondria
Mitochondria were isolated as described (Krishnamurthy et al., 2006). Briefly, cells were pelleted in 1× Hanks buffered saline solution (Life Technologies, Carlsbad, CA), resuspended in buffer A [10 mmol/L NaCl, 1.5 mM MgCl2, 10 mmol/L Tris (pH 7.4)] containing 1× protease inhibitor cocktail (Roche Applied Science, Indianapolis, IN), swollen on ice, and disrupted with a type B Dounce homogenizer. Buffer B [525 mmol/L mannitol, 175 mmol/L sucrose, 12.5 mmol/L Tris (pH7.4), and 2.5 mmol/L EDTA] was added at a ratio of 4:10 homogenate/buffer B. The supernatant was collected after centrifugation at 1500× g for 10 min. The supernatant was centrifuged at 17,000× g for 15 min to pellet mitochondria. Crude mitochondria were purified from the endoplasmic reticulum (ER) as previously described (Krishnamurthy et al., 2006; Lynch et al., 2009).
2.4. Cell growth assay
Cell growth was measured in logarithmically growing Huh7, HEK293 and K562 cells (5X10³ cells) stably expressing either the control shRNA, ABCB6‐shRNA, empty expression plasmid or ABCB6 overexpressing plasmid. Cells were plated in six well culture dishes at an initial density of 5×10³ cells/ml and cell viability was measured at 24, 48, 72, 96, and 120 h using TC‐10 automated cell counter (BioRad, Hercules, CA) or hemocytometer as described (Krishnamurthy et al., 2004). For Phase‐contrast micrographs cells were cultured for 3 days and photographed using an Olympus BX51 upright microscope equipped with DP‐71 imaging system (Olympus).
2.5. Cell proliferation assay
Cell proliferation was measured in logarithmically growing Huh7, HEK293 and K562 cells stably expressing either the control shRNA or ABCB6‐shRNA or the empty expression plasmid or the ABCB6 overexpressing plasmid. Cells were plated onto 96 well plates at a starting density of 104 cells and were allowed to grow for five days. Cell proliferation was determined at 24, 48, 72, 96 and 120 h by using the 3‐[4,5‐dimethylthiazol‐2‐yl]‐2,5‐diphenyl‐tetrazolium bromide assay. Absorbance at 570 nm was measured with a kinetic micro‐plate reader (BioTek, Winooski, Vermont) and was used as a measure of cell proliferation.
2.6. Colony or foci forming assay
Colony formation was measured as described (Lecureur et al., 2001). Briefly, Huh7 cells expressing either ABCB6 or control shRNA or cells overexpressing either ABCB6 expression plasmid or the vector control plasmid were seeded at 2–4×10⁴ cells per well in 6‐well culture plate. After 14 days incubation for overexpressing cells and 28 days incubation for shRNA knockdown cells, colonies were fixed in 70% ethanol and stained with crystal violet (0.5% in 1× phosphate buffered saline). Number of colonies was scored on an Artek Model 880 colony counter (Artek, Farmingdale, NY).
2.7. Cellular porphyrin measurement
Porphyrin concentration was measured as described (Krishnamurthy et al., 2004). Briefly, cells were spun down, resuspended into PBS and analyzed in a flow cytometer at 695/40‐nm filter after excitation by a 405 nm UV light.
2.8. Collection and characterization of patient samples
Liver specimens used in this study were derived from samples collected by KUMC Liver Center Tissue Bank. Three steatosis, five cirrhosis and twenty‐four HCC liver tissue samples were used in this study. Informed consent was obtained in writing from each patient and the protocol was approved by the institutional review committee.
2.9. Cell cycle analysis and cell synchronization
Fluorescence activated cell sorter (FACS) was used to perform cell cycle analysis. Cells stably expressing either the ABCB6‐shRNA or the control shRNA or ABCB6 overexpressing and vector control cells were synchronized for 36 h by serum starvation (1% FBS media). Following synchronization cells were returned to normal media containing 10% FBS and cultured for 36 h. For DNA content analysis, cells were harvested, resuspended in 0.5 ml of PBS and fixed in ice‐cold 70% ethanol at 4 °C for 2 h. Following rehydration in PBS, and RNase treatment (10 mg/ml) for 30 min cells were incubated in propidium iodide (10 μg/ml) for 10 min at 37 °C in the dark. Cell cycle analysis was carried out using a FACS analyzer with excitation wavelength of 488 nm and emission wavelength of 585 nm; percent cells in cell cycle were calculated using the FlowJo software (BD biosciences, Rockville, MD), according to manufacturer's instructions.
2.10. Statistical analysis
Statistical analysis of the observed values was performed using the student's t‐test and Bonferroni parametric tests (where appropriate). All calculations were performed with SPSS statistical software package (SPSS Inc., Chicago, IL). All values are expressed, as mean ± S.D. Significant differences between the groups were determined with SPSS 10.0 software (SPSS Inc., Chicago, IL). A difference was considered significant at the p < 0.05 level.
3. Results
3.1. ABCB6 expression is upregulated in hepatocellular carcinoma
To examine ABCB6 expression in human hepatocellular cancer, twelve paired HCC tissue samples and the corresponding adjacent non‐cancerous liver tissue mRNA was amplified using ABCB6 specific primers. Real time PCR analysis demonstrated increased ABCB6 mRNA expression in all the twelve HCC livers compared to non‐cancerous liver tissue [(P < 0.001); Figure 1A]. To test this further we evaluated both ABCB6 mRNA and protein expression in six human HCC specimens and non‐HCC livers, by semi‐quantitative RT‐PCR and by immunoblot analysis. The resulting data showed significant upregulation of ABCB6 mRNA (data not shown) and ABCB6 protein (Figure 1B top panel) in six of six HCC specimens as compared with the non‐cancerous liver (an average of ∼6 fold increase in actin normalized ABCB6 expression in HCC livers compared to non‐HCC livers; Figure 1B bottom panel). Taken together these results confirm previous observations and extend them demonstrating upregulation of ABCB6 in 18 of 18 HCC specimens (100%) examined.
Figure 1.
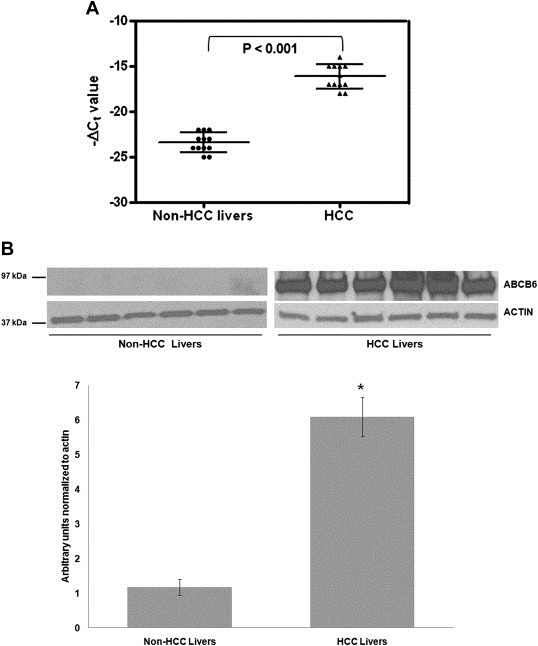
ABCB6 expression is upregulated in HCC. (A) Transcript level of ABCB6 was measured in 12 paired HCC specimens and corresponding adjacent non‐cancerous livers by quantitative RT‐PCR, where β‐actin was used as internal reference control. Each scatter plot displays the expression level of a given HCC specimen or adjacent liver (non‐HCC livers), where the lines represent the median with interquartile range of −ΔCt value; P value was calculated by Student's t test. (B) Top panel: relative levels of ABCB6 protein in six HCC specimens and six non‐HCC liver. Each protein band represents an individual patient sample. ABCB6 expression was measured in total lysate using ABCB6 specific antibody. Bottom panel: image J analysis of average ABCB6 protein expression in HCC and non‐HCC livers normalized to internal reference control β‐actin. ‘*’ Significantly different from non‐HCC livers: p < 0.05.
3.2. ABCB6 expression increases with progression of liver disease
As with most cancers, hepatocarcinogenesis is a process attributed to progressive genomic changes that alter the hepatocellular phenotype producing cellular intermediates that evolve into HCC (Aravalli et al., 2008; Severi et al., 2010). The multistage process of tumor development in HCC that alter the hepatocellular phenotype includes steatosis, steatohepatitis and cirrhosis (Schutte et al., 2009; Takuma and Nouso, 2010). Therefore, we next sought to understand the pattern of ABCB6 expression during liver disease progression. Liver biopsy samples were obtained from patients demonstrating steatosis, cirrhosis or HCC as described in methods. ABCB6 expression in these patient samples was evaluated by semi‐quantitative RT‐PCR and by immunoblot analysis and was compared to non‐diseased liver tissue (referred to as normal). The results demonstrate progressive increase in ABCB6 mRNA expression (Figure 2A left panel) with an average increase of (actin normalized ABCB6 expression) approximately 2.5, 4 and 5 times in steatosis, cirrhosis and HCC liver tissue respectively compared to normal liver tissue which was 1.0 (Figure 2A right panel). As with the ABCB6 transcript ABCB6 protein expression was also induced with the progression of liver disease (Figure 2B top panel), with an average increase of (actin normalized ABCB6 expression of the combined samples in each disease state) approximately 0.3, 1.2 and 3.5 times in steatosis, cirrhosis and HCC liver tissue respectively compared to normal liver which was 0.03 (Figure 2B bottom panel). Since ABCB6 is a porphyrin transporter, we next evaluated the specificity of ABCB6 expression during liver disease progression in relation to the other known ATP binding cassette porphyrin transporter ABCG2. As previously reported [33] ABCG2 expression was upregulated in HCC but no change in ABCG2 expression was seen during liver disease progression (data not shown). Together these data demonstrate significant increase in ABCB6 expression during liver disease progression with the pattern of expression being as follows HCC > Cirrhosis > Steatosis > non‐diseased tissue.
Figure 2.
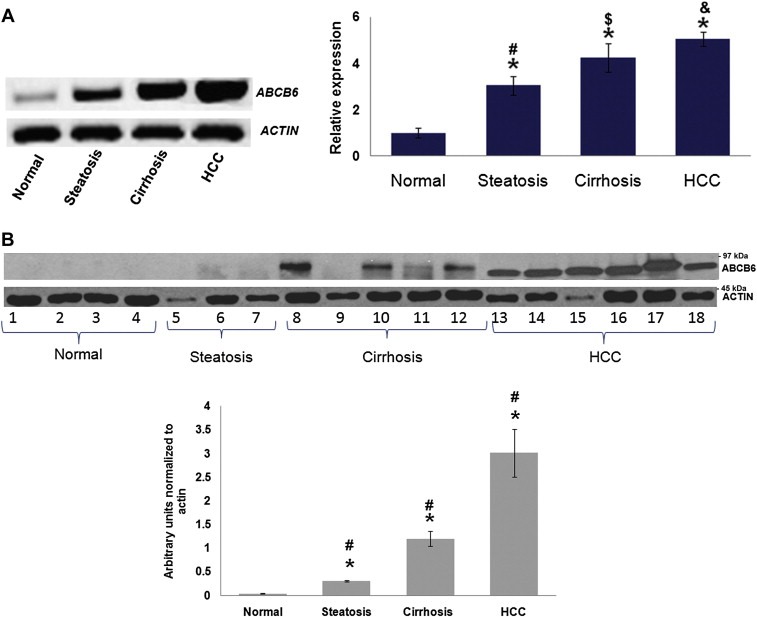
Expression pattern of ABCB6 during liver disease progression. (A) Left panel: PCR analysis of ABCB6 expression in representative tissue samples from patients with different stages of liver disease. ABCB6 expression was measured using ABCB6 specific primers. Right panel: relative ABCB6 expression normalized to internal reference control β‐actin. ‘#’, ‘$’, ‘&’ Significantly different between each disease state and ‘∗’ to normal liver: p < 0.05. (B) Top panel: Immunoblot analysis of ABCB6 expression in liver tissue obtained from patients diagnosed with different stages of liver disease. Each lane represents an individual patient sample. ABCB6 expression was measured in total lysate using ABCB6 specific antibody. Bottom panel: average ABCB6 protein expression (average of samples in each of the disease states) in the different disease states normalized to internal reference control β‐actin. ‘*’ Significantly different from normal liver and ‘#’ significantly different between each disease state: p < 0.05.
3.3. ABCB6 knockdown inhibits cellular proliferation and colony formation of HCC cells
To understand the significance of ABCB6 to HCC, hepatoma cell lines were used. The relative expression of ABCB6 was measured in human hepatoma cell lines HepG2, Hep3B and Huh7 through semi‐quantitative RT‐PCR of ABCB6 RNA and immunoblot analysis of ABCB6 protein. The data demonstrate significant upregulation of ABCB6 mRNA (Supplementary Figure 1A) and ABCB6 protein (Supplementary Figure 1B) in all the cancer cell lines. However, the Huh7 cell line exhibited the highest ABCB6 expression and was used for further functional studies.
To evaluate the effect of ABCB6 on HCC cells we used an shRNA‐mediated approach to knockdown endogenous ABCB6 in Huh7 cells. ABCB6 expression in the knockdown cell lines was evaluated by semi‐quantitative RT‐PCR of ABCB6 mRNA (data not shown) and immunoblot analysis of ABCB6 protein (Figure 3A). ABCB6 specific shRNA resulted in >70% reduction in endogenous ABCB6 expression, while there was no change in ABCB6 expression in cell lines carrying the control shRNA (Figure 3A bottom panel). We have previously demonstrated that ABCB6 overexpression promotes cellular porphyrin biosynthesis (Krishnamurthy et al., 2006). However, we found that loss of ABCB6 expression in the shRNA knockdown Huh7 cells did not affect steady state cellular porphyrin levels when compared with Huh7 cells carrying the control (scrambled) shRNA (Figure 3A top panel).
Figure 3.
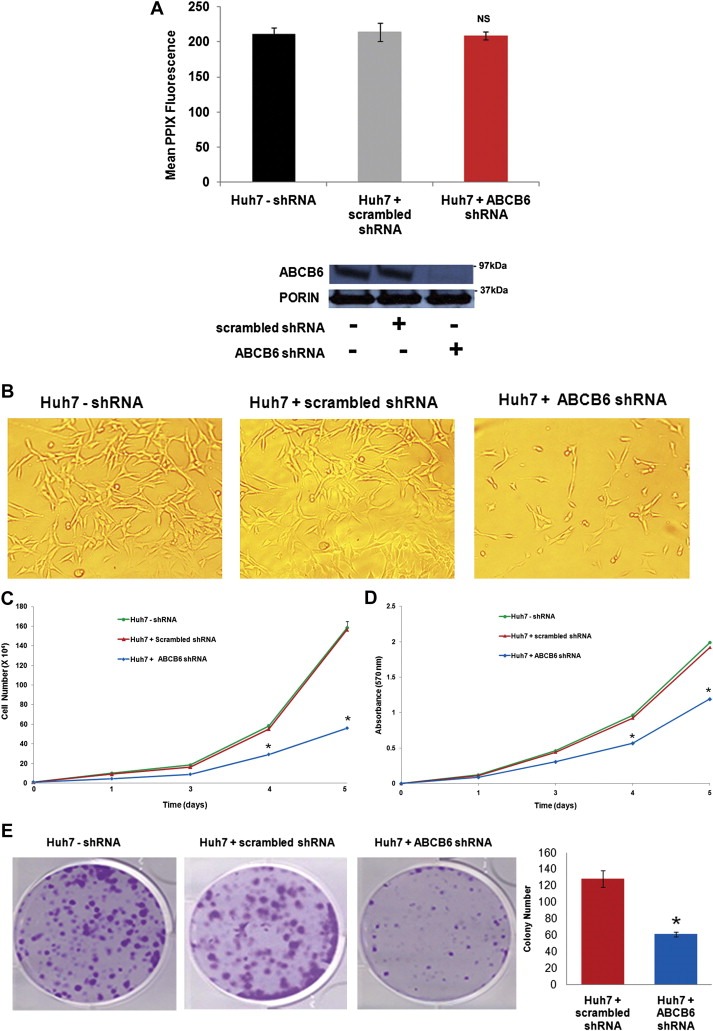
Effect of ABCB6 knockdown on growth, proliferation and colony formation of Huh7 cells. (A) Top panel: steady state mean PPIX fluorescence in Huh‐7 cells transduced with either ABCB6 specific shRNA or scrambled control shRNA (Huh7‐shRNA represents control cells with no shRNA transduction). PPIX levels were measured by FACS. ‘NS’ differences are non‐significant: p > 0.05. Bottom panel: immunoblot analysis of ABCB6 expression in Huh‐7 control, scrambled shRNA and ABCB6 specific shRNA transduced cells. ABCB6 expression was measured in the mitochondria using ABCB6 specific antibody. Mitochondrial protein porin expression was used as a loading control. (B) Phase‐contrast micrographs of Huh7 cells expressing either ABCB6 specific shRNA or scrambled control shRNA cultured for three days. Results representative of four independent experiments with n = 3 in each experiment. (C) Growth of Huh7 cells stably expressing either ABCB6 specific shRNA or scrambled control shRNA. Growth was measured by counting cells at the indicated time points. Values represent the mean ± SD; n = 6. ‘*’ Significantly different from control cells at each time point: p < 0.01. Results representative of four independent experiments. (D) Proliferation of Huh7 cells stably expressing either ABCB6 specific shRNA or scrambled control shRNA. Cell proliferation was evaluated using the MTT assay at the indicated time points. Values represent mean ± SD; n = 6. ‘*’ Significantly different from control cells at each time point: p < 0.01. Results representative of four independent experiments. (E) Left panel: colony or foci formation of cells transduced with ABCB6 specific shRNA compared to control cells. Figure representative of four independent experiments with n = 3 per experiment. Right panel: histogram of the number of colonies in each representative dish. Columns represent the mean ± SD; n = 3. ‘*’ Significantly different from scrambled control shRNA cells: p < 0.01. Results representative of four independent experiments.
During the generation of these stable cell lines, we observed decreased growth in cells where endogenous ABCB6 expression was knocked down compared to cells stably carrying the scrambled control shRNA (Figure 3B). These observations suggested a potential role for ABCB6 in cell growth and proliferation. To evaluate this further we monitored growth and proliferation of Huh7 cells carrying ABCB6 specific shRNA and compared it to Huh7 cells carrying the scrambled shRNA. The results showed that cellular growth (Figure 3C) and proliferation (Figure 3D) were significantly reduced in ABCB6 knockdown cells compared to ABCB6 expressing cells or cells expressing the scrambled control shRNA.
We next evaluated the role of ABCB6 in tumorigenicity by measuring the ability of ABCB6 to promote colony or foci formation. The ability of cells to form colonies or foci is considered a semi‐quantitative measure of cellular transformation and is assumed to be closely related to the process of in vivo carcinogenesis (Barrett et al., 1977). We found that knockdown of endogenous ABCB6 expression reduced the colony forming ability of Huh7 cells (Figure 3E: ∼60 colonies in ABCB6 knockdown cells compared to ∼125 colonies in ABCB6 expressing cells or in cells carrying the control shRNA). These data (Figure 3A–E) collectively suggest that endogenous ABCB6 might be essential for maintaining cellular growth, proliferation and colony forming ability of HCC cells.
3.4. Overexpression of ABCB6 promotes growth and proliferation of HCC cells
Based on the results presented in Figure 3, it is conceivable that ABCB6 overexpression promotes growth and proliferation of HCC cells. To test this hypothesis, we generated hepatoma cells (Huh7) that stably overexpress either an empty vector or an ABCB6 expression vector fused in frame with a flag tag as described (Krishnamurthy et al., 2006). ABCB6 expression in these overexpressing cells was confirmed by semi‐quantitative RT‐PCR (data not shown) and immunoblot analysis of ABCB6 protein (Figure 4A bottom panel). As previously reported addition of the flag tag to the C‐terminal end of ABCB6 did not affect its localization (Krishnamurthy et al., 2006). We next evaluated cellular porphyrin in the Huh7 ABCB6 overexpressing cells and found that unlike in ABCB6 depleted Huh7 cells, overexpression of ABCB6 in Huh7 cells resulted in increased cellular PPIX (Figure 4A top panel). These results are in agreement with our previous observations, which demonstrate increased porphyrin biosynthesis in ABCB6 overexpressing cells (Krishnamurthy et al., 2006).
Figure 4.
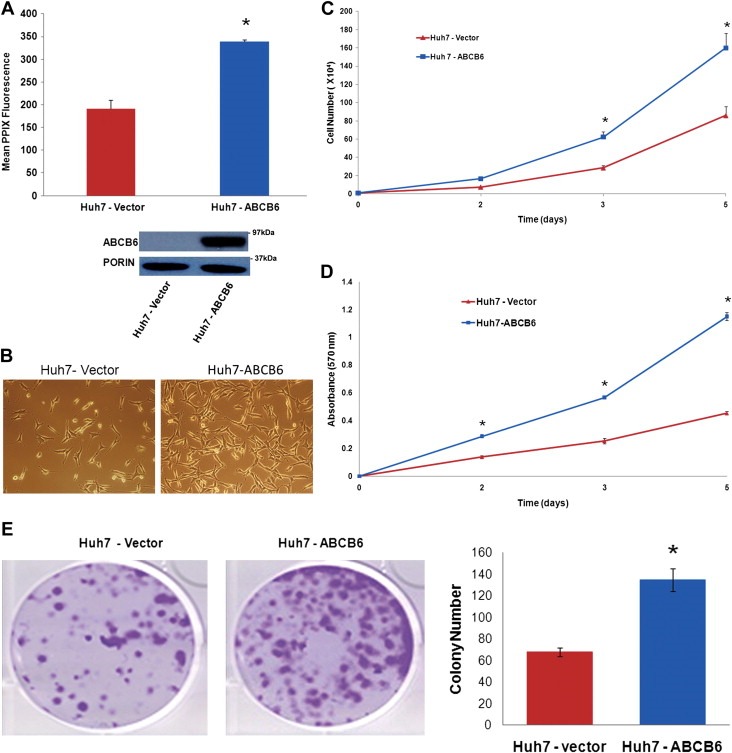
Cell proliferation and colony formation of Huh7 cells overexpressing ABCB6. (A) Top panel: ectopic overexpression of ABCB6 increases cellular PPIX levels. Values represent mean PPIX levels ± SD. ‘*’ Significantly different from vector control cells: p < 0.01. Bottom panel: immunoblot analysis of ABCB6 expression in overexpressing cells. ABCB6 expression was measured in mitochondria using anti‐flag antibody. (B) Phase‐contrast micrographs of Huh7 cells overexpressing either ABCB6 expression plasmid or empty vector plasmid. Results representative of four independent experiments with n = 3 per experiment. (C) Growth of Huh7 cells stably overexpressing either ABCB6 expression plasmid or vector control plasmid. Growth was measured by counting cells at the indicated time points. Values represent mean ± SD; n = 6. Results representative of four independent experiments. ‘*’ Significantly different from vector control cells at each time point: p < 0.01. (D) Proliferation of Huh7 cells stably overexpressing either ABCB6 expression plasmid or empty vector plasmid. Cell proliferation was evaluated using the MTT assay at the indicated time points. Values represent the mean ± SD; n = 6. Results representative of four independent experiments. ‘*’ Significantly different from control cells: p < 0.01. (E) Left panel: Colony or foci formation of cells stably overexpressing either ABCB6 expression plasmid or empty vector plasmid. Figures representative of four independent experiments with n = 3 per experiment. Right panel: histogram of the number of colonies in each representative dish. Columns represent the mean ± SD; n = 3. Results representative of four independent experiments. ‘*’ Significantly different from scrambled control shRNA cells: p < 0.01.
We found that ectopic expression of ABCB6 promoted hepatoma cell growth (Figure 4B and C; ∼1.8×10⁶ cells in ABCB6 overexpressing cells compared to ∼9×10⁵ cells in vector control cells at the end of 5 days of culturing). ABCB6 overexpression also resulted in increased cellular proliferation (Figure 4D). As before, we further evaluated the ability of ABCB6 to promote colony or foci formation. We found that ABCB6 overexpression promoted colony or foci formation of Huh7 cells that was significantly higher compared with that of cells transfected with the empty vector (Figure 4E; ∼130 colonies in ABCB6 expressing cells VS ∼60 colonies in vector control cells). Together these data suggest that ABCB6 overexpression promotes cell growth, proliferation and colony formation of HCC cells.
3.5. ABCB6 expression promotes growth and proliferation of HEK293 and K562 cells
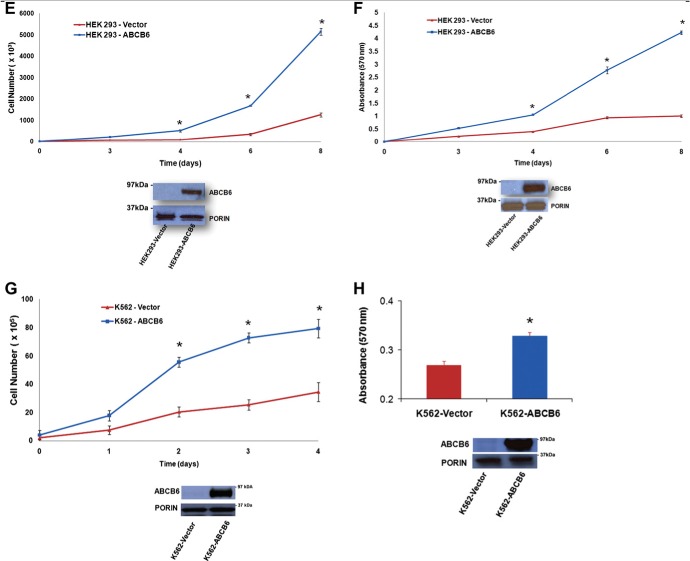
Previous studies have demonstrated increased expression of ABCB6 transcript in multiple cancers (Park et al., 2006; Szakacs et al., 2004; Yasui et al., 2004). However, it is not clear, whether ABCB6 can contribute to cell growth and proliferation in these tumor cells. To test this hypothesis we selected two cell lines; HEK293 representing a normal human cell line transformed with adenovirus and K562 representing a human immortalized leukemia cell line. We established stable knockdown of ABCB6 expression in these cells using ABCB6 specific shRNA as described for Huh7 cells above. Knockdown of ABCB6 expression was confirmed by semi‐quantitative RT‐PCR (data not shown) and immunoblot analysis of ABCB6 protein (Supplementary Figure 2A and B). As with Huh7 cells, knockdown of endogenous ABCB6 in K562 and HEK293 cells did not affect the steady state cellular porphyrin levels compared with cells carrying the control (scrambled) shRNA (Supplementary Figure 2A and B respectively). We found that knockdown of ABCB6 reduced HEK293 cell growth (Figure 5A) and proliferation (Figure 5B) relative to the control shRNA cells. Similarly we found that knockdown of ABCB6 in K562 cells reduced growth (Figure 5C) and proliferation (Figure 5D) compared to the control shRNA cells.
Figure 5.
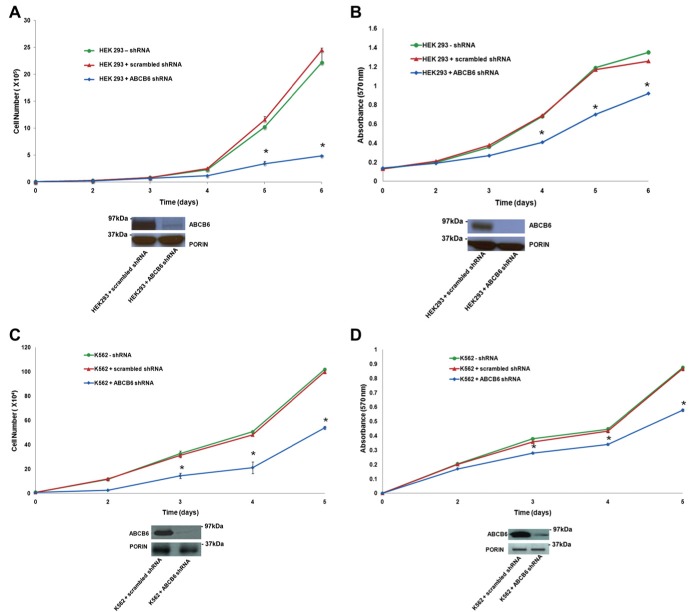
ABCB6 affects growth and proliferation of HEK293 and K562 cells. (A) Top panel: growth and (B) Top panel: proliferation of HEK293 cells stably expressing either ABCB6 specific shRNA or scrambled control shRNA. (A) and (B) bottom panels: immunoblot analysis of ABCB6 expression in HEK293 ABCB6 knockdown and control cells. (C) Top panel: growth and (D) Top panel: proliferation of K562 cells stably expressing either ABCB6 specific shRNA or scrambled control shRNA. (C) and (D) bottom panels: immunoblot analysis of ABCB6 expression in K562 ABCB6 knockdown and control cells. (E) Top panel: growth and (F) Top panel: proliferation of HEK293 cells overexpressing ABCB6. (E) and (F) bottom panel: immunoblot analysis of ABCB6 expression in HEK293 ABCB6 overexpressing and vector control cells. (G) Top panel: growth and (H) Top panel: proliferation of K562 cells overexpressing ABCB6. (G) and (H) bottom panels: immunoblot analysis of ABCB6 expression in K562 ABCB6 overexpressing and vector control cells. In all figures values represent the mean ± SD; n = 6. ‘*’ Significantly different from control cells at each time point: p < 0.01. Results representative of four independent experiments. ABCB6 expression was measured in mitochondria using ABCB6 specific antibody or anti‐flag antibody (for knockdown and overexpressing cells respectively).
Based on the results presented in Figures 3 and 4 we hypothesized that overexpression of ABCB6 in HEK293 and K562 cells would promote growth and proliferation of these cells similar to what was seen with ABCB6 overexpressing Huh7 cells. To test this hypothesis we established ABCB6 overexpressing HEK293 and K562 cells using a mammalian expression plasmid carrying the ABCB6 gene fused in frame with the flag tag as described (Krishnamurthy et al., 2006). As for the hepatoma cell line Huh7, stable overexpression of ABCB6 was confirmed in HEK293 and K562 cells by semi‐quantitative RT‐PCR (data not shown) and immunoblot analysis (Supplementary Figure 2C and D). As seen in ABCB6 overexpressing Huh7 cells, ABCB6 overexpression in K562 and HEK293 cells resulted in increased cellular porphyrin compared to vector control cells (Supplementary Figure 2C and D respectively). ABCB6 mediated growth and proliferation in these cells was measured as described in methods. The results demonstrate that overexpression of ABCB6 promoted growth and proliferation of both HEK293 (Figure 5E and F) and K562 (Figure 5G and H) cells. Together these results combined with results presented in Figures 3 and 4 suggest that ABCB6 expression might play an important role in cell growth and proliferation.
3.6. Blocking heme biosynthesis does not completely abolish ABCB6 mediated cell growth and proliferation
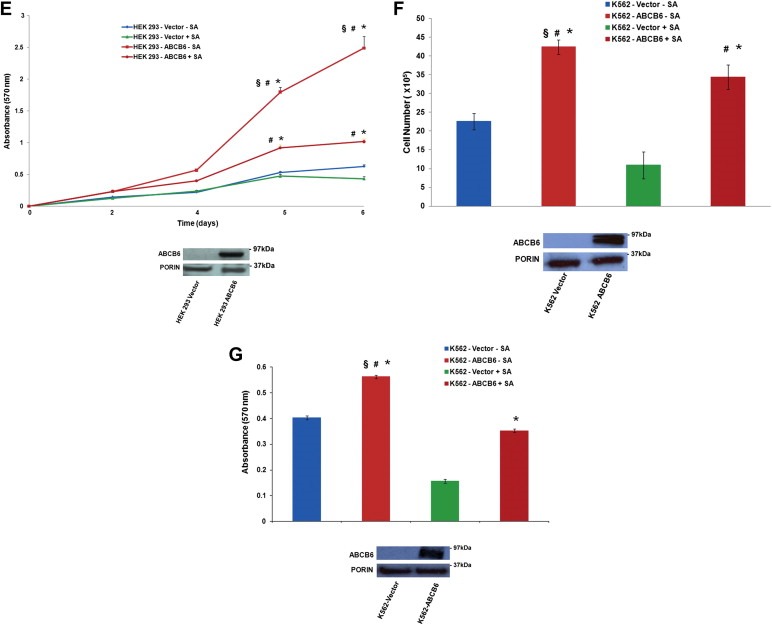
In our endogenous ABCB6 knockdown Huh7, HEK293 and K562 cells, we did not see any change in cellular porphyrin levels. However, loss of ABCB6 expression in these same cells resulted in decreased growth and proliferation. In contrast, ABCB6 overexpression in Huh7, HEK293 and K562 cells resulted in increased cellular porphyrin and increased growth and proliferation. These observations lead us to evaluate the relative contribution of ABCB6 mediated increase in cellular porphyrin to cell growth and proliferation in ABCB6 overexpressing cells. To test this, we first evaluated the significance of heme biosynthesis to growth and proliferation of Huh7, HEK293 and K562 cells. We used succinylacetone to generate heme deficiency in the above three cell lines. Succinylacetone is a potent and specific inhibitor of 5‐aminolevulinic acid dehydratase, the second enzyme in the heme biosynthetic pathway (De Matteis and Marks, 1983; Ebert et al., 1979). Succinylacetone effectively inhibited heme biosynthesis in all the three cell lines (data not shown) and resulted in significant decrease in growth and proliferation of all the three cell lines tested (Huh7, HEK293 and K562; Figure 6). We also examined the effect of succinylacetone on the transformation phenotype of Huh7 and HEK293 cells using colony or focus formation assay. Supplementary Figure 3 demonstrates that succinylacetone reduced the ability of Huh7 and HEK293 cells to form foci. These results suggest a role for cellular porphyrins in growth and proliferation of Huh7 and HEK293 cells.
Figure 6.
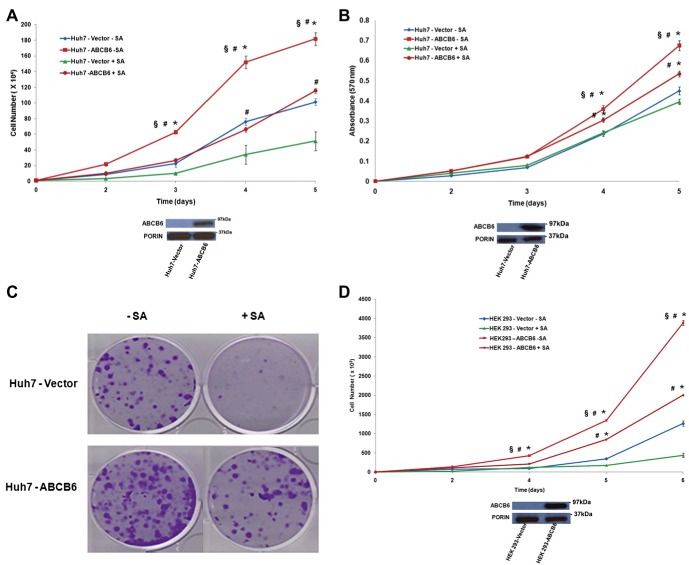
Cell growth and proliferation of ABCB6 overexpressing and vector control cells in the presence and absence of succinylacetone. (A) Top panel: growth, (B) Top panel: proliferation and (C) colony formation of Huh7 vector and ABCB6 overexpressing cells in the presence and absence of SA. (A) and (B) bottom panels: immunoblot analysis of ABCB6 expression in ABCB6 overexpressing and vector control Huh7 cells. (D and F) cell growth and (E and G) cell proliferation in the presence of SA in (D and E) HEK293 and (F and G) K562 cells. (D–G) bottom panels: immunoblot analysis of ABCB6 expression in the cells used in these experiments. ABCB6 expression was measured in mitochondria using flag specific antibody. In all figures values represent the mean ± SD; n = 6. Results representative of four independent experiments. ‘*’ Significantly different from vector control cells in the absence of SA: p < 0.01. ‘#’ Significantly different from vector control cells treated with SA: p < 0.01. ‘§’ Significantly different from ABCB6 expressing cells treated with SA: p < 0.01.
Figure 6.
(continued)
We next evaluated the contribution of ABCB6 mediated increase in cellular porphyrins to growth and proliferation of the three ABCB6 overexpressing cell lines, Huh7, HEK293 and K562. To test this, ABCB6 overexpressing cells were treated with succinylacetone for 48 h to block porphyrin biosynthesis. Following treatment with succinylacetone loss of porphyrin biosynthesis was confirmed in these cells by FACS analysis of cellular porphyrin levels (Supplementary Figure 4; data shown for Huh7 and K562). The results demonstrate that blocking heme biosynthesis in ABCB6 overexpressing cells results in significant decrease in growth, proliferation and colony forming ability of Huh7 (Figure 6A, B and C respectively), HEK293 (Figure 6D and E) and K562 (Figure 6F and G) cells compared to their untreated controls. Interestingly however, succinylacetone mediated decrease in growth and proliferation of ABCB6 overexpressing cells was still significantly higher than that of vector control cells that were either untreated or treated with succinylacetone (Figure 6A–G; P < 0.01). These results suggest that blocking porphyrin biosynthesis using succinylacetone does not completely inhibit ABCB6 mediated growth and proliferation and that ABCB6 might promote growth and proliferation of cells by a mechanism that is not entirely dependent on its ability to regulate cellular porphyrin biosynthesis.
Figure 5.
(continued)
3.7. Reduced endogenous ABCB6 expression results in G2/M phase arrest
We next sought to understand the mechanism by which ABCB6 regulates growth and proliferation. During our initial studies, we found that growth attenuation of more than 70% in ABCB6 knockdown cells (relative to the control shRNA expressing cells) was not accompanied by a corresponding increase in apoptotic cells (data not shown). Thus in an effort to understand ABCB6 mediated growth suppression we evaluated cell cycle by flow cytometry in ABCB6 knockdown Huh7, HEK239 and K562 cells and compared it to Huh7, HEK293 and K562 cells stably expressing the scrambled control shRNA. Following release from synchronization at zero time point the percentage of cells in the three phases of the cell cycle was comparable and was not significantly different between the knockdown and control cells (Figure 7A and B and data not shown respectively). However, at 24 h and 36 h following release from synchronization we found that loss of ABCB6 expression resulted in delayed progression through G2/M phase of the cell cycle in Huh7, HEK293 and K562 cells. In Huh7 ABCB6 depleted cells, ∼28% and ∼34% and of the cells were in G2/M phase compared to ∼16% and ∼22% in Huh7 control cells at 24 h and 36 h respectively (Figure 7A top and bottom panels respectively). Similar increases in G2/M phase cell numbers were seen in both HEK293 and K562 ABCB6 depleted cells relative to the control cells (Figure 7B and data not shown respectively). Interestingly we saw very few cells in subG0/G1 phase in the knockdown cell lines, further confirming our initial observation that ABCB6 knockdown did not affect apoptosis. Together these results suggest that depletion of ABCB6 results in cell cycle arrest at the G2/M phase of the cell cycle.
Figure 7.
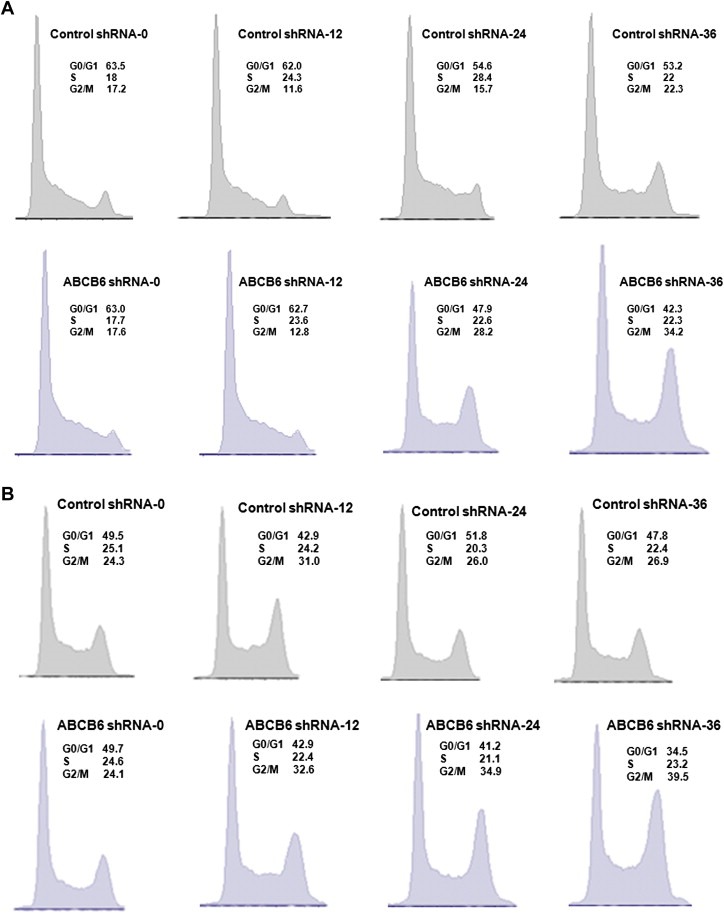
Effect of ABCB6 knockdown on cell cycle distribution of Huh7 and HEK293 cells. (A) Top panel: Cell cycle progression in Huh7 cells carrying the control shRNA. Bottom panel: Cell cycle progression in Huh7 cells carrying the ABCB6‐shRNA. (B) Top panel: Cell cycle progression in HEK293 cells carrying control shRNA. Bottom panel: Cell cycle progression in HEK293 cells carrying the ABCB6‐shRNA. The percentage of cells in each phase was calculated from a sample of 20,000 cells using the program FlowJo. Results representative of four independent experiments.
4. Discussion
Increased expression of the mitochondrial transporter ABCB6 has been found in various human malignancies including HCC (Heimerl et al., 2007; Park et al., 2006; Szakacs et al., 2004; Yasui et al., 2004). In this study, we investigated the significance of this increased ABCB6 expression to carcinogenesis in general and to HCC in particular, by both loss of function and gain of function analysis.
Real time PCR analysis of HCC showed significant upregulation of ABCB6 expression in all the HCC samples analyzed, thus confirming previous observations (Emadi‐Konjin et al., 2002). We extended these observations further to show that the transcriptional upregulation of ABCB6 translates into increased expression of ABCB6 protein. Further, increased ABCB6 mRNA and protein expression were also seen in the three‐hepatoma cell lines demonstrating that cultured tumor cell lines retain increased ABCB6 expression in vitro.
Most cases of HCC are secondary to either a viral (hepatitis B or C) infection or cirrhosis, both of which are characterized by chronic liver injury (Sanyal et al., 2010; Schutte et al., 2009). In fact, progressive injury to the liver is considered one of the precipitating factors in the development and progression of HCC (Aravalli et al., 2008; Whittaker et al., 2010). Progressive liver injury is in general characterized by steatosis (fatty liver) which leads to steatohepatitis, followed by cirrhosis, the last condition being the hallmark of chronic liver injury. We found progressive increase in ABCB6 expression that directly correlated with liver disease progression. Interestingly ABCB6 expression was induced as early as steatosis with maximum expression seen in HCC followed by cirrhosis. Supporting these observations, previous studies have demonstrated a similar increase in ABCB6 expression in hyperplastic liver nodules compared to the preneoplastic liver in a rat model of hepatocarcinogenesis (Furuya et al., 1997). In this context, it is interesting to note that during the preneoplastic phase, the liver is often the site of severe injury (usually chronic hepatitis and/or cirrhosis), which promotes liver regeneration with accelerated hepatocyte cycling in an organ that is otherwise proliferatively at rest. Interestingly this process of hepatocyte regeneration is accelerated by upregulation of mitogenic pathways involving molecular and genetic mechanisms (Michalopoulos, 2010). Thus, induction of ABCB6 in response to liver injury suggests a possible role for ABCB6 during cell proliferation and growth (discussed further in the next paragraph).
Increased ABCB6 expression is a feature that is not unique to HCC. Upregulated expression of ABCB6 is seen in multiple cancers but the significance of this induced expression is not clear. One of the hallmarks of cancer is deregulated growth, which could be either due to a decrease in apoptosis or an increase in cell proliferation. Here we observed that depletion of ABCB6 leads to decreased cell growth, proliferation and colony formation of hepatomas, transformed human embryonic kidney and immortalized human leukemia cells. In contrast, ABCB6 overexpression in these tumor cells resulted in increased growth and proliferation. Our initial analysis suggested that this decrease in cell growth seen in ABCB6 knockdown cells is not due to an increase in apoptosis, but might be related to cell proliferation. Supporting these observations, ABCB6 expression has been reported to be induced during liver regeneration in a pattern that paralleled the wave of DNA synthesis (Emadi‐Konjin et al., 2002). Further, c‐myc an oncogenic transcription factor has been shown to interact with ABCB6 promoter (Li et al., 2003). Given that c‐myc plays a prominent role in regulating proliferative and metabolic genes that are involved in DNA replication, protein synthesis, cell respiration and energy metabolism (Dominguez‐Sola et al., 2007; Iritani and Eisenman, 1999; Sutphin et al., 2007), potential c‐myc mediated regulation of ABCB6 is reasonable and supports a role for ABCB6 in cell growth and proliferation. The question however, is how ABCB6 regulates cell growth and proliferation?
We have recently demonstrated that ABCB6 localizes to the mitochondria and regulates porphyrin biosynthesis (Krishnamurthy et al., 2006). In our studies, overexpression of ABCB6 promoted porphyrin biosynthesis in all the three cell lines used in the study confirming our earlier observations. However, knockdown of endogenous ABCB6 expression did not alter porphyrin levels in any of the cell lines evaluated in this study. Given that ABCB6 regulates porphyrin biosynthesis, it is not clear why loss of ABCB6 expression did not affect cellular porphyrin biosynthesis. One possibility is that depletion of ABCB6 in these cells might have activated compensatory mechanisms that might have compensated for loss of ABCB6. Supporting this line of thought we found increased expression of porphyrin biosynthesis pathway enzymes, including the rate limiting enzyme aminolevulinic acid synthase (ALAS) in ABCB6 knockdown cells (data not shown).
Altered porphyrin biosynthesis could potentially disrupt cellular metabolism (Lynch et al., 2009) leading to altered growth and proliferation. Because ABCB6 overexpressing cells demonstrated increased cellular porphyrins we evaluated the relative contribution of ABCB6 mediated cellular porphyrins to growth and proliferation. Blocking porphyrin biosynthesis decreased growth and proliferation of both vector and ABCB6 overexpressing cells relative to their untreated control cells. Interestingly however, blocking porphyrin biosynthesis in ABCB6 overexpressing Huh7, HEK293 and K562 cells did not completely eliminate ABCB6 mediated growth and proliferation, despite similar reduction in cellular porphyrin levels in both vector control and ABCB6 overexpressing cells. Thus, ABCB6 appears to promote growth and proliferation by mechanisms that are both dependent and independent of its ability to regulate porphyrin biosynthesis.
To decipher the mechanism by which ABCB6 promotes cell proliferation we performed cell cycle analysis. We found that attenuation of ABCB6 expression in carcinoma cells delayed cell cycle progression through G2/M phase of the cell cycle signifying cell arrest at G2/M phase. This suggests that ABCB6 expression might play a role in cell cycle progression. Supporting these observations, recent studies demonstrate that the transcriptional repressor complex E2F‐p130 is bound to ABCB6 promoter under conditions of cell cycle arrest (Cam et al., 2004). From our present studies, it is not clear how ABCB6 regulates cell cycle progression. Potential possibilities include ABCB6s' location and function as a mitochondrial membrane transporter that could alter mitochondrial dynamics leading to some level of control over cellular proliferation. This hypothesis is supported by the observation that the nuclear respiratory factor −1 (NRF1) binds to ABCB6 promoter and could potential regulate ABCB6 expression (Cam et al., 2004). NRF1 contributes to both mitochondrial biogenesis and transcriptionally activates nuclear‐encoded mitochondrial genes with respiratory functions (Cam et al., 2004). Further, recent evidence supports the concept of a mitochondrial checkpoint that regulates cell cycle progression (Mitra et al., 2009). Alternatively, since G2/M phase arrest is generally characterized by deregulation of cell cycle regulatory components, ABCB6 might interact with one or more of these components, thus precipitating G2/M phase arrest. Future studies will decipher the mechanism(s) by which ABCB6 regulates cell cycle.
In conclusion, the present findings suggest that ABCB6 is differentially upregulated in liver disease progression with high expression in cirrhosis and HCC. Attenuation of ABCB6 expression has anti‐proliferative effects in cancer cells while upregulation of this gene may be causally related to carcinogenesis in general and tumorigenesis in HCC in particular. Our evidence suggests that ABCB6 might target cell cycle regulatory components that are involved in carcinogenesis. However, additional studies are required to precisely decipher the mechanisms underlying ABCB6‐mediated regulation of these components and the in vivo significance of ABCB6 expression to tumorigenesis. To our knowledge, this is the first report implicating ABCB6 in carcinogenesis through regulation of cell cycle that affects cell growth and proliferation.
Supporting information
The following are the Supplementary data related to this article:
Relative expression of ABCB6 in hepatoma cell lines. (A) Top panel: PCR analysis of ABCB6 mRNA levels in hepatoma cells. ABCB6 expression was measured using gene specific primers. Bottom panel: relative ABCB6 expression normalized to internal reference standard β‐actin. Results representative of four independent experiments.
Relative expression of ABCB6 in hepatoma cell lines.(B) Top panel: immunoblot analysis of ABCB6 expression in hepatoma cells. ABCB6 expression was measured in isolated mitochondria (100 μg) using ABCB6 specific antibody. Results representative of four independent experiments. Bottom panel: relative ABCB6 expression normalized to internal reference control mitochondrial protein porin. The inset depicts the actual difference between Hep3B, HepG2 and primary hepatocytes.
Effect of ABCB6 expression on cellular porphyrin levels. (A) Top panel: steady state porphyrin levels in K562 ABCB6 knockdown and control cells. (A–D) bottom panels: immunoblot analysis of ABCB6 expression in the cells used in these experiments. Cellular PPIX was measured by FACS. ABCB6 expression was measured in isolated mitochondria using anti‐flag antibody. ‘NS’ differences are not significant. ‘*’ Significantly different from control cells. p < 0.01. Columns represent mean ± SD; n = 3 per experiment. Results representative of four independent experiments.
Effect of ABCB6 expression on cellular porphyrin levels. (B) Top panel: steady state porphyrin levels in HEK293 ABCB6 knockdown and control cells. (A–D) bottom panels: immunoblot analysis of ABCB6 expression in the cells used in these experiments. Cellular PPIX was measured by FACS. ABCB6 expression was measured in isolated mitochondria using anti‐flag antibody. ‘NS’ differences are not significant. ‘*’ Significantly different from control cells. p < 0.01. Columns represent mean ± SD; n = 3 per experiment. Results representative of four independent experiments.
Effect of ABCB6 expression on cellular porphyrin levels. (C) Top panel: steady state porphyrin levels in K562 ABCB6 overexpressing and vector control cells. (A–D) bottom panels: immunoblot analysis of ABCB6 expression in the cells used in these experiments. Cellular PPIX was measured by FACS. ABCB6 expression was measured in isolated mitochondria using anti‐flag antibody. ‘NS’ differences are not significant. ‘*’ Significantly different from control cells. p < 0.01. Columns represent mean ± SD; n = 3 per experiment. Results representative of four independent experiments.
Effect of ABCB6 expression on cellular porphyrin levels. (D) Top panel: steady state porphyrin levels in HEK293 ABCB6 overexpressing and vector control cells. (A–D) bottom panels: immunoblot analysis of ABCB6 expression in the cells used in these experiments. Cellular PPIX was measured by FACS. ABCB6 expression was measured in isolated mitochondria using anti‐flag antibody. ‘NS’ differences are not significant. ‘*’ Significantly different from control cells. p < 0.01. Columns represent mean ± SD; n = 3 per experiment. Results representative of four independent experiments.
Effect of blocking porphyrin biosynthesis on colony forming ability of Huh7 and HEK293 cells. (A) colony forming ability of Huh7. Results representative of four independent experiments.
Effect of blocking porphyrin biosynthesis on colony forming ability of Huh7 and HEK293 cells. (B) colony forming ability of HEK293 cells in the presence and absence of SA. Results representative of four independent experiments.
Cellular porphyrin levels in Huh7 and K562 cells in the presence and absence of SA. (A) Mean PPIX levels in Huh7 vector control and Huh7 ABCB6 overexpressing cells in the presence and absence of SA. Cells were pretreated with SA for 48 h and PPIX levels were measured every 24 h for a total of 120 h. Data represent PPIX levels measured at 120 h at which time point maximum differences in growth and proliferation was observed in the corresponding experiments presented in Figure 6. Results representative of four independent experiments. ‘*’ Significantly different from vector control cells in the absence of SA; ‘#’ Significantly different from vector control and ABCB6 overexpressing cells treated with SA.
Cellular porphyrin levels in Huh7 and K562 cells in the presence and absence of SA. (B) Mean PPIX levels in K562 vector control and K562 ABCB6 overexpressing cells in the presence and absence of SA. Cells were pretreated with SA for 48 h and PPIX levels were measured every 24 h for a total of 120 h. Data represent PPIX levels measured at 120 h at which time point maximum differences in growth and proliferation was observed in the corresponding experiments presented in Figure 6. Results representative of four independent experiments. ‘*’ Significantly different from vector control cells in the absence of SA; ‘#’ Significantly different from vector control and ABCB6 overexpressing cells treated with SA.
Acknowledgments
The authors thank Richard Hastings and Alicia Zeiger (KUMC flow cytometry core laboratory) for flow cytometric analysis and Dr. Thomas Yankee (Scientific Director, KUMC flow cytometry core laboratory and Assistant Professor, Department of Microbiology, Molecular Genetics and Immunology) for helping us interpret the results. We thank the KU liver center tissue bank for patient samples. We thank Mahitha Oruganti for technical assistance. We acknowledge funding support from the National Institutes of Health (P20RR021940, T32ES007079)
Supplementary data 1.
Supplementary data associated with this article can be found, in the online version, at doi:10.1016/j.molonc.2011.07.005.
Polireddy Kishore, Chavan Hemantkumar, Abdulkarim Bashar A. and Krishnamurthy Partha, (2011), Functional significance of the ATP‐binding cassette transporter B6 in hepatocellular carcinoma, Molecular Oncology, 5, doi: 10.1016/j.molonc.2011.07.005.
References
- Abramoff, M.D. , Magelhaes, P.J. , Ram, S.J. , 2004. Image processing with image. J. Biophotonics Int.. 11, 36–42. [Google Scholar]
- Anzola, M. , 2004. Hepatocellular carcinoma: role of hepatitis B and hepatitis C viruses proteins in hepatocarcinogenesis. J. Viral Hepat.. 11, 383–393. [DOI] [PubMed] [Google Scholar]
- Aravalli, R.N. , Steer, C.J. , Cressman, E.N. , 2008. Molecular mechanisms of hepatocellular carcinoma. Hepatology. 48, 2047–2063. [DOI] [PubMed] [Google Scholar]
- Barrett, J.C. , Crawford, B.D. , Grady, D.L. , Hester, L.D. , Jones, P.A. , Benedict, W.F. , Ts'o, P.O. , 1977. Temporal acquistion of enhanced fibrinolytic activity by syrian hamster embryo cells following treatment with benzo(a)pyrene. Cancer Res.. 37, 3815–3823. [PubMed] [Google Scholar]
- Bosch, F.X. , Ribes, J. , Cleries, R. , Diaz, M. , 2005. Epidemiology of hepatocellular carcinoma. Clin. Liver Dis.. 9, 191–211. [DOI] [PubMed] [Google Scholar]
- Bruix, J. , Boix, L. , Sala, M. , Llovet, J.M. , 2004. Focus on hepatocellular carcinoma. Cancer Cell. 5, 215–219. [DOI] [PubMed] [Google Scholar]
- Cam, H. , Balciunaite, E. , Blais, A. , Spektor, A. , Scarpulla, R.C. , Young, R. , Kluger, Y. , Dynlacht, B.D. , 2004. A common set of gene regulatory networks links metabolism and growth inhibition. Mol. Cell. 16, 399–411. [DOI] [PubMed] [Google Scholar]
- Chavan, H. , Oruganti, M. , Krishnamurthy, P. , 2011. The ATP binding cassette transporter ABCB6 is induced by arsenic and protects against arsenic cytotoxicity. Toxicol. Sci.. 120, 519–528. [DOI] [PMC free article] [PubMed] [Google Scholar]
- Chen, C.J. , Wang, L.Y. , Lu, S.N. , Wu, M.H. , You, S.L. , Zhang, Y.J. , Wang, L.W. , Santella, R.M. , 1996. Elevated aflatoxin exposure and increased risk of hepatocellular carcinoma. Hepatology. 24, 38–42. [DOI] [PubMed] [Google Scholar]
- De Matteis, F. , Marks, G.S. , 1983. The effect of N-methylprotoporphyrin and succinyl-acetone on the regulation of heme biosynthesis in chicken hepatocytes in culture. FEBS Lett.. 159, 127–131. [DOI] [PubMed] [Google Scholar]
- Dean, M. , Annilo, T. , 2005. Evolution of the ATP-binding cassette (ABC) transporter superfamily in vertebrates. Annu. Rev. Genomics Hum. Genet.. 6, 123–142. [DOI] [PubMed] [Google Scholar]
- Dominguez-Sola, D. , Ying, C.Y. , Grandori, C. , Ruggiero, L. , Chen, B. , Li, M. , Galloway, D.A. , Gu, W. , Gautier, J. , Dalla-Favera, R. , 2007. Non-transcriptional control of DNA replication by c-Myc. Nature. 448, 445–451. [DOI] [PubMed] [Google Scholar]
- Ebert, P.S. , Hess, R.A. , Frykholm, B.C. , Tschudy, D.P. , 1979. Succinylacetone, a potent inhibitor of heme biosynthesis: effect on cell growth, heme content and delta-aminolevulinic acid dehydratase activity of malignant murine erythroleukemia cells. Biochem. Biophys. Res. Commun.. 88, 1382–1390. [DOI] [PubMed] [Google Scholar]
- Emadi-Konjin, H.P. , Zhang, H. , Anandan, V. , Sun, D. , Schuetz, J. , Furuya, K.N. , 2002. Isolation of a genomic clone containing the promoter region of the human ATP binding cassette (ABC) transporter, ABCB6. Biochim. Biophys. Acta. 1574, 117–130. [DOI] [PubMed] [Google Scholar]
- Feitelson, M.A. , Sun, B. , Satiroglu Tufan, N.L. , Liu, J. , Pan, J. , Lian, Z. , 2002. Genetic mechanisms of hepatocarcinogenesis. Oncogene. 21, 2593–2604. [DOI] [PubMed] [Google Scholar]
- Furuya, K.N. , Bradley, G. , Sun, D. , Schuetz, E.G. , Schuetz, J.D. , 1997. Identification of a new P-glycoprotein-like ATP-binding cassette transporter gene that is overexpressed during hepatocarcinogenesis. Cancer Res.. 57, 3708–3716. [PubMed] [Google Scholar]
- Heimerl, S. , Bosserhoff, A.K. , Langmann, T. , Ecker, J. , Schmitz, G. , 2007. Mapping ATP-binding cassette transporter gene expression profiles in melanocytes and melanoma cells. Melanoma Res.. 17, 265–273. [DOI] [PubMed] [Google Scholar]
- Imbeaud, S. , Ladeiro, Y. , Zucman-Rossi, J. , 2010. Identification of novel oncogenes and tumor suppressors in hepatocellular carcinoma. Semin. Liver Dis.. 30, 75–86. [DOI] [PubMed] [Google Scholar]
- Iritani, B.M. , Eisenman, R.N. , 1999. c-Myc enhances protein synthesis and cell size during B lymphocyte development. Proc. Natl. Acad. Sci. U S A. 96, 13180–13185. [DOI] [PMC free article] [PubMed] [Google Scholar]
- Krishnamurthy, P. , Ross, D.D. , Nakanishi, T. , Bailey-Dell, K. , Zhou, S. , Mercer, K.E. , Sarkadi, B. , Sorrentino, B.P. , Schuetz, J.D. , 2004. The stem cell marker Bcrp/ABCG2 enhances hypoxic cell survival through interactions with heme. J. Biol. Chem.. 279, 24218–24225. [DOI] [PubMed] [Google Scholar]
- Krishnamurthy, P.C. , Du, G. , Fukuda, Y. , Sun, D. , Sampath, J. , Mercer, K.E. , Wang, J. , Sosa-Pineda, B. , Murti, K.G. , Schuetz, J.D. , 2006. Identification of a mammalian mitochondrial porphyrin transporter. Nature. 443, 586–589. [DOI] [PubMed] [Google Scholar]
- Laurent-Puig, P. , Legoix, P. , Bluteau, O. , Belghiti, J. , Franco, D. , Binot, F. , Monges, G. , Thomas, G. , Bioulac-Sage, P. , Zucman-Rossi, J. , 2001. Genetic alterations associated with hepatocellular carcinomas define distinct pathways of hepatocarcinogenesis. Gastroenterology. 120, 1763–1773. [DOI] [PubMed] [Google Scholar]
- Lecureur, V. , Thottassery, J.V. , Sun, D. , Schuetz, E.G. , Lahti, J. , Zambetti, G.P. , Schuetz, J.D. , 2001. Mdr1b facilitates p53-mediated cell death and p53 is required for Mdr1b upregulation in vivo. Oncogene. 20, 303–313. [DOI] [PubMed] [Google Scholar]
- Li, Z. , Van Calcar, S. , Qu, C. , Cavenee, W.K. , Zhang, M.Q. , Ren, B. , 2003. A global transcriptional regulatory role for c-Myc in Burkitt's lymphoma cells. Proc. Natl. Acad. Sci. U S A. 100, 8164–8169. [DOI] [PMC free article] [PubMed] [Google Scholar]
- Llovet, J.M. , Burroughs, A. , Bruix, J. , 2003. Hepatocellular carcinoma. Lancet. 362, 1907–1917. [DOI] [PubMed] [Google Scholar]
- Lynch, J. , Fukuda, Y. , Krishnamurthy, P. , Du, G. , Schuetz, J.D. , 2009. Cell survival under stress is enhanced by a mitochondrial ATP-binding cassette transporter that regulates hemoproteins. Cancer Res.. 69, 5560–5567. [DOI] [PMC free article] [PubMed] [Google Scholar]
- Marotta, F. , Vangieri, B. , Cecere, A. , Gattoni, A. , 2004. The pathogenesis of hepatocellular carcinoma is multifactorial event. Novel immunological treatment in prospect. Clin. Ter.. 155, 187–199. [PubMed] [Google Scholar]
- Michalopoulos, G.K. , 2010. Liver regeneration after partial hepatectomy: critical analysis of mechanistic dilemmas. Am. J. Pathol.. 176, 2–13. [DOI] [PMC free article] [PubMed] [Google Scholar]
- Mitra, K. , Wunder, C. , Roysam, B. , Lin, G. , Lippincott-Schwartz, J. , 2009. A hyperfused mitochondrial state achieved at G1-S regulates cyclin E buildup and entry into S phase. Proc. Natl. Acad. Sci. U S A. 106, 11960–11965. [DOI] [PMC free article] [PubMed] [Google Scholar]
- Mulcahy, M.F. , 2005. Management of hepatocellular cancer. Curr. Treat. Options Oncol.. 6, 423–435. [DOI] [PubMed] [Google Scholar]
- Park, S. , Shimizu, C. , Shimoyama, T. , Takeda, M. , Ando, M. , Kohno, T. , Katsumata, N. , Kang, Y.K. , Nishio, K. , Fujiwara, Y. , 2006. Gene expression profiling of ATP-binding cassette (ABC) transporters as a predictor of the pathologic response to neoadjuvant chemotherapy in breast cancer patients. Breast Cancer Res. Treat.. 99, 9–17. [DOI] [PubMed] [Google Scholar]
- Parkin, D.M. , Bray, F. , Ferlay, J. , Pisani, P. , 2005. Global cancer statistics, 2002. CA Cancer J. Clin.. 55, 74–108. [DOI] [PubMed] [Google Scholar]
- Pons-Renedo, F. , Llovet, J.M. , 2003. Hepatocellular carcinoma: a clinical update. MedGenMed. 5, 11 [PubMed] [Google Scholar]
- Sanyal, A.J. , Yoon, S.K. , Lencioni, R. , 2010. The etiology of hepatocellular carcinoma and consequences for treatment. Oncologist. 4, 14–22. [DOI] [PubMed] [Google Scholar]
- Schutte, K. , Bornschein, J. , Malfertheiner, P. , 2009. Hepatocellular carcinoma-epidemiological trends and risk factors. Dig. Dis.. 27, 80–92. [DOI] [PubMed] [Google Scholar]
- Severi, T. , van Malenstein, H. , Verslype, C. , van Pelt, J.F. , 2010. Tumor initiation and progression in hepatocellular carcinoma: risk factors, classification, and therapeutic targets. Acta Pharmacol. Sin.. 31, 1409–1420. [DOI] [PMC free article] [PubMed] [Google Scholar]
- Sun, S. , Lee, N.P. , Poon, R.T. , Fan, S.T. , He, Q.Y. , Lau, G.K. , Luk, J.M. , 2007. Oncoproteomics of hepatocellular carcinoma: from cancer markers’ discovery to functional pathways. Liver Int.. 27, 1021–1038. [DOI] [PubMed] [Google Scholar]
- Sutphin, P.D. , Giaccia, A.J. , Chan, D.A. , 2007. Energy regulation: HIF MXIes it up with the C-MYC powerhouse. Dev. Cell. 12, 845–846. [DOI] [PubMed] [Google Scholar]
- Szakacs, G. , Annereau, J.P. , Lababidi, S. , Shankavaram, U. , Arciello, A. , Bussey, K.J. , Reinhold, W. , Guo, Y. , Kruh, G.D. , Reimers, M. , Weinstein, J.N. , Gottesman, M.M. , 2004. Predicting drug sensitivity and resistance: profiling ABC transporter genes in cancer cells. Cancer Cell. 6, 129–137. [DOI] [PubMed] [Google Scholar]
- Takuma, Y. , Nouso, K. , 2010. Nonalcoholic steatohepatitis-associated hepatocellular carcinoma: our case series and literature review. World J. Gastroenterol.. 16, 1436–1441. [DOI] [PMC free article] [PubMed] [Google Scholar]
- Thorgeirsson, S.S. , Grisham, J.W. , 2002. Molecular pathogenesis of human hepatocellular carcinoma. Nat. Genet.. 31, 339–346. [DOI] [PubMed] [Google Scholar]
- Thorgeirsson, S.S. , Lee, J.S. , Grisham, J.W. , 2006. Functional genomics of hepatocellular carcinoma. Hepatology. 43, S145–S150. [DOI] [PubMed] [Google Scholar]
- Whittaker, S. , Marais, R. , Zhu, A.X. , 2010. The role of signaling pathways in the development and treatment of hepatocellular carcinoma. Oncogene. 29, 4989–5005. [DOI] [PubMed] [Google Scholar]
- Yasui, K. , Mihara, S. , Zhao, C. , Okamoto, H. , Saito-Ohara, F. , Tomida, A. , Funato, T. , Yokomizo, A. , Naito, S. , Imoto, I. , Tsuruo, T. , Inazawa, J. , 2004. Alteration in copy numbers of genes as a mechanism for acquired drug resistance. Cancer Res.. 64, 1403–1410. [DOI] [PubMed] [Google Scholar]
- Zutz, A. , Gompf, S. , Schagger, H. , Tampe, R. , 2009. Mitochondrial ABC proteins in health and disease. Biochim. Biophys. Acta. 1787, 681–690. [DOI] [PubMed] [Google Scholar]
Associated Data
This section collects any data citations, data availability statements, or supplementary materials included in this article.
Supplementary Materials
The following are the Supplementary data related to this article:
Relative expression of ABCB6 in hepatoma cell lines. (A) Top panel: PCR analysis of ABCB6 mRNA levels in hepatoma cells. ABCB6 expression was measured using gene specific primers. Bottom panel: relative ABCB6 expression normalized to internal reference standard β‐actin. Results representative of four independent experiments.
Relative expression of ABCB6 in hepatoma cell lines.(B) Top panel: immunoblot analysis of ABCB6 expression in hepatoma cells. ABCB6 expression was measured in isolated mitochondria (100 μg) using ABCB6 specific antibody. Results representative of four independent experiments. Bottom panel: relative ABCB6 expression normalized to internal reference control mitochondrial protein porin. The inset depicts the actual difference between Hep3B, HepG2 and primary hepatocytes.
Effect of ABCB6 expression on cellular porphyrin levels. (A) Top panel: steady state porphyrin levels in K562 ABCB6 knockdown and control cells. (A–D) bottom panels: immunoblot analysis of ABCB6 expression in the cells used in these experiments. Cellular PPIX was measured by FACS. ABCB6 expression was measured in isolated mitochondria using anti‐flag antibody. ‘NS’ differences are not significant. ‘*’ Significantly different from control cells. p < 0.01. Columns represent mean ± SD; n = 3 per experiment. Results representative of four independent experiments.
Effect of ABCB6 expression on cellular porphyrin levels. (B) Top panel: steady state porphyrin levels in HEK293 ABCB6 knockdown and control cells. (A–D) bottom panels: immunoblot analysis of ABCB6 expression in the cells used in these experiments. Cellular PPIX was measured by FACS. ABCB6 expression was measured in isolated mitochondria using anti‐flag antibody. ‘NS’ differences are not significant. ‘*’ Significantly different from control cells. p < 0.01. Columns represent mean ± SD; n = 3 per experiment. Results representative of four independent experiments.
Effect of ABCB6 expression on cellular porphyrin levels. (C) Top panel: steady state porphyrin levels in K562 ABCB6 overexpressing and vector control cells. (A–D) bottom panels: immunoblot analysis of ABCB6 expression in the cells used in these experiments. Cellular PPIX was measured by FACS. ABCB6 expression was measured in isolated mitochondria using anti‐flag antibody. ‘NS’ differences are not significant. ‘*’ Significantly different from control cells. p < 0.01. Columns represent mean ± SD; n = 3 per experiment. Results representative of four independent experiments.
Effect of ABCB6 expression on cellular porphyrin levels. (D) Top panel: steady state porphyrin levels in HEK293 ABCB6 overexpressing and vector control cells. (A–D) bottom panels: immunoblot analysis of ABCB6 expression in the cells used in these experiments. Cellular PPIX was measured by FACS. ABCB6 expression was measured in isolated mitochondria using anti‐flag antibody. ‘NS’ differences are not significant. ‘*’ Significantly different from control cells. p < 0.01. Columns represent mean ± SD; n = 3 per experiment. Results representative of four independent experiments.
Effect of blocking porphyrin biosynthesis on colony forming ability of Huh7 and HEK293 cells. (A) colony forming ability of Huh7. Results representative of four independent experiments.
Effect of blocking porphyrin biosynthesis on colony forming ability of Huh7 and HEK293 cells. (B) colony forming ability of HEK293 cells in the presence and absence of SA. Results representative of four independent experiments.
Cellular porphyrin levels in Huh7 and K562 cells in the presence and absence of SA. (A) Mean PPIX levels in Huh7 vector control and Huh7 ABCB6 overexpressing cells in the presence and absence of SA. Cells were pretreated with SA for 48 h and PPIX levels were measured every 24 h for a total of 120 h. Data represent PPIX levels measured at 120 h at which time point maximum differences in growth and proliferation was observed in the corresponding experiments presented in Figure 6. Results representative of four independent experiments. ‘*’ Significantly different from vector control cells in the absence of SA; ‘#’ Significantly different from vector control and ABCB6 overexpressing cells treated with SA.
Cellular porphyrin levels in Huh7 and K562 cells in the presence and absence of SA. (B) Mean PPIX levels in K562 vector control and K562 ABCB6 overexpressing cells in the presence and absence of SA. Cells were pretreated with SA for 48 h and PPIX levels were measured every 24 h for a total of 120 h. Data represent PPIX levels measured at 120 h at which time point maximum differences in growth and proliferation was observed in the corresponding experiments presented in Figure 6. Results representative of four independent experiments. ‘*’ Significantly different from vector control cells in the absence of SA; ‘#’ Significantly different from vector control and ABCB6 overexpressing cells treated with SA.