

Abstract
This unit describes how to use gene finding programs GeneMark.hmm-E and GeneMark-ES for finding protein-coding genes in genomic DNA of eukaryotic genomes. These bioinformatics tools were demonstrated to have state-of-the-art accuracy for many fungal, plant and animal genomes and have been frequently used for gene annotation in novel genomic sequences. Additional advantage of GeneMark-ES is that the problem of algorithm parameterization is solved automatically, with parameters estimated by iterative self-training (unsupervised training).
Keywords: Gene finding, Hidden Markov model, unsupervised parameter estimation
Unit Title and Unit Introduction
In this unit we describe eukaryotic gene finding tools GeneMark-E (Borodovsky and McIninch, unpublished), GeneMark.hmm-E (Lukashin and Borodovsky, unpublished) and GeneMark-ES (Lomsadze et al., 2005; Ter-Hovhannisyan et al., 2008). The GeneMark.hmm-E algorithm uses Markov models (of up to 5th order) of protein coding and noncoding sequences, as well as positional zero and first order Markov models of the splice sites and the sites of initiation and termination of translation. All these models, along with length distributions of exons, introns, and intergenic regions are assumed to have known parameters. These models of elements of gene structure are integrated into a generalized hidden Markov model (Appendix 3). The algorithm implemented in GeneMark.hmm-E finds the maximum likelihood path through hidden states given the analyzed sequence. Notably, the latest version of GeneMark.hmm-E used in GeneMark-ES (Ter-Hovhannisyan et al., 2008) has an additional model for the branch point site useful for accurate gene prediction in fungal genomes.
The set of genome specific parameters necessary for GeneMark.hmm-E algorithm (Basic Protocol 1) could be estimated from training sets, derived from experimentally or computationally (using cDNA data) validated gene structures or by a self-training procedure provided by GeneMark-ES. Availability of self-training option is an important feature since large manually annotated and curated sets of sequences are not readily available for a new genome.
The GeneMark program (Borodovsky and McIninch, 1993; see UNIT 4.5) can provide useful information for analysis of eukaryotic genomes as well. GeneMark version for eukaryotic genomes could be called GeneMark-E, this version can be run via the web in parallel with GeneMark.hmm-E http://opal.biology.gatech.edu/GeneMark/eukhmm.cgi. GeneMark-E uses a set of models of protein-coding and non-coding regions of the eukaryotic genome in question and generates a list of predicted exons as well as an informative graph (PDF format) of a distribution of coding potentials. Still, GeneMark-E is not as accurate in predicting exon boundaries as GeneMark.hmm-E.
Local versions of the software to be run under the Unix operating system are available (see Alternate Protocol 1).
GeneMark-ES requires significantly more resources than GeneMark-E and GeneMark.hmm-E. The resource requirement makes running GeneMark-ES for multiple remote users too expensive for a single server situated at Georgia Tech. Use of the local version of GeneMark-ES program under UNIX operating system is described in Basic Protocol 2.
Basic Protocol 1
USING GeneMark.hmm FOR EUKARYOTIC GENE PREDICTION VIA WEB INTERFACE
The program is accessible via web server at the Georgia Institute of Technology at http://topaz.gatech.edu/eukhmm.cgi. The web interface for the Eukaryotic GeneMark.hmm program is shown in Figure 1. Gene predictions are reported as a list of exon coordinates (Fig. 2). Optionally, graphical output and a list of predicted protein sequences can be produced.
Figure 1.
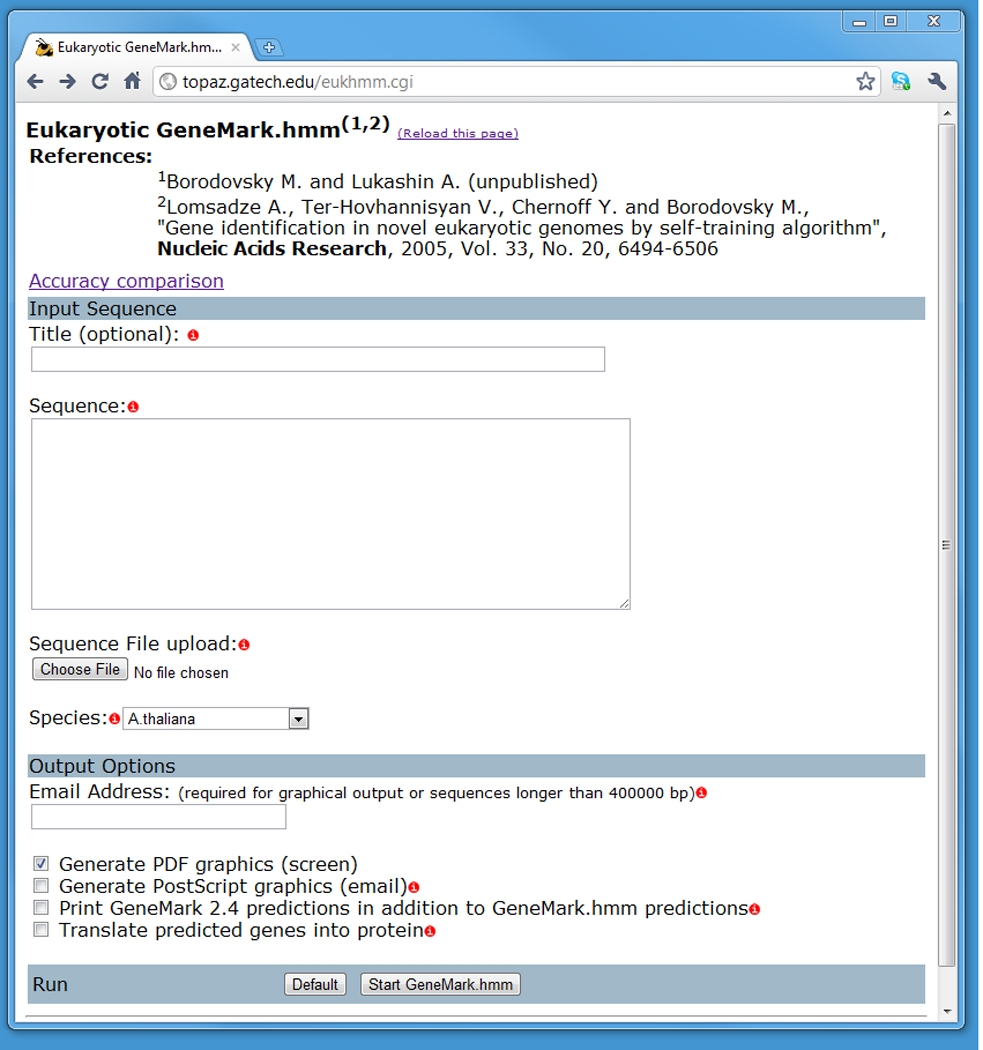
The user interface for the eukaryotic GeneMark.hmm program. Required input includes a DNA sequence in FASTA format, either copied and pasted into the Sequence text box, or uploaded from one’s local drive using the Browse button next to the Sequence File Upload box.
Figure 2.
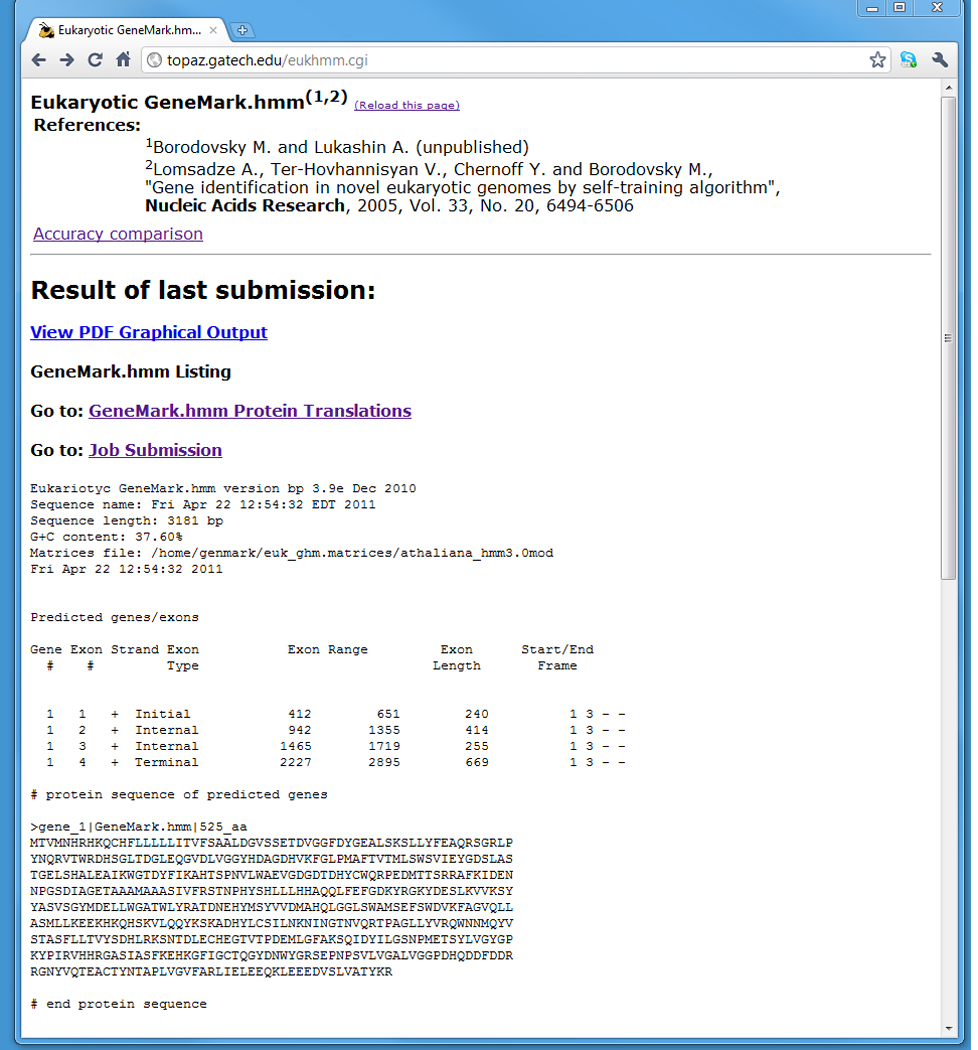
The text output for the Eukaryotic GeneMark.hmm program.
Necessary Resources
Hardware
A personal computer or workstation with Web access
Software
A Web browser
Files
A single sequence in FASTA format. The sample sequence (example2.fna, gene AtGH9B8 from Arabidopsis Thaliana genome) used to illustrate this protocol can be downloaded from the Current Protocols Web site (http://www3.interscience.wiley.com/c_p/cpbi_sampledatafiles.htm).
- Sequence pre-processing before gene finding is recommended but not required. Pre-processing steps may include:
- masking of TE related repeats
- splitting sequence into compositionally homogeneous regions
-
Via a Web browser, connect to http://topaz.gatech.edu/eukhmm.cgi (Fig 1). In the Input Sequence section, paste an input sequence into the Sequence box area, or, alternatively, click on Browse next to the Sequence File Upload box to upload the input sequence file from a local hard drive.
The Sequence File Upload option is more practical, since the copy and paste method has a restriction on the sequence length. All non-alphabetical symbols in the sequence are ignored and all ambiguous letters are replaced with letter “N”. To decrease the error rate due to the edge effects due to missing sequence context we recommend extending the sequence of interest in 5’ and 3’ directions (up to 2 kb).
Scroll down the page and select the name of the species of interest from the Species pull-down menu (Fig. 1). Choosing the correct model is essential; a wrong gene model is likely to corrupt the algorithm execution and produce wrong gene predictions.
Scroll further down the page and set the Output Options (Fig. 1). By default, the program generates a list of predicted exons for each predicted gene. The user has the option of choosing graphical output in PDF or PostScript Graphics format, a report of GeneMark-E predictions (by checking Print GeneMark 2.4 Predictions…), or additional list of the protein translations of the predicted genes (by checking Translate Predicted Genes into Proteins).
Click the Start GeneMark.hmm button to start running the program. The result will be displayed on the screen. If the user supplied an E-mail address, the file with results will be E-mailed to the user from genemark@topaz.gatech.edu
-
Interpretation of the text output.
The eukaryotic GeneMark.hmm text output (Fig.2) contains a list of sequence coordinates of predicted genes/exons. The program identifies both complete and partial genes; however incomplete exons are not reported. A gene identified by the gene number in the first column may have one or more exons listed in separate lines and identified by the exon number in the second column. In the third column, exons predicted in the direct strand are indicated with a “+” sign while those predicted in the reverse strand are labeled with a minus sign (“−”). For predicted genes with multiple exons, the Exon Type column contains Initial, Internal, or Terminal descriptions of the type of predicted exon. For single-exon genes, Exon Type is Single. Start and end positions of each exon are given in the Exon range columns. The Start/End Frame columns specify the codon positions of the first and the last nucleotide of an exon. If the” Translate Predicted Genes into Proteins” box was checked, the sequences of predicted proteins, in FASTA format, will be displayed below the list of predicted genes and exons (Fig. 2).
-
Interpretation of the graphical output.
The GeneMark.hmm-E graphical output is always combined with the GeneMark graphical output (see UNIT 4.5; GeneMark Basic protocol 3). Graphical output in the PostScript or PDF format is generated by the GeneMark-E program using genome specific parameters. The GeneMark-E graphical output (Fig. 3) visualizes protein coding potential and is particularly useful for manual detection of regions with high coding potential.
Figure 3 depicts the coding potential in the six possible reading frames. An unbroken horizontal line at the 0.5 level indicates an open reading frame (ORF). Vertical ticks directed downward from the 0.5 line represent one of the three stop codons, TAA, TGA, or TAG. The gray horizontal bars indicate regions with higher than expected coding potential predicted by GeneMark-E. The “<” and “>” marks represent, acceptor and donor splice sites, respectively, at the border of a region with high coding potential. The thick black horizontal bars at the bottom of each panel indicate locations of exons predicted by GeneMark.hmm-E. One can see in Fig. 3 a reasonable correlation between exon predictions by GeneMark.hmm-E and regions of high coding potential depicted by the GeneMark-E graphs.
Figure 3.
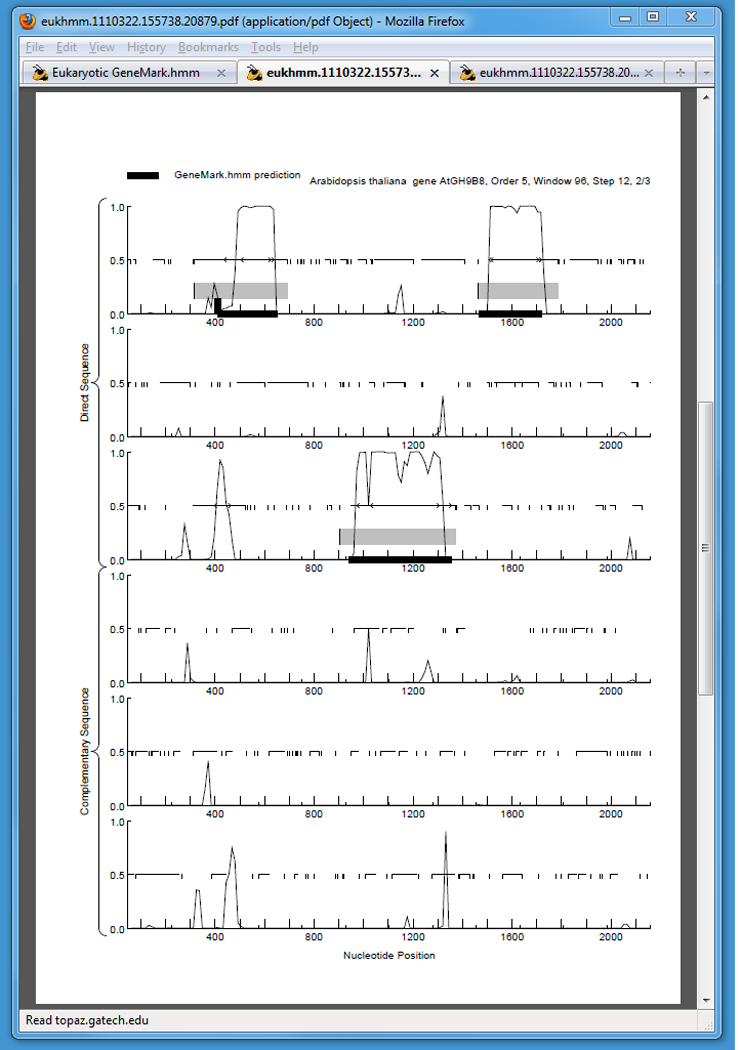
The graphical output from the Eukaryotic GeneMark.hmm program for a region of the example sequence. The six different panels represent the six possible reading frames, three each on the direct and reverse strands.
ALTERNATE PROTOCOL 1
USING UNIX version of GeneMark.hmm-E
This protocol describes application of the stand-alone GeneMark.hmm-E for gene prediction in eukaryotic genomes.
Necessary Resources
Hardware
Unix workstation with Linux, Sun Solaris, DEC Unix, SGI Irix, or IBM AIX operating system
Software
Standalone Unix distribution (topaz.gatech.edu/GeneMark/) includes two version of GeneMark.hmm-E (versions 2 and 3) and the set of species specific parameter files. File name specifies the organism and file extension reflects the version of GeneMark.hmm-E. Extension “*.mod” is for version 3 of GeneMark.hmm-E and “*.tmx” for version 2 GeneMark.hmm-E. The models are version specific; the best performing parameters files are included in the distribution.
Files
Input sequence file in FASTA format.
-
From the Unix command line run GeneMark.hmm-E (program name gmhmme2 or gmhmme3):
- %gmhmme3 –m <matrix file> -o <output file> <DNA file>
The program requires at least two parameters: the name of DNA sequence file and the name of a matrix file supplied after the “-m” option. The latter contains parameters of statistical models for DNA sequence analysis, generated from a training set of reliably annotated sequences from a particular species. The matrix species name must match the species name of the DNA sequence origin. The output is saved in a file named after DNA sequence file with addition of the .lst extension. Option -o allows users to specify the output file name different from the default name, e.g.:- %gmhmme –m athaliana.mod -o example.lst example.fna
-
Additional optional parameters are available for formatting the output information
-p write protein translation
-n write nucleotide sequence
-f <format> output prediction in [lst|gff3|gtf] format; default [lst]
-
Interpretation of the results.
Output of the GeneMark.hmm-E local version has the same format as the output of web version (see Basic Protocol 1).
Basic Protocol 2
USING GeneMark-ES FOR EUKARYOTIC GENE PREDICTION
This protocol describes application of the GeneMark-ES algorithm for gene prediction in an anonymous eukaryotic genome. This program performs self-training on anonymous input sequence, thus, generating estimation of species specific parameters of the HMM model, at a final step it generates gene predictions by GeneMark.hmm-E based on the derived model. Program is available for download from http://topaz.gatech.edu/GeneMark.
Necessary Resources
Hardware
Unix workstation with Linux, Sun Solaris, DEC Unix, SGI Irix, or IBM AIX operating system.
Software
Standalone pre-compiled Unix distribution (topaz.gatech.edu/GeneMark/) may be installed at any location; there is no need for configuration of GeeneMark-ES package.
Files
File with sequence in FASTA format. GeneMark-ES is genome level annotation tool, therefore large amount of input sequence is preferable.
-
Create current working directory
prompt> mkdir test
prompt> cd test
Pre-processing of input sequence is recommended but not required. Masking of TE repeats (see UNIT X) is critical in genomes with large repeat density.
-
From the Unix command line run GeneMark-ES
prompt> nohup path_to/gm_es.pl puth_to/sequence_filename > logfile &
Program will be executed in the background mode. File “logfile” is created with information about self-training process. The program will create a large number of temporary directories and files. Large amount of memory and HD space is recommended; e.g. with 20 Mb input 500 Mb of free space is used by single run of software. Running time depends on amount and quality of input and can take several hours.
-
Optional parameters:
--BP OFF
Switches off the branch point submodel and is recommended for genomes with weak branch points, like most plants, worms, etc. For fungi genomes the –BP ON option is highly recommended.
--max_nnn [number]
Supercontigs used in self-training are frequently formed from contigs by filling the gaps with strings of unknown letters "NN…N". Incomplete genes are allowed only at the beginning and the end of the sequence in GeneMark.hmm-E (gmhmme3). Parameter L = --max_nnn [number] defines the minimal length of a string NN…N at which sequence is broken at the gap and, therefore, incomplete genes could be predicted in proximity of such "NN…N" gap filler. If NN…N length is less than L, the predicted gene will not be broken by a gap. Default value of L is 49;upper recommended value is 5000 nt.
In more details the sequence of steps is as follows: the self-training algorithm GeneMark-ES (gm_es.pl):- splits input sequence at "NN…N" strings with length longer than L;
- runs gene finding algorithm GeneMark.hmm-E with current parameters on the contigs;
- maps back predictions to original super-contig sequence.
Note that a large number of contigs resulted from NN…N splitting (for a small value of L) may have negative effect on self-training procedure.
It is hard to recommend the best value for L since different assembly groups use different length for "NN…N" gap fillers.
--min_contig [number]
Short contigs, which are frequently found in draft assemblies, may introduce significant noise in self-training procedure. All contigs shorter then "min_contig" are excluded from training procedure.
The default value is 20,000 nt. Still, for some draft assemblies the default value may be too restrictive, excluding too much of the sequence from training. In such cases training with 10,000 nt may improve prediction quality
Note that the final gene prediction is performed on complete input sequence including contigs shorter than min_contig [number].
--max_contig [number]
Sequences longer then "max_contig" are split into shorter ones to avoid running out of memory.
The default value is 10,000,000 nt.
-
Interpretation of the results.
Output standard GFF formatfile has a name “genemark_hmm.gff”. In the final round of running the algorithm GeneMark-ES gene predictions are made by GeneMark.hmm-E; a description of the output is given in Basic Protocol 1.
If at the end of program execution output "genemark_hmm.gtf" was not created or is empty, it means that program failed during iterations; please consider sending the "logfile" to developers for error diagnostic.
GUIDELINES FOR UNDERSTANDING RESULTS
Gene prediction algorithms GeneMark.hmm-E or GeneMark-ES generate coordinates of the protein coding genes predicted in the input genomic sequence: i.e. coordinates of exons (CDS), and complete structure of the CDS of a gene (multi exon genes) with indication of the exon type.
COMMENTARY
Background Information
GeneMark.hmm-E
The GeneMark.hmm algorithm (Lukashin and Borodovsky, 1998; M. Borodovsky and A.V. Lukashin, unpublished) was designed to improve gene-prediction quality in terms of finding exact exon/intron and gene boundaries. The earlier developed program GeneMark (Borodovsky and McIninch, 1993) identified a gene mainly as the open reading frame where the gene resides; this assignment was largely sufficient for prokaryotic genes. The underlying idea of GeneMark.hmm was to embed the GeneMark models for protein-coding (exons) and non-coding (intron and intergenic) regions into a naturally derived hidden Markov model (HMM) framework with exon/intron boundaries modeled as transitions between hidden states.
The HMM framework of GeneMark.hmm, the logic of transitions between hidden Markov states, followed the logic of the genetic structure of eukaryotic genome (see Appendix 3 for primer on HMM). The Markov models of coding and non-coding regions were incorporated into the HMM framework to emit stretches of DNA sequence with coding or noncoding statistical patterns. This type of HMM architecture is known as generalized HMM or “HMM with duration” (Rabiner, 1989). The sequence of hidden states associated with a given DNA sequence carries information on positions where coding region is switching into noncoding and vice versa. The sequence of hidden states constitutes the HMM trajectory. The core GeneMark.hmm procedure, the Viterbi type algorithm (Rabiner, 1989), finds the most likely HMM trajectory given the DNA sequence. To further improve prediction of the exons, models of the translation start, translation end, acceptor and donor were derived.
Parameter estimation using training sets
In case of supervised training the species specific parameters of HMM are derived using maximum likelihood estimation from the set of verified gene structures. In case of homogeneous genomes roughly one thousand genes should be in the training set. Usually such verified gene structures could be generated based on alignment of complete cDNA sequences to genomic DNA (to determine the exon/intron structure of genes) and similarity search to databases of known proteins (to determine location of CDS in cDNA sequence). This process requires additional sequencing in form of cDNA or even bigger set of EST data. With advent of RNA-seq technology the training set could be derived based on RNA-seq data.
GeneMark-ES
A GeneMark-ES algorithm (Lomsadze at al. 2005) was developed to address the problem of gene prediction in eukaryotes in the absence of training data. Heuristic method (BP unit 4.5) is used to initialize this algorithm; the estimation of parameters is performed iteratively. Several dynamically changing restrictions are applied to the range of model parameters, to keep model from diverging away from biologically relevant points in parameter space. Iterations are stopped, when convergence criteria are reached, the final set of protein coding genes is predicted by GeneMark.hmm-E using parameters derived from unsupervised training. GeneMark-ES algorithm (Ter-Hovhannisyan at al. 2008) was further extended with development of the extended Intron/Branch Point model, a new part of the HMM architecture, to better reflect the gene organization of fungal genomes.
Critical Parameters and Troubleshooting
GeneMark-ES is designed to automatically adjust to the species specific composition of a genome. The algorithm needs only genomic DNA as an input. The most frequent problem arises if the quality of the input sequence is poor due to the assembly problems related to insufficient sequence material. Only long contigs without gaps are used in self-training parameter estimation procedure. The default value of minimum contig length is set to 20k nt. Even with such relatively relaxed parameter setting the amount of sequence in a draft genome assembly could be critically low. Users can further relax the sequence fragmentation parameter from the default to “--min_contig 8000; –max_nnn 5000”; this option will allow generation of “preliminary” protein coding gene models. The improvement in sequence assembly is the most efficient way to improve the quality of gene prediction.
Transposable elements (TE) in some genomes occupy a significant portion of the genomic DNA. Masking of repeats before the training and prediction may be critical.
Suggestions for Further Analysis
The protein translations of predicted genes can be further analyzed by BLASTP (Altschul et al., 1990; UNIT 3.3) to make functional prediction for the newly predicted genes. Experimental biologists could use the sequences around the predicted exons and genes to create primers for PCR (RT-PCR) analysis of expression of genes of interest as well as to design oligonucleotides representing protein-coding regions for DNA expression arrays.
Footnotes
Internet Resources
Contributor Information
Mark Borodovsky, Department of Biomedical Engineering and School of Computational Science and Engineering, Georgia Institute of Technology, Atlanta, Georgia, Phone: 404-894-8432, Fax: 404-385-0383, borodovsky@gatech.edu.
Alex Lomsadze, Department of Biomedical Engineering, Georgia Institute of Technology, Atlanta, Georgia, Phone: +1 404-385-2020, alexl@gatech.edu.
Literature Cited
- Altschul SF, Gish W, et al. Basic local alignment search tool. J. Mol. Biol. 1990;215:403–410. doi: 10.1016/S0022-2836(05)80360-2. [DOI] [PubMed] [Google Scholar]
- Besemer J, Lomsadze A, Borodovsky M. GeneMarkS: A self-training method for prediction of gene starts in microbial genomes: Implications for finding sequence motifs in regulatory regions. Nucleic Acids Res. 2001;29:2607–2618. doi: 10.1093/nar/29.12.2607. [DOI] [PMC free article] [PubMed] [Google Scholar]
- Borodovsky M, McIninch J. GeneMark: Parallel gene recognition for both DNA strands. Comput. Chem. 1993;17:123–133. [Google Scholar]
- Lukashin AV, Borodovsky M. GeneMark.hmm: New solutions for gene finding. Nucleic Acids Res. 1998;26:1107–1115. doi: 10.1093/nar/26.4.1107. [DOI] [PMC free article] [PubMed] [Google Scholar]
- Lomsadze A, Ter-Hovhannisyan V, Chernoff Y, Borodovsky M. Gene identification in novel eukaryotic genomes by self-training algorithm. Nucleic Acids Research. 2005;Vol. 33(No. 20):6494–6506. doi: 10.1093/nar/gki937. [DOI] [PMC free article] [PubMed] [Google Scholar]
- Pearson WR. Rapid and sensitive sequence comparison with FASTP and FASTA. Methods Enzymol. 1990;183:63–98. doi: 10.1016/0076-6879(90)83007-v. [DOI] [PubMed] [Google Scholar]
- Rabiner LR. A tutorial on hidden Markov models and selected applications in speech recognition. Proceedings of the I.E.E.E. 1989;77:257–286. [Google Scholar]
- Ter-Hovhannisyan V, Lomsadze A, Chernoff Y, Borodovsky M. Gene prediction in novel fungal genomes using an ab initio algorithm with unsupervised training. Genome Research. 2008 Dec;18(12):1979–1990. doi: 10.1101/gr.081612.108. [DOI] [PMC free article] [PubMed] [Google Scholar]