

Abstract
In dog submandibular gland, the activity of myoepithelial cells was assessed by simultaneous measurement of intraductal pressure (Pdu) and subcapsular pressure (Pca) using catheter-tip pressure transducers; their resting values were 2.5 ± 0.21 and 3.0 ± 0.19 mmHg, respectively (n = 40). Retrograde infusion of saliva (collected from preceding parasympathetic nerve stimulation) increased Pdu (coefficient of 50 mmHg ml−1 for rates < 1 ml min−1 and 85 mmHg ml−1 for higher rates) and Pca (coefficient of 0.47 mmHg ml−1 for all rates). Blood flow changes did not affect Pdu but increased Pca (coefficient of 0.04 mmHg ml−1). Parasympathetic nerve stimulation increased Pdu but decreased Pcai> abruptly; the response threshold was 0.1 Hz, with maximal responses at 16 Hz. The coefficients for Pdu and Pca on salivary secretion to parasympathetic nerve stimulation in glands with spontaneous blood flow (5.3 × 10⁻³ and 4.87 × 10⁻² ml min−1 g−1 mmHg−1) were close to their values in glands with constant-flow vascular perfusion (4.9 × 10⁻³ and 3.68 × 10⁻² ml min−1 g−1 mmHg−1). The finding that Pca fell despite concomitant increased blood flow suggests contraction of myoepithelial cells. Additional ductal occlusion further increased Pdu and enhanced the fall in Pca, suggesting that the myoepithelial cells can contract when distended. Atropine blocked salivary secretion and responses of Pdu and Pca to parasympathetic nerve stimulation. ACh elicited responses similar to that of parasympathetic nerve stimulation. VIP caused very scanty salivary secretion and gradual slight increases in Pdu and Pca; the change in Pca was abolished in glands with constant-flow vascular perfusion. Hence, contraction of myoepithelial cells to parasympathetic nerve stimulation is via muscarinic receptors. Sympathetic nerve stimulation increased Pdu and decreased Pca abruptly; the response threshold was 0.1 Hz, with maximal responses at 16 Hz. The coefficients for Pdu and Pca on salivary secretion to sympathetic nerve stimulation in glands with spontaneous blood flow (3.0 × 10⁻³ and 3.2 × 10⁻³ ml min−1 g−1 mmHg−1) were similar to their values in glands with constant-flow vascular perfusion (3.2 × 10⁻³ and 3.1 × 10⁻³ ml min−1 g−1 mmHg−1). The finding that Pca fell even in glands with constant-flow vascular perfusion suggests contraction of myoepithelial cells. Superimposed sympathetic nerve stimulation immediately enhanced the pressure changes and secretory response to parasympathetic nerve stimulation, indicating that the two autonomic nerves act synergistically to evoke myoepithelial cell contraction. Phentolamine and prazosin but not propranolol and yohimbine blocked the sympathetic enhancement. The finding that phenylephrine, but not clonidine and isoproterenol, abruptly decreased Pca in glands with constant-flow vascular perfusion suggests that the sympathetic activation of myoepithelial cells is via the α1-adrenoceptors.
In salivary glands, star-shaped myoepithelial cells are commonly found in the basal layer of the acini and intercalated ducts. Electron microscopic and immuno-histochemical studies have shown that the myoepithelial cells contain cytoplasmic fibrils, which are characteristic of smooth muscle cells (Archer & Kao, 1968; Tandler, 1987; Norberg et al. 1992). Attempts were made to study the response of the myoepithelial cells of various salivary glands to autonomic nerve stimulation in experimental animals (Emmelin et al. 1968, 1969a). The pressure of a closed ductal system was monitored, an increase in pressure reflecting contraction of the myoepithelial cells. Single shocks or stimulation frequencies, which did not induce overt fluid secretion in an open ductal system, were tested. Results from stimulation beyond the secretory threshold were inconclusive, as both myoepithelial effect and secretion contributed to the pressure changes. To date, the response of the myoepithelial cells to autonomic nerve stimulation that induces apparent fluid secretion has never been studied.
Like human parotid and submandibular glands, the dog submandibular gland is encapsulated (Miller et al. 1965; Tandler, 1987; Martinez-Madrigal & Micheau, 1989). When myoepithelial cells embracing the acini and the intercalated ducts contract, the underlying parenchyma will be squeezed. Since the lobules are fitted together compactly with little connective tissue between them, the whole gland will be pulled away from the capsule, resulting in not only an increase in the intraductal pressure but also a decrease in pressure in the subcapsular region. The activity of the myoepithelial cells can thus be assessed by simultaneously monitoring the pressure changes in the ductal system and in the subcapsular region. A novel method to measure these two pressures was established in the dog submandibular gland, to investigate, for the first time, the function of the myoepithelial cells during active secretion without interruption of salivary flow. This study examined the response of the myoepithelial cells to parasympathetic and sympathetic nerve stimulation over a wide range of stimulation frequency. The receptors responsible for mediating the responses were characterized with the use of various autonomic receptor blockades and mimetic agents. Some of the results have been presented in an abstract (Lung, 1994a).
METHODS
The Committee on the Use of Live Animal for Teaching and Research of The University of Hong Kong approved the study. Mongrel dogs (17–20 kg in weight, n = 40) were anaesthetized with sodium pentobarbital (30 mg kg−1, I.V.); supplementary doses (10 mg kg−1 h−1) were given when necessary. Body temperature (rectal) was maintained at 37°C by means of an electric heating pad placed underneath the animal. Systemic arterial pressure was measured from the femoral artery. Heparin (2000 U, I.V.) was introduced before connecting to the perfusion system and doses of 1000 U h−1 were given thereafter (Lung, 1998). At the end of experiments, the animals were killed by an overdose of sodium pentobarbital (250 mg kg−1).
Measurement of submandibular arterial flow
To determine submandibular arterial flow, an ultrasonic flow sensor (2S, Transonic Systems, Inc., NY, USA) was placed around the facial artery, just proximal to the origin of the glandular artery, the main blood supply to the submandibular gland. The facial artery, just distal to the origin of the glandular artery, was retrogradelycannulated for drug injection (Lung, 1998).
Vascular perfusion of submandibular gland
The glandular artery was perfused with blood from a reservoir that was continuously replenished from a femoral artery. Perfusion rate was normally adjusted to give a perfusion pressure approximating the systemic arterial pressure (Lung, 1990; Fig. 1A).
Figure 1. Method of vascular perfusion of the submandibular gland and measurement of salivary flow ( ), intraductal pressure (Pdu) and subcapsular pressure (Pca) (A) and diagram showing the placement of the catheter-tip pressure transducer for measuring Pca (B).
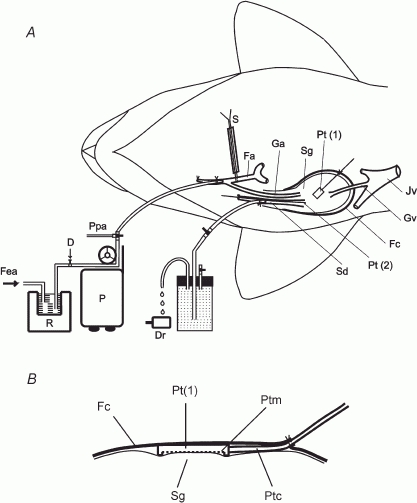
Sg, submandibular gland; Sd, submandibular duct; Fc, fibrous capsule; Dr, drop-counter; Fa, facial artery; Ga, glandular artery; Jv, jugular vein; Gv, glandular vein; Pt(1), catheter-tip pressure transducer for measuring Pca; Pt(2), catheter-tip pressure transducer for measuring Pdu; S, snare; Ppa, glandular arterial perfusion pressure; P, peristaltic pump; R, blood reservoir maintained at 37°C; Fea, connection to femoral artery; D, site of drug administration; Ptm, membrane sensor; Ptc, cable of the transducer.
Measurement of salivary secretion
The submandibular duct was retrogradely cannulated and the catheter was connected to a bottle in which the secreted saliva displaced a saline solution. Drops of saline, 0.025 ml in volume, displaced from the bottle were measured by means of a drop-counter (92-100-70, E & M Instrument Co. Inc., TX, USA); salivary flow () was calculated from the time interval between falling drops (Lung, 1990; Fig. 1A).
Measurement of intraductal pressure (Pdu) and subcapsular pressure (Pca)
To measure Pdu, an ultra-miniature catheter-tip pressure transducer (0.67 mm o.d.; model SPR-407, Millar Instruments Inc., TX, USA) was inserted retrogradely into the main excretory duct (2–2.5 mm o.d.) up to the hilum of the gland (Fig. 1A). The position of the transducer was checked with postmortem examination. To measure Pca, the fibrous capsule on the superficial surface of the gland was incised. A catheter-tip pressure transducer (1 cm long, 0.6 cm wide and 0.2 cm thick; model ICT/b, Medical Measurements Inc., NJ, USA) was inserted underneath the capsule with the membrane of the transducer abutting the surface of underlying parenchyma (Fig. 1B). The capsule was sutured. A slight tapping on the surface of the capsule and confirming that the pressure was abruptly increased and maintained checked the tightness of the suture.
Parasympathetic and sympathetic nerve stimulation
Parasympathetic and sympathetic nerves were stimulated as previously described (Lung, 1990). Stimulation was made with varying frequency at fixed supramaximal voltage (5 V for parasympathetic nerve and 20 V for sympathetic nerve) and pulse duration of 1 ms, according to the experimental protocol.
Drugs
Drugs, dissolved in saline solution, were given intra-arterially. Cholinergic receptor blockade was induced with atropine sulphate (E. Merck, Darmstadt, Germany) while β-, α-, α1- and α2-adrenergic receptor blockade was induced with propranolol hydrochloride (Sigma Chemical Co., St Louis, MO, USA), phentolamine hydrochloride (Ciba-Geigy Ltd, Basle, Switzerland), prazosin hydrochloride (Pfizer Corp., Brussels, Belgium) and yohimbine hydrochloride (Sigma), respectively. The adequacy of each individual receptor blockade was confirmed by the abolition of the response to the corresponding receptor agonist. Identical volumes of the drug vehicle had no effect on any measured variable.
Experimental protocol
During salivation, myoepithelial activity and the volume of saliva inside the ductal system influence Pdu. To investigate how the volume of saliva inside the ductal system affects Pdu and Pca, saliva that was collected from previous parasympathetic nerve stimulation was retrogradely infused into the ductal system (n = 4). The infusion rate was the average rate of salivary flow at the level of parasympathetic nerve stimulation when the saliva was collected. Infusion was given for 1 min. Both Pdu and Pca were continuously recorded during infusion.
During salivation, glandular shrinkage and changes in blood flow occur. To investigate how blood flow affects Pca and Pdu, glands were perfused at various rates (n = 4). Each perfusion rate was given for 1 min. Both Pca and Pdu were continuously recorded during perfusion.
Parasympathetic and sympathetic nerves were stimulated in glands receiving spontaneous blood flow (n = 8) or constant-flow vascular perfusion at normal rate (n = 8). Blood flow (or vascular perfusion pressure), Pdu, Pca and salivary secretion were recorded continuously during stimulation. The steady state response of all measured variables was achieved within 30 s. Stimulation was given for 1 min, always after complete recovery from the effects of previous stimulation. The actions of autonomic mimetics (ACh, VIP, phenylephrine, clonidine and isoproterenol; Sigma) were studied. The agonist was given singly in bolus, always after complete recovery from the effects of previous injection. The peak response of all measured variables was recorded. Ductal occlusion during parasympathetic nerve stimulation was performed in glands with constant-flow vascular perfusion (n = 4). Parasympathetic nerve stimulation was performed in atropinized glands with spontaneous blood flow (n = 4) or constant-flow vascular perfusion (n = 4).
Superimposed sympathetic nerve stimulation (20 Hz, 1–2 min) initially enhances but later diminishes parasympathetic nerve-induced salivation (Lung, 1994b). To investigate if myoepithelial cells are involved in the sympathetic effects, the action of superimposed sympathetic nerve stimulation on parasympathetic nerve-induced changes in salivary secretion, Pdu and Pca, were studied in glands with constant-flow vascular perfusion (n = 8).
Sympathetic nerve stimulation (at 20 Hz) was given 1 min after the onset of parasympathetic nerve stimulation for 1–3 min. To characterize the postsynaptic receptor(s) responsible for the sympathetic responses, individual receptor (β-adrenoceptor, α-adrenoceptor and its subtypes) blockade (n = 8) was induced 5 min before parasympathetic nerve stimulation.
Data recording and analysis
Recording of pressure and flow variables and calibration of their sensors were performed as described (Lung, 1998). The results are displayed as means ± S.E.M. ANOVA followed by Student's t test for paired or unpaired data were used to determine the statistical difference between two means. For multiple comparisons, Student-Newman-Keuls method was used. Correlation was calculated by linear regression. A value of P < 0.05 indicated a significant difference.
RESULTS
Under resting conditions, the average Pdu and Pca were 2.5 ± 0.21 and 3.0 ± 0.19 mmHg,respectively (n = 40).
Effects of changes in the volume of saliva inside the ductal system
Figure 2 shows the response of Pdu and Pca at 1 min to retrograde infusion of saliva into resting glands. For rates (0.2–1 ml min−1) equivalent to salivary secretion at a low to moderate level of stimulation (1–4 Hz), the response coefficient of Pdu was 50 mmHg ml−1 (r = 0.99, P < 0.001). For rates (1–2 ml min−1) equivalent to salivary secretion at a moderate to high level of stimulation (4–16 Hz), the response coefficient of Pdu was 85 mmHg ml−1 (r = 0.99, P < 0.001). As for Pca, the response coefficient to all rates was 0.47 mmHg ml−1 (r = 0.99, P < 0.001).
Figure 2. The effects of retrograde infusion of saliva on Pdu (•) and Pca (▪) in glands with a closed ductal system at rest.
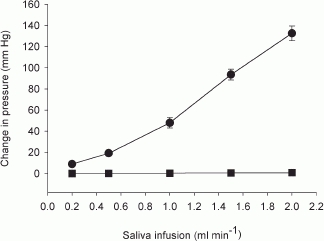
n = 4.
Effects of changes in blood flow
Figure 3 shows the response of Pca and Pdu at 1 min to changes in blood flow in glands at rest. The response coefficient of Pca to changes in blood flow (0–20 ml min−1) was 0.04 mmHg ml−1 (r = 0.99, P < 0.001). Changes in blood flow did not affect Pdu.
Figure 3. The effects of changes in blood flow on Pdu (•) and Pca (▪) in glands at rest.
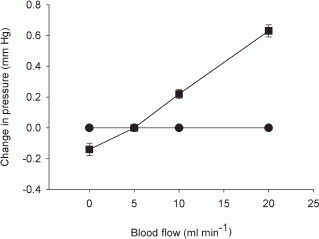
n = 4.
Effects of parasympathetic nerve stimulation
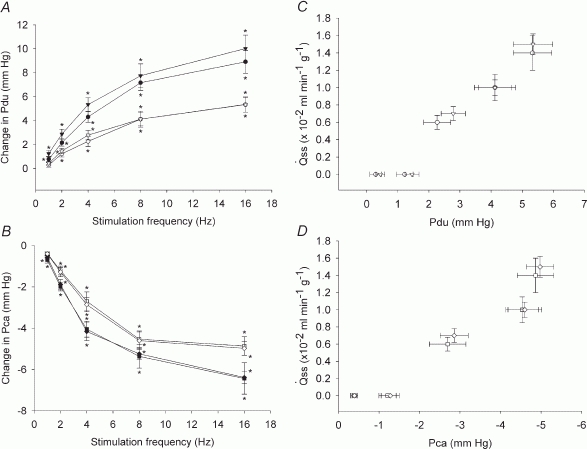
With parasympathetic nerve stimulation, the response threshold for both Pdu and Pca was 0.1 Hz; maximal response of both pressures occurred at 8–16 Hz. Whether the gland received spontaneous blood flow or constant-flow vascular perfusion, both pressures changed immediately, reaching peak value within 2–4 s, and then declined to a steady level within 30 s (Fig. 4A and B). The time to reach the peak response for both pressures was inversely proportional to the stimulation frequency, 1–2 s for 8–16 Hz and 3–4 s for 1–4 Hz stimulation (Fig. 4A and B). As with salivary secretion, the magnitudes of the peak and steady state responses of both pressures were in direct proportion to the stimulation frequency (Fig. 5 A and B). Salivary secretion, Pdu and Pca were highly correlated whether the gland received spontaneous blood flow or constant-flow vascular perfusion (Fig. 5C and D). The regression coefficient for changes of Pdu or Pca on salivary secretion at steady state was similar in both groups of glands (P = n.s.). Figure 6 is an experimental tracing illustrating the effect of ductal occlusion on Pdu and Pca 1 min after the onset of parasympathetic nerve stimulation in a gland with constant-flow vascular perfusion. During the occlusion period, Pdu increased steadily but Pca continued to fall.
Figure 4. Experimental recordings showing changes in arterial blood flow ( ) or perfusion pressure (Ppa), Pdu, Pca and in response to parasympathetic nerve stimulation in glands with spontaneous blood flow (A) and glands with constant-flow vascular perfusion at normal flow rate (B).
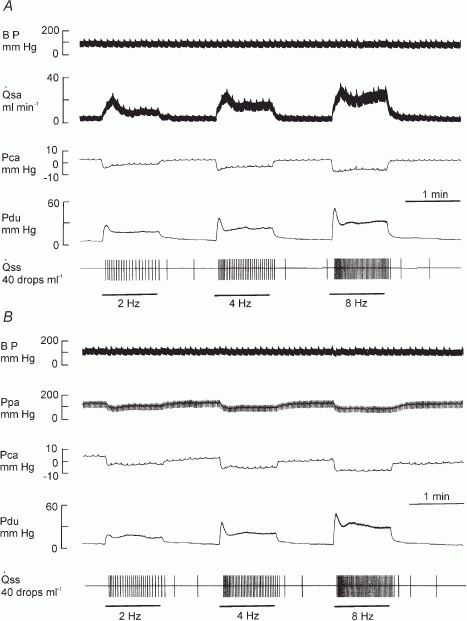
Bar, stimulation; BP, systemic arterial blood pressure
Figure 5. Effects of parasympathetic nerve stimulation on Pdu (A) and Pca (B) in normal and atropinized glands and relationship between the steady state and the change in Pdu (C) and Pca (D) during parasympathetic nerve-induced salivation.
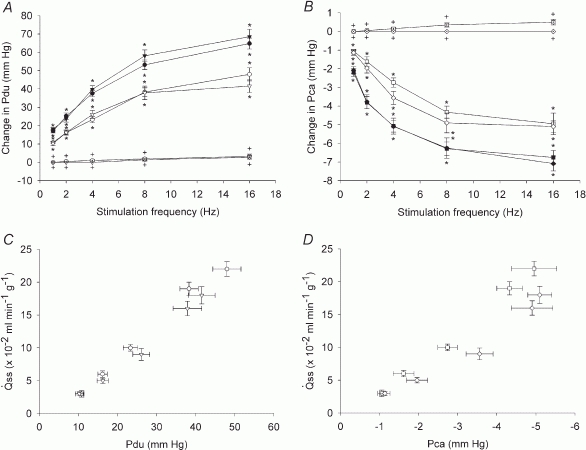
A, peak (•, n = 8), steady state (<$$>, n = 8) and atropinized steady state (⊙, n = 4) responses in glands with spontaneous blood flow. Peak (▾, n = 8), steady state (▽, n = 8) and atropinized steady state ( , n = 4) responses in glands with constant-flow vascular perfusion at normal flow rate. B, peak (▪, n = 8), steady state (□, n = 8) and atropinized steady state (
 , n = 4) responses in glands with spontaneous blood flow. Peak (♦, n = 8), steady state (⋄, n = 8) and atropinized steady state (
 , n = 4) responses in glands with constant-flow vascular perfusion at normal flow rate. C, the regression coefficient for Pdu on is 5.3 (± 0.28) × 10−3 ml min−1 g−1 mmHg−1 (r = 0.99, n = 5, P < 0.001) for glands with spontaneous blood flow (^) and is 4.9 (±0.29) × 10−3 ml min−1 g−1 mmHg−1 (r = 0.99, n = 5, P < 0.001) for glands with constant-flow vascular perfusion at normal flow rate (∇).D, the regression coefficient for Pca on is 4.87 (± 0.20) × 10−2 ml min−1 g−1 mmHg−1 (r = 0.99, n = 5, P < 0.001) for glands with spontaneous blood flow (□) and is 3.68 (± 0.42) × 10−2 ml min−1 g−1 mmHg−1 (r = 0.99, n = 5, P < 0.001) for glands with constant-flow vascular perfusion at normal flow rate (⋄). For A and B, * P < 0.05, when compared to corresponding control. + P < 0.05, when compared to corresponding normal response.
Figure 6. Experimental recordings showing the effect of ductal occlusion during parasympathetic nerve stimulation in a gland with constant-flow vascular perfusion at normal flow rate.
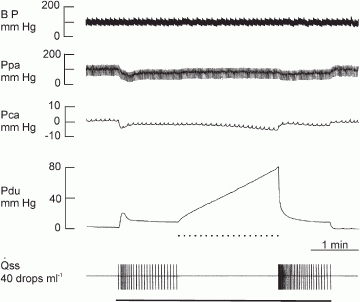
Continuous bar, stimulation at 2 Hz; dotted bar, ductal occlusion.
Atropine (0.5 mg kg−1) abolished salivary flow and almost eliminated the response of Pdu to parasympathetic nerve stimulation (1–16 Hz) (Fig. 5A). In atropinized glands with spontaneous blood flow, parasympathetic nerve stimulation slightly increased Pca with a concomitant increase in blood flow; at 16 Hz, Pca was 0.5 ± 0.15 mmHg (n = 4) while blood flow was 20 ± 2.2 ml min−1 (n = 4). Parasympathetic nerve stimulation had no effect on Pca in atropinized glands with constant-flow vascular perfusion (Fig. 5B). In glands with spontaneous blood flow, ACh (0.1–1 μg kg−1) induced concentration-dependent increases in salivary secretion and Pdu but a fall in Pca (Fig. 7A), despite the concomitant increase in blood flow as previously reported (Lung, 1998). In glands with constant-flow vascular perfusion, ACh induced similar changes in salivary secretion, Pdu and Pca (Fig. 7B). VIP at a low dose (0.01 μg kg−1) did not elicit any response. At a higher dose (0.1 μg kg−1), the autacoid initiated scanty salivary secretion, gradual small increases in Pdu and Pca in glands with spontaneous blood flow (Fig. 7A), together with a prominent increase in blood flow (from 5 ± 0.1 to 12 ± 2.0 ml min−1, n = 6). In glands with constant-flow vascular perfusion, VIP elicited similar changes in salivary secretion and Pdu, although Pca was not affected (Fig. 7B).
Figure 7. The effects of autonomic mimetics on Pdu, Pca and in glands with spontaneous blood flow (A) and glands with constant-flowvascular perfusionat normal flow rate (B).
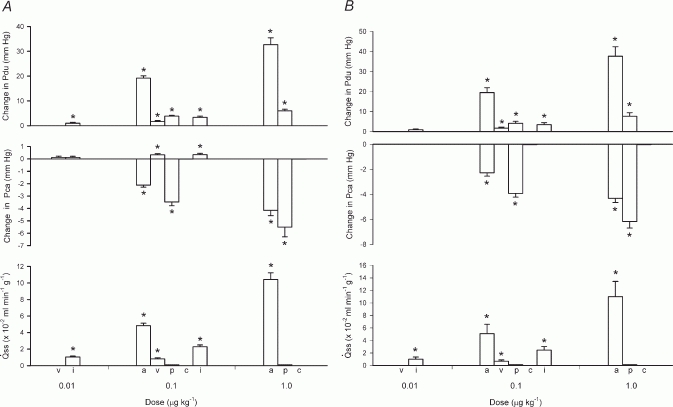
a, ACh; v, VIP; p, phenylephrine; c, clonidine; i, isoproterenol. * P < 0.05, when compared to corresponding control; n = 6.
Effects of sympathetic nerve stimulation
With sympathetic nerve stimulation, the response threshold for both Pdu and Pca was 0.1 Hz; maximal response of both pressures was at 16 Hz. In glands with spontaneous blood flow or constant-flow vascular perfusion, Pca responded by an abrupt decrease, reaching a minimum value within 2–4 s and then slowly declined to a steady level within 30 s (Fig. 8A and B). The response of Pdu was variable. If sympathetic nerve stimulation was given consecutively, Pdu might not demonstrate an obvious response (Fig. 8B). If sympathetic nerve stimulation was induced after a parasympathetic nerve stimulation, Pdu increased abruptly to a peak and then declined to a steady level (Fig. 8A). The time to reach the peak response for both pressures was inversely proportional to the stimulation frequency, 1–2 s for 8–16 Hz and 3–4 s for 1–4 Hz stimulation. The magnitudes of the peak and steady state responses of salivary secretion, Pdu and Pca were in direct proportion to the stimulation frequency (Fig. 9A and B). Salivary secretion, Pdu and Pca were highly correlated whether the gland received spontaneous blood flow or constant-flow vascular perfusion (Fig. 9C and D). The regression coefficient for changes of Pdu or Pca on salivary secretion at steady state was similar in both groups of glands (P = n.s.).
Figure 8. Experimental recordings showing changes in blood flow () or perfusion pressure (Ppa), Pdu Pca and to sympathetic nerve stimulation in glands with spontaneous blood flow (A) and glands with constant-flow vascular perfusion (B).
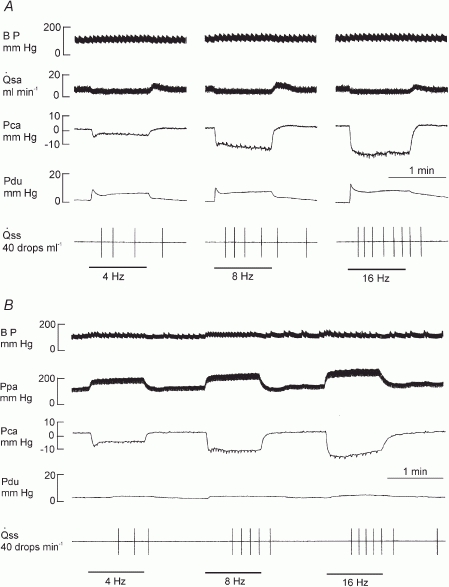
Bar, stimulation.
Figure 9. Effects of sympathetic nerve stimulation on Pdu (A) and Pca (B) and the relationship between the steady state and the change in Pdu (C) and in Pca (D) during sympathetic nerve-induced salivation.
A, peak (•) and steady state (^) responses in glands with spontaneous blood flow; peak ( ) and steady state (∇) responses in glands with constant-flow vascular perfusion. B, peak (▪) and steady state (□) responses in glands with spontaneous blood flow; peak (♦) and steady state (⋄) responses in glands with constant-flow vascular perfusion at normal flow rate. For A and B, * P < 0.05, when compared to corresponding control; n = 8. C, the regression coefficient for Pdu on is 3.0 (± 0.29) × 10−3 ml min−1 g−1 mmHg−1 (r = 0.99, n = 5, P < 0.001) for glands with spontaneous blood flow (^) and is 3.2 (± 0.38) × 10−3 ml min−1 g−1 mmHg−1 (r = 0.99, n = 5, P < 0.001) for glands with constant-flow vascular perfusion at normal flow rate (∇). D, the regression coefficient for Pca on is 3.2 (±0.34) × 10−3 ml min−1 g−1 mmHg−1 (r = 0.99, n = 5, P < 0.001) for glands with spontaneous blood flow (□) and is 3.1 (± 0.49) × 10−3 ml min−1 g−1 mmHg−1 (r = 0.99, n = 5, P < 0.001) for glands with constant-flow vascular perfusion at normal flow rate (⋄).
In glands with spontaneous blood flow, isoproterenol (0.01–0.1 μg kg−1) induced salivary secretion and gradual increases in Pdu and Pca (Fig. 7A), despite a salient increase in blood flow as reported (Lung, 1998). Similar changes in salivary secretion and Pdu were induced by isoproterenol in glands with constant-flow vascular perfusion; however, Pca was not affected (Fig. 7B). In glands with spontaneous blood flow, phenylephrine (0.1–1 μg kg−1) and clonidine (0.1–0.1 μg kg−1) decreased blood flow and did not elicit salivary secretion (Lung, 1998). Phenylephrine increased Pdu and decreased Pca abruptly while clonidine had no effect on either pressure (Fig. 7A). In glands with constant-flow vascular perfusion, phenylephrine and clonidine increased perfusion pressure and did not induce salivary secretion (Lung, 1998); phenylephrine, but not clonidine, caused an abrupt increase in Pdu and a fall in Pca (Fig. 7B).
Interaction between parasympathetic and sympathetic nerve stimulation
In glands with constant-flow vascular perfusion, superimposed sympathetic nerve stimulation caused an abrupt increase not only in salivary secretion but also in the response of both Pdu and Pca to parasympathetic nerve stimulation. The enhancement of the two pressures gradually subsided to a steady level within 30–60 s, accompanied by an inhibition in salivary secretion (Figs 10A and 11). Propranolol had no effect on the abrupt increase in salivary secretion or enhancement in both pressures (Fig. 11). Yohimbine had no effect on the abrupt response of salivary secretion and of the two pressures but alleviated the steady state inhibition of salivary secretion (Figs 10B and 11). Prazosin and phentolamine abolished or greatly alleviated the abrupt changes in salivary secretion and in both pressures (Figs 10C and 11).
Figure 11. Effects of superimposition of sympathetic nerve stimulation and adrenergic antagonists on the responses of Pdu and Pca to parasympathetic nerve stimulation (at 1 Hz) in glands with constant-flow vascular perfusion at normal flow rate.
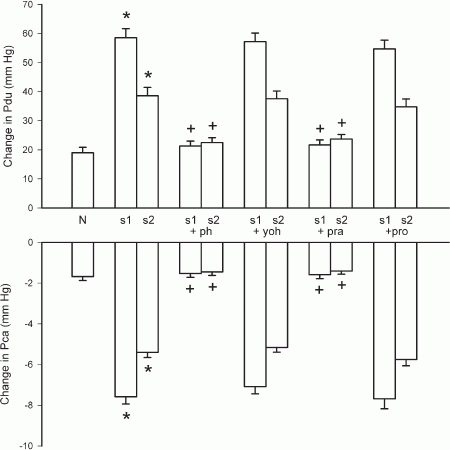
N, steady state response of parasympathetic nerve stimulation; s1, peak response to superimposed sympathetic nerve stimulation; s2, steady state response to superimposed sympathetic nerve stimulation; ph, phentolamine (0.1 mg kg−1); yoh, yohimbine (0.025 mg kg−1); pra, prazosin (0.025 mg kg−1); pro, propranolol (0.1 mg kg−1). * P < 0.05, when compared to the steady state response of parasympathetic nerve stimulation (N); + P < 0.05, when compared to the response with superimposed sympathetic nerve stimulation; n = 8.
Figure 10. Experimental recordings illustrating the actions of adrenoceptor blockers on the effects of superimposed sympathetic nerve stimulation on parasympathetic nerve-induced changes in Pdu, Pca and in a gland with constant-flow vascular perfusion at normal flow rate.
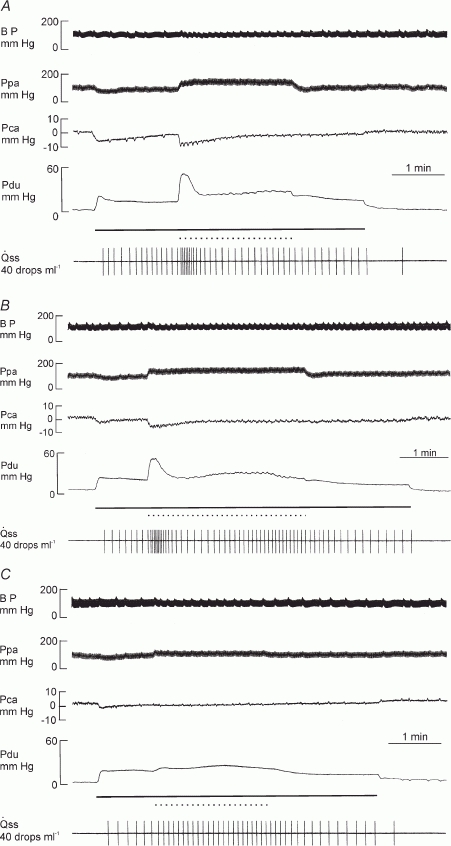
A, normal response. B, after yohimbine (0.025 mg kg−1). C, after yohimbine (0.025 mg kg−1) and prazosin (0.025 mg kg−1). Continuous bar, parasympathetic nerve stimulation at 1 Hz; dotted bar, sympathetic nerve stimulation at 20 Hz.
DISCUSSION
Myoepithelial cell contraction elevates Pdu of salivary glands. Since the ducts are compliant, the pressure change would be small and gradually lost along the ductal system. The conventional method of connecting an extra-corporal pressure transducer to the extra-glandular excretory duct via a fluid-filled T-tube catheter may not be able to pick up any obvious pressure change. Attempts were made to solve the compliance problem by raising the resting ductal pressure with a saline-filled pressure bottle or syringe connected to the distal end of the excretory duct before assessing the stimulation-induced pressure changes (Emmelin et al. 1968, 1969a; Darke & Smaje, 1971). The preparation involves a closed ductal system and thus cannot be used to assess the myoepithelial activity during active secretion, as secretion itself can elevate Pdu. In this study, a catheter-tip transducer was inserted through the excretory duct to the hilum of the gland, monitoring Pdu in situ at the proximal end of the excretory duct, i.e. before considerable pressure loss along the peripheral ductal system. The presence of a catheter-tip transducer inside the ductal system may impede salivary flow, but the size of the catheter is very small. The observation that overt fluid secretion closely followed the onset of parasympathetic nerve stimulation and Pdu fell abruptly on cessation of parasympathetic nerve stimulation indicates negligible salivary flow obstruction (Fig. 4). Moreover, the measured resting Pdu was steady and low, only slightly above the atmospheric pressure (2.5 ± 0.21 mmHg, n = 40).
Myoepithelial cell contraction decreases Pca of salivary glands. Micropuncture and wick-in-needle techniques are conventionally used to monitor tissue pressure. Both methods rely on fluid communication between the pressure transducer and the source of pressure, which can be easily disrupted by tissue obstruction at the tip of the inserted glass capillary or needle or by movement of the wick fibres (Fadnes et al. 1977; Wiig et al. 1981). A catheter-tip pressure transducer, directly placed at the pressure source, has no fluid coupling problems. With the membrane sensor being adhered to the wet surface of the glandular parenchyma, the compliance of the measuring system is much lowered and consequently the sensitivity of pressure measurement is much higher than that of the conventional volume-displacement pressure transducers. The resting Pca measured was 3.0 ± 0.19 mmHg (n = 40). Tissue pressure of many organs is atmospheric or slightly sub-atmospheric (Chen et al. 1976; Clough & Smaje, 1978; Karanjia et al. 1994). The positive value of the resting Pca is unlikely to be related to exudation, as the pressure stayed steady right after the insertion of the transducer. The inserted catheter-tip transducer is space occupying and will press slightly onto the glandular parenchyma after the closure of the incision (Fig. 1B), and this will give Pca a positive pressure at rest.
Parasympathetic salivation
Parasympathetic nerve stimulation induced salivary secretion and increased Pdu but decreased Pca, whether the blood flow was allowed to increase spontaneously or maintained constant (Figs 4 and 5). The threshold frequency for inducing a change in Pdu or Pca (0.1 Hz) being lower than that for eliciting secretion (0.5 Hz; Lung, 1990) indicates that the change in the two pressures can be elicited by nerve stimulation independently of the salivary response.
With parasympathetic nerve stimulation, Pdu rose abruptly to a peak before overt fluid secretion, in 3–4 s for low to moderate levels of stimulation (1–4 Hz) and in 1–2 s for high levels of stimulation (8–16 Hz) (Fig. 4). At the beginning of nerve stimulation, secretion, although it may not be effective in producing overt fluid flow, can increase Pdu. Such a pressure change may be enhanced by the presence of a catheter-tip transducer inside the ductal system. The average salivary fluid flow at 1,2,4,8 and 16 Hz stimulation was about 0.2, 0.5, 1, 1.5 and 2.0 ml min−1, respectively (Lung, 1990, 1998). Consequently, the amount of secreted fluid that could be accumulated inside the ductal system prior to overt salivary flow was at most 0.013, 0.033 and 0.067 ml (after 4 s) or 0.05 and 0.067 ml (after 2 s), respectively. From the relationship between Pdu and the volume of saliva inside a closed ductal system in resting glands (Fig. 2), the response coefficient of Pdu was 50 mmHg ml−1 at low to moderate levels of stimulation and 85 mmHg ml−1 at moderate to high levels of stimulation. The increase in Pdu contributed by occult fluid secretion, also taking into account the obstructive effect of the catheter-tip pressure transducer, prior to visible fluid flow is calculated to be 0.65, 1.65, 3.35, 4.25 and 5.70 mmHg for 1, 2, 4, 8 and 16 Hz stimulation, respectively. The values are 3.8–8.9 % of the peak pressures at their corresponding stimulation frequencies (Fig. 5). Hence, the primary factor responsible for the peak response is the contraction of myoepithelial cells, squeezing onto the filled ductal system. The Pdu after reaching its peak fell immediately, coinciding with the onset of overt fluid flow. The steady state increase in Pdu indicates continual contraction of the myoepithelial cells onto the ductal system with continuous nerve stimulation.
With parasympathetic nerve stimulation, Pca fell abruptly to a minimum before apparent salivary fluid secretion, in 3–4 s for low to moderate levels of stimulation (1–4 Hz) and in 1–2 s for high levels of stimulation (8–16 Hz) (Fig. 4). Parasympathetic nerve stimulation increased blood flow. But increases in blood flow caused by varying perfusion rate were found to slightly increase Pca (Fig. 3). The fall in Pca also occurred in glands with constant-flow vascular perfusion. Hence, the fall in Pca in both groups of glands during parasympathetic nerve stimulation is unlikely to be due to the concurrent vascular response. It has been found in isolated parotid salivary acinar cells that carbachol causes cell shrinkage within 3 s, reaching a minimum volume at 10–30 s (Foskett & Melvin, 1989). However, the ion and water replenishment that occurs subsequently can counteract the volume shrinkage caused by saliva formation. Moreover, before overt fluid secretion, the formed saliva, although discharged into the ductal system, is still residing inside the gland. Therefore, it is doubtful that the initial abrupt fall in Pca is related to acinar cell shrinkage. Both the minimum in Pca and the peak in Pdu occurred at 1–4 s after stimulation (Fig. 4), i.e. much earlier than that for the maximal cell shrinkage seen with secretogogue stimulation in vitro. The speed of the initial changes in both pressures is similar to that of the contractile tissue of the sweat gland (Sato et al. 1979). It is highly probable that the initial abrupt fall in Pca is caused by contraction of the myoepithelial cells, squeezing onto the ductal system and thus resulting in glandular shrinkage. The sustained fall in Pca with continuous parasympathetic nerve stimulation reflects the continual contraction of myoepithelial cells.
Figure 6 shows a gland under constant-flow vascular perfusion and parasympathetic nerve stimulation at 2 Hz having a steady salivary secretion of 0.5 ml min−1. With ductal occlusion, the Pca fell further while Pdu increased steadily to about 80 mmHg after 2 min. The response coefficient of Pdu to the volume of saliva inside the ductal system (resting) is 50 mmHg ml−1 for saliva infusion of 0.5 ml min−1 (Fig. 2). Hence, if the ductal system behaved passively, ductal occlusion would have raised Pdu to 50 mmHg after 2 min. That the measured occluded Pdu (80 mmHg) was much higher indicates active contraction of the ductal system despite passive distention caused by the withheld saliva. Myoepithelial cells possess the structural characteristics of smooth muscle cells. It is likely that they are able to contract after being distended, as with smooth muscle cells (Bulbring, 1955). The further fall in Pca with ductal occlusion during parasympathetic nerve stimulation provides strong evidence that the change in the Pca is related to contraction of the myoepithelial cells.
Atropine abolished salivary flow and almost eliminated the increase in Pdu to parasympathetic nerve stimulation, whether the glands received spontaneous blood flow or constant-flow vascular perfusion; the response of Pca was eradicated in glands with constant-flow vascular perfusion. That Pca showed a slight increase in glands with spontaneous blood flow after atropine may be related to the concurrent blood flow response. ACh induced copious salivary secretion and an increase in Pdu but a fall in Pca despite an increase in blood flow, as with parasympathetic nerve stimulation. ACh evoked similar changes in secretion, Pdu and Pca in glands with constant-flow vascular perfusion. These results suggest that the parasympathetic nerve-induced contraction of myoepithelial cells is mediated via the muscarinic receptors. High doses of VIP caused very scanty salivary secretion and small, gradual increases in both Pdu and Pca; the change in Pca was absent in glands with constant-flow vascular perfusion. Previous studies have shown that exogenous VIP alone cannot elicit overt salivary fluid secretion in the dog (Shimizu & Taira, 1979; Lung, 1998). However, VIP may still be a secretogogue, producing occult fluid secretion. In vitro studies have shown that VIP induces protein release from the dog submandibular gland (Tobin et al. 1990). In this study, VIP was given after the ACh challenge. The ductal system might have been fully filled with saliva formed by the preceding ACh challenge. The secretion induced by subsequent VIP administration, despite being very meagre in amount, may if released into a fully filled ductal system be manifested as overt fluid secretion.A very meagre amount of secretion formed by subsequent VIP administration, which is normally occult, thereby expressed as overt fluid secretion. VIP and ACh have been shown to play complementary roles in salivary secretion (Lundberg et al. 1982). Whether or not the previous ACh challenge has primed the acinar cells, favouring subsequent production of overt fluid secretion by VIP, awaits investigation. The slight increase in Pdu is probably due to the meagre amount of secretion produced by VIP, while the increase in Pca is related to the concurrent increase in blood flow. Hence, contraction of myoepithelial cells does not seem to involve peptidergic receptors.
Sympathetic salivation
Sympathetic nerve stimulation caused scanty salivary secretion and increased Pdu but decreased Pca whether blood flow was allowed to decrease spontaneously or maintained constant (Figs 8 and 9). As with parasympathetic nerve stimulation, the response threshold for both Pdu and Pca (0.1 Hz) is lower than that for eliciting salivary secretion (0.5 Hz; Lung, 1990), indicating that the change in the two pressures is a primary response to nerve stimulation and not secondary to secretion.
The abrupt fall in Pca in response to sympathetic nerve stimulation was as rapid as its fall in response to parasympathetic nerve stimulation (Fig. 8). The response was not removed in glands with constant-flow vascular perfusion, indicating that the event is unrelated to the concurrent decrease in blood flow. Previous studies suggest that the sympathetic nerve, like the parasympathetic nerve, can contract the myoepithelial cells (Emmelin et al. 1968, 1969a). The steady state response coefficient of salivary secretion to changes in Pca is 3.1–3.2 × 10⁻³ ml min−1 g−1 mmHg−1, which is much smaller than the corresponding response coefficient with parasympathetic nerve stimulation (3.68–4.87 × 10⁻² ml min−1 g−1 mmHg−1). The results indicate that a much bigger contraction of the myoepithelial cells is required to expel the sympathetic saliva than the parasympathetic saliva. The sympathetic saliva is highly viscous whereas the parasympathetic saliva is watery. A higher pressure is needed to accelerate the flow of fluid of higher viscosity. The amount of sympathetic saliva produced is scanty compared to the copious parasympathetic saliva. A bigger contraction of myoepithelial cells will reduce the luminal volume more, favouring the outflow of a small amount of secretion.
The response of the Pdu was variable, depending on whether sympathetic nerve stimulation was given consecutively or following parasympathetic nerve stimulation. Repeated sympathetic nerve stimulation would have depleted the ducts of saliva. But a previous parasympathetic nerve stimulation would fill the ducts with saliva. This may explain why consecutive sympathetic nerve stimulation produced much smaller changes in Pdu than when given following parasympathetic nerve stimulation.
Previous studies have shown that superimposed sympathetic nerve stimulation (20 Hz) initially enhances (at 5–10 s) but later diminishes (at 50–60 s) parasympathetically induced (Lung, 1994b). Figures 10 and 11 show that when similar sympathetic nerve stimulation was superimposed onto continuous parasympathetic nerve stimulation, Pdu responded by a further immediate increase and Pca by a further abrupt drop. Hence, autonomic nerves can act synergistically in evoking myoepithelial cell contraction and the sympathetic enhancement of parasympathetic salivation is related to the contraction of the myoepithelial cells. Propranolol had no effect on the enhancement of the response of the two pressures. Phentolamine and prazosin alleviated the enhancement in both pressures but yohimbine did not. Moreover, phenylephrine, but not clonidine and isoproterenol, caused an abrupt fall in Pca in glands with constant-flow vascular perfusion (Fig. 7). The results indicate that the sympathetic activation of the myoepithelial cells is mediated via the α1-adrenergic receptors, in line with previous findings that the sympathetic enhancement of parasympathetic salivation is via the α1-adrenoceptors (Lung, 1994b).
The results of this study support previous findings from salivary glands stimulated at rates below the secretory threshold, that both autonomic nerves can contract myoepithelial cells (Emmelin et al. 1968, 1969a). This study also demonstrates for the first time that the nerve-induced contraction is directly related to the stimulation strength beyond the secretory threshold or to the volume of overt fluid secretion and, in addition, both nerves act in synergism in causing myoepithelial cell contraction. Emmelin et al. (1969b, 1973) have shown that atropine can abolish the parasympathetic nerve-induced contraction while dihydroergotamine can eliminate the sympathetic nerve-induced contraction. The present study also verifies that the parasympathetic nerve-induced contraction is via the muscarinic receptors and the sympathetic nerve-elicited contraction is through the adrenergic receptors, and more specifically via the α1-adrenoceptors.
Previous workers believed that the myoepithelial activity can accelerate initial outflow of saliva, reduce ductal volume, give support to the underlying parenchyma and perhaps assist passage of fluid via parenchyma tight junctions (Garrett, 1998). Because of the limitations of the methodology used by previous workers, the exact function(s) of myoepithelial cells during secretion could not be investigated. The present study introduces a novel method, which is able to assess the myoepithelial activity in secreting salivary glands without interruption of salivary flow. With this preparation, the aforementioned speculative function(s) of the myoepithelial cells can be further investigated.
Acknowledgments
This project was supported by CRCG/HKU (10202692/04803/21400/323/01) research grants. The author is grateful to Dr J. C. C. Wang for helpful comments, to Mr K. K. Tsang for technical assistance and to AFCD/HKSAR and LAU/HKU for supplying experimental animals.
REFERENCES
- Archer FL, Kao VC. Immunohistochemical identification of actomyosin in myoepithelium of human tissues. Lab Invest. 1968;18:669–674. [PubMed] [Google Scholar]
- Bulbring E. Correlation between membrane potential, spike discharge and tension in smooth muscle. J Physiol. 1955;128:200–221. doi: 10.1113/jphysiol.1955.sp005299. [DOI] [PMC free article] [PubMed] [Google Scholar]
- Chen HI, Granger HJ, Taylor AE. Interaction of capillary, interstitial and lymphatic forces in the canine hindpaw. Circ Res. 1976;39:245–254. doi: 10.1161/01.res.39.2.245. [DOI] [PubMed] [Google Scholar]
- Clough G, Smaje LH. Simultaneous measurement of pressure in the interstitium and terminal lymphatics of the cat mesentery. J Physiol. 1978;283:457–468. doi: 10.1113/jphysiol.1978.sp012512. [DOI] [PMC free article] [PubMed] [Google Scholar]
- Darke AC, Smaje LH. Myoepithelial cell activation in the submaxillary salivary gland. J Physiol. 1971;219:89–102. doi: 10.1113/jphysiol.1971.sp009651. [DOI] [PMC free article] [PubMed] [Google Scholar]
- Emmelin N, Garrett JR, Ohlin P. Neural control of salivary myoepithelial cells. J Physiol. 1968;196:381–396. doi: 10.1113/jphysiol.1968.sp008513. [DOI] [PMC free article] [PubMed] [Google Scholar]
- Emmelin N, Garrett JR, Ohlin P. Motor nerves of salivary myoepithelial cells in dogs. J Physiol. 1969a;200:539–546. doi: 10.1113/jphysiol.1969.sp008706. [DOI] [PMC free article] [PubMed] [Google Scholar]
- Emmelin N, Gjorstrup P. On the function of myoepithelial cells in salivary glands. J Physiol. 1973;230:155–198. doi: 10.1113/jphysiol.1973.sp010182. [DOI] [PMC free article] [PubMed] [Google Scholar]
- Emmelin N, Ohlin P, Thulin A. The pharmacology of salivary myoepithelial cells in dogs. Br J Pharmacol. 1969b;37:666–679. doi: 10.1111/j.1476-5381.1969.tb08505.x. [DOI] [PMC free article] [PubMed] [Google Scholar]
- Fadnes HO, Reed RK, Aukland K. Interstitial fluid pressure in rats measured with a modified wick technique. Microvasc Res. 1977;14:27–36. doi: 10.1016/0026-2862(77)90138-8. [DOI] [PubMed] [Google Scholar]
- Foskett JK, Melvin JE. Activation of salivary secretion: coupling of cell volume and [Ca2+]i in single cells. Science. 1989;244:1582–1585. doi: 10.1126/science.2500708. [DOI] [PubMed] [Google Scholar]
- Garrett JR. Myoepithelial activity in salivary gland. In: Garrett JR, Ekstrom J, Anderson LC, editors. Glandular Mechanisms of Salivary Secretion. Basel: Karger; 1998. pp. 132–152. [Google Scholar]
- Karanjia ND, Widdison AL, Leung F, Alvarez C, Lutrin FJ, Reber HA. Compartment syndrome in experimental chronic obstructive pancreatitis: effect of compressing the main pancreatic duct. Br J Surg. 1994;81:259–264. doi: 10.1002/bjs.1800810236. [DOI] [PubMed] [Google Scholar]
- Lundberg JM, Anggard A, Fahrenkrug J. Complementary role of vasoactive intestinal polypeptide (VIP) and acetylcholine for cat submandibular gland blood flow and secretion. Acta Physiol Scand. 1982;114:329–337. doi: 10.1111/j.1748-1716.1982.tb06992.x. [DOI] [PubMed] [Google Scholar]
- Lung MA. Variations in blood flow on mandibular glandular secretion to autonomic nervous stimulation in anaesthetized dogs. J Physiol. 1990;431:479–493. doi: 10.1113/jphysiol.1990.sp018341. [DOI] [PMC free article] [PubMed] [Google Scholar]
- Lung MA. Effects of parasympathetic nerve stimulation on intracapsular pressure and intraductal pressures of the submandibular gland in anaesthetized dogs. J Physiol. 1994a;481.P:22P. [Google Scholar]
- Lung MA. Mechanisms of sympathetic enhancement and inhibition of parasympathetically induced salivary secretion in anaesthetized dogs. Br J Pharmacol. 1994b;112:411–416. doi: 10.1111/j.1476-5381.1994.tb13087.x. [DOI] [PMC free article] [PubMed] [Google Scholar]
- Lung MA. Autonomic nervous control of venous pressure and secretion in submandibular gland of anaesthetized dogs. Am J Physiol. 1998;275:G331–341. doi: 10.1152/ajpgi.1998.275.2.G331. [DOI] [PubMed] [Google Scholar]
- Martinez-Madrigel F, Micheau C. Histology of the major salivary glands. Am J Surg Pathol. 1989;13:879–899. doi: 10.1097/00000478-198910000-00008. [DOI] [PubMed] [Google Scholar]
- Miller ME, Christensen GC, Evans HE. Anatomy of the Dog. Philadelphia: Saunders; 1965. [Google Scholar]
- Norberg L, Dardick L, Leung R, Burford-Mason AP, Rippstein P. Immunogold localization of actin and cytokeratin filaments in myoepithelium of human parotid salivary gland. Ultrastruct Pathol. 1992;16:555–568. doi: 10.3109/01913129209061547. [DOI] [PubMed] [Google Scholar]
- Sato K, Nishiyama A, Kobayashi M. Mechanical properties and functions of the myoepithelium in the eccrine sweat gland. Am J Physiol. 1979;237:C177–184. doi: 10.1152/ajpcell.1979.237.3.C177. [DOI] [PubMed] [Google Scholar]
- Shimizu T, Taira N. Assessment of the effects of vasoactive intestinal peptide (VIP) on blood flow through and salivation of the dog salivary gland in comparison with those of secretin, glucagon and acetylcholine. Br J Pharmacol. 1979;65:683–687. doi: 10.1111/j.1476-5381.1979.tb07882.x. [DOI] [PMC free article] [PubMed] [Google Scholar]
- Tandler B. Structure of the human parotid and submandibular glands. In: Sreebny LM, editor. The Salivary System. Florida: CRC Press; 1987. pp. 21–42. [Google Scholar]
- Tobin G, Luts A, Sundler F, Ekstrom J. VIP-containing nerve fibres in the submandibular gland of the dog and protein secretion in vitro in response to VIP. Regul Pept. 1990;29:173–177. doi: 10.1016/0167-0115(90)90080-g. [DOI] [PubMed] [Google Scholar]
- Wiig H, Reed RK, Aukland K. Micropuncture measurement of interstitial fluid pressure in rat subcutis and skeletal muscle: comparison to wick-in-needle technique. Microvasc Res. 1981;21:308–319. doi: 10.1016/0026-2862(81)90014-5. [DOI] [PubMed] [Google Scholar]