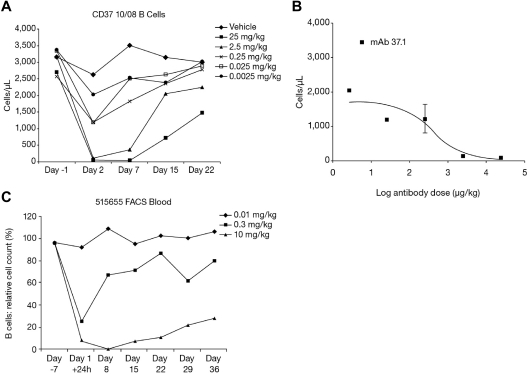
Figure 5.
Dose response in animals. Effect of a single dose of mAb 37.1 (A) on peripheral B-cell count (B220+ cells) in huCD37-transgenic mice. Each curve represents the mean of 3 animals per dose group. (B) Dose response of B cells on day 2 after treatment; absolute B-cell counts for mAb 37.1 are shown. Mean of 3 animals is shown; SD is indicated. (C) Effect of a single dose of mAb 37surr on peripheral blood B-cell count in cynomolgus monkeys. Relative B-cell counts compared with predose (day −7) are depicted. Mean 2 animals per dose group.

