Abstract
Diffuse optical imaging (DOI) is a model-based technique used for noninvasive characterization of subsurface tissue function and structure. Compared to more common transmission geometries, reflectance DOI has the advantage of being portable and easily implemented in a clinical setting. However, reflectance measurements are generally not compatible with conventional DOI image reconstruction methods because they typically provide a limited number of unique tissue views. In this paper, we describe a fast and reliable DOI image reconstruction method based on parameterization of tissue and tumor optical contrast, using physiological a priori knowledge. The reconstruction method is formulated within the general Bayesian inversion framework and is capable of handling both model and measurement errors. Simulations are carried out to illustrate the application of this approach, using a limited number of source–detector combinations. It is also shown that parametric reflectance DOI is robust to model misspecifications and measurement noise.
Index Terms: Bayesian, breast cancer, diffuse optical spectroscopy (DOS), diffuse optical tomography (DOT), inverse problem, photon migration
I. Introduction
Diffuse optical imaging (DOI) and diffuse optical spectroscopy (DOS) use near infrared (NIR) light to noninvasively extract spatial and spectral information from subsurface structures in thick tissues. DOI/DOS technologies are currently being tested in an increasing number and variety of clinical applications, primarily, in brain, muscle, and breast tissues. This work focuses on the application of DOI and DOS to breast cancer [1]–[9].
We have developed a DOS instrument with a handheld reflectance probe that features a large spectral bandwidth (650–1000 nm), but with limited spatial capabilities [10]. The broadband information content of DOS recovers the concentration and disposition of important NIR-absorbing molecules, such as hemoglobin, water, and lipid. High spectral resolution and bandwidth allow DOS to identify signatures of tumors that cannot be observed by conventional discrete-wavelength DOI or diffuse optical tomography (DOT) [11], [12]. The relationship between DOS and DOI/DOT is similar to that between magnetic resonance spectroscopy (MRS) and imaging (MRI); high spectral bandwidth is achieved at the cost of lower spatial resolution.
DOS employs thousands of wavelengths and typically utilizes a limited number of source–detector “views” of the tissue. This further constrains the technique to relatively simple homogeneous diffusion models to recover tissue optical properties (i.e., absorption and reduced scattering parameters). The measured optical properties of heterogeneities are therefore a weighted average of target (i.e., tumor) and background (i.e., “normal”) optical properties. Thus, it is not easy to extract the exact tumor spatial location with fixed-view DOS measurements. In addition, while the reflectance measurement geometry lends itself to portable instrumentation suitable for translational clinical use; full pixelwise image reconstruction as used in transmission tomography is unrealistic.
In conventional DOI and DOT, pixelwise images are reconstructed from boundary measurements similar to computed tomography (CT) and MRI (see [13] for a review). Pixelwise DOI and DOT image reconstruction methods rely on the parameterization of tissue optical properties by locally confined basis expansions. A large number of boundary measurements are necessary to recover the large set of unknowns (i.e., optical properties at each pixel); typically a limited number of wavelengths are used to reduce the size of the dataset and technical complexity. Regularization techniques along with extra constraints, known as a priori information, are needed to improve and stabilize the reconstruction process [14]–[18]. However, it should be noted that a priori information based upon images from other modalities may not necessarily have the same contrast elements as optical signals [19].
Alternative parameterizations in DOI and DOT have been suggested by several groups to reduce the total number of unknowns. Gu et al. [20] parameterized the 3-D imaging domain by a discrete cosine transform and reconstructed the coefficients of the corresponding cosine component. Further reduction can be achieved, using shape-based methods. Kolehmainen et al. [21] proposed a shape-based method in 2-D by first dividing the imaging domain into piecewise constant regions with boundaries, and then, parameterized boundaries by the coefficients of their Fourier components. Zacharopoulos et al. [22] generalized this method into 3-D cases by expanding 3-D boundaries onto spherical harmonics. Kilmer et al. [23] also proposed shape-based imaging of absorption perturbations. In their approach, low-order parameterization of the background and interior optical properties of the anomaly was used and the boundary of the anomaly was described by an ellipsoid, which was parameterized by its centroid location, semiaxes lengths, and orientation of the principle axes. Fantini et al. [4] and Holboke et al. [19] used similar methods to analyze breast tumors by parameterization in terms of location, size, and optical properties. Note that shape-based methods in DOT/DOI implicitly assume that a boundary exists between abnormal and normal tissues.
In previous study, we showed that the spatial extent of optical contrast in breast tumors may be significantly greater than the dimensions reported by standard anatomic imaging [24]. The distribution of tumor optical properties was modeled as a spatially distributed target (e.g., a Gaussian distribution) with a few parameters describing key characteristics.
In this study, we develop a parametric image reconstruction algorithm that is suitable for 3-D diffuse optical spectroscopic imaging (DOSI) in reflectance geometry with broad spectral bandwidth. A great reduction in the number of reconstruction parameters is made by introducing carefully chosen distribution functions to describe the lesion optical contrast.
II. Mathematical Formulation
A. Parameter Space
With the tumor optical contrast described by a distributed mathematical function, the reconstruction problem focuses on the parameters of a mathematical function that specify the optical contrast. In this preliminary study, it is assumed that only the optical absorption contrast is spatially extended and can be mathematically described by a Gaussian function, i.e.,
Background absorption is known from DOS measurements of normal breast regions. The scattering coefficient of the tumor and the background are assumed to be the same. Such an optical contrast is therefore completely specified by the seven parameters of a Gaussian function, namely, the spatial position (x, y, z), the spatial extension (FWHMx, FWHMy, FWHMz), and the peak absorption value Apeak. Tumors specified by such a Gaussian function are referred to as a Gaussian extended absorbing target or simply “Gaussian target.” Let p denote the parameter vector, that is
The space composed of all such vectors is denoted by ℙ, i.e., the parameter space.
B. Forward Problem
1) Diffusion Approximation
Light propagation within biological tissues or more generally, in turbid media, is suitably described by the radiative transport equation (RTE) derived from Boltzmann transport theory [25]. The RTE is a statement of energy conservation for a photon beam interacting with the turbid medium. The RTE is appropriately simplified to the photon diffusion equation (i.e., diffusion theory) when light propagation is dominated by scattering rather than absorption, so that each photon undergoes many scattering events before being terminated by an absorption event. In such cases, photons have a relatively long lifetime, which allows for a random walk within the medium. The diffusion approximation (DA) to the RTE in the frequency-domain approach is given by [26], [27]
where Φ(r, ω) is the photon fluence rate at position r, when the source is intensity modulated at frequency ω. μa (r) is the absorption coefficient (per millimeter) and it is the reciprocal of the mean free path length of a photon before it is absorbed. is the diffusion coefficient, in which is the reduced scattering coefficient (per millimeter), being the reciprocal of the random walk step size of a photon. c is the speed of light within the medium and q(r, ω) is the source located at r position. There are a variety of boundary conditions that have been applied in DAs. The most commonly used boundary condition is the Robin type boundary condition, which arises naturally from the derivation of the DA from RTE boundary conditions. It is written as follows:
where Λ is a coefficient due to the mismatch of the refractive indexes at the boundary and n is the normal direction at boundary position. A detailed review can be found in [13] and [26].
The coefficients of absorption and reduced scattering predicted by diffusion theory are considered as the characteristic optical properties of the biological tissues under investigation and are believed to be fundamentally associated with the biological and physiological features of these tissues. The extraction of absorption and scattering coefficients is therefore essential to medical diagnosis and imaging.
In this study, the DA is always assumed to be an accurate model describing photon propagation through human tissues.
2) Finite-Element Method
The finite-element method (FEM) was introduced to DOI for a solution of the light diffusion equation in the imaging in early 1990s [28], [29] and has been widely used as a computational tool since that time. A brief review is given below.
The solution to the diffusion equation, is also a solution of (if it exists)
where Ψ(r) is the test function, which is an arbitrary function satisfying the same boundary condition as Φ(r).
By using integration by parts and applying Green’s theorem, we have
Inserting the boundary conditions for diffusion equation, we have
In the FEM approach, the solution Φ(r) is projected onto a finite dimensional basis set {ψi (r)}, composed of piecewise polynomials with compact support. The most straightforward choice of such supports is to divide the solution domain into N disjoint elements, i.e., .
Following Galerkin’s approach [30], the test functions are chosen to be the basis functions of the FEM mesh, i.e., Ψ(r) = ψi(r) (i = 1, …, N). This choice of test function converts the integral equation into a sparse linear system due to the fact that only the adjacent basis functions, which overlap with each other contribute to the final matrix equation. The matrix form equation may be expressed as follows:
where
Note that the right-hand side of the equation is due to the point source, which is assumed to be at a depth beneath the surface and the only nonzero elements correspond to the nodes of the element that encloses the source point.
The FEM equation can be efficiently solved as a sparse linear system by using standard techniques, such as the conjugate gradient method. With the optical properties described by the parameter vector p, the FEM solution with the source at kth position, Φk, can be solved formally as follows:
The measurement data on the boundary of the solution domain are related to the solution by a measurement operator M, and the measurement data with the kth source is therefore
The form of the measurement operator Mj depends on the data type zj that is used. In a frequency-domain measurement, it is typically chosen to be the amplitude attenuation and the phase shift between the source and the detector. Mathematically, it is equivalent to the real and imaginary part of the logarithm of the FEM solution, i.e.,
Finally, the forward problem for all sources can be formulated as follows:
with p ∈ ℙ.
C. Bayesian Formulation of Inverse Problem
The inverse problem consists of finding the optical properties within the imaging domain, given the boundary measurement with a specific illumination and detection geometry. With the optical properties described by the parameters defined in the previous section, it is equivalent to the problem of searching within the parameter space for the parameter vector that gives the boundary data the best fit to the measurement data.
Measurement data are generally contaminated by measurement noise e, while the forward solution is contaminated by the approximation errors ε, due to the inexact solution of diffusion equations (which is assumed to be an exact description of the light diffusion within biological tissues, and therefore, no model errors are introduced), i.e.,
It is more straightforward to think of the inverse reconstruction as a Bayesian inference problem of finding an estimator p̂ that minimizes a predefined loss function [31], [32].
1) Maximum a Posteriori Estimator
Under the uniform loss function, we have the well-known maximum a posteriori (MAP) estimator. The inverse problem using MAP is therefore formulated as follows. Given the boundary measurement, find the parameter that maximizes the posterior probability density of parameters, π(p|y), which from Bayesian formula as follows:
where L(p|y) is the likelihood given measurement and πprior(p) is the prior density of the parameter distribution.
Our prior knowledge on the parameters of interests can be naturally incorporated through the choice of prior densities. For biological problems, it can be based on the statistical analysis of the available images, tumor physiology, or any other relevant known information. The estimator given by a Bayesian inference is generally a weighted combination of information from data and prior knowledge.
If the measurement noise and the approximation errors are assumed to be additive and mutually independent of each other as well as the parameter p, (the approximation error in principle should be dependent on different prior distribution for parameters, but this mutual dependence is ignored for simplification), i.e.,
The likelihood function is therefore proportional to the conditional probability given parameters and model, which is
It is clear that our knowledge of noise models for both measurement as well as approximation errors is necessary for MAP estimation. The former can be estimated through repeated measurements while the latter can be estimated by statistical sampling of repeated forward simulations. In practice, a normal model for the noise distribution is assumed in most cases due to its ease of implementation. We let the expectation value for the noise vector be
and covariance matrix
It is assumed that the measurement errors are independent and the covariance matrix is diagonal. The statistics of the approximation error, however, are dependent on the numerical model used and the choice of parameters, which can be estimated by simulations. Moreover, covariance matrices are assumed to be positive definite in this study.
The likelihood function given by a normal noise model is therefore
A simple assumption of the prior density of parameters is normal, i.e.,
However, more sophisticated models can be used, such as hierarchical models [18].
With suitable choices of prior density and the error model, the posterior density function is expressed as follows:
By a simple logarithm transform, finding the MAP estimator of p by maximizing the posterior density leads to an unconstrained optimization problem
It should be noted that such an optimization problem is equivalent to a least square minimization problem with regularization. However, the choice of regularization parameters are based on our preference of noise error models as well as prior knowledge rather than based on a cross-validation procedure.
The unconstrained optimization problem is solved with Levenberg–Marquardt method [33] in which the parameters are iteratively updated with an automatically controlled stabilization parameter λ, i.e.,
where J is the Jacobian matrix. The Woodbury formula can be used to find the matrix inverse to reduce calculation time because in an underdetermined problem, as is often the case in DOI, the Jacobian matrix has more columns than rows [34].
2) Construction of Jacobian Matrix
In conventional pixelwise image reconstruction methods, the Jacobian matrix is often considered to be the sensitivity of each source–detector channel to a small perturbation in the absorption coefficient at each pixel. Consider only the absorption coefficients in a pixelwise basis (for simplicity, we will use the same basis as the FEM mesh), i.e., , where uk (r) is the FEM shape function at kth node and Nk is the total number of pixels; the Jacobian in the conventional image reconstruction method is
where Iij is the signal due to the jth source detected at ith detector position. Ns is the number of sources while Nd is the number of detectors. Adjoint method is commonly used to construct the Jacobian matrix due to its simplicity and efficiency. Instead of perturbing each pixel and finding the change of signals, which requires Ns × (Nk + 1) forward solutions, the adjoint method constructs the Jacobian matrix in such a way that every entry is computed as follows:
where Φj is the solution vector to the diffusion equation due to the jth source and Ψi is the solution vector to the adjoint diffusion equation with an adjoint source at the ith detector position, and Vk (l, m) = ∫ uk (r)ul (r)um (r)dr. If uk (r) are the basis functions of a FEM discretization, then Vk is a sparse matrix. The advantage is that each row in the Jacobian matrix can be simultaneously constructed, which requires only Ns + Nd forward FEM solutions.
This method is generalized when the parameters of interest are tumor characteristics instead of pixel values. In the case where parameters of interest are p ∈ ℙ, the Jacobian matrix is defined as follows:
which requires a total number of forward solutions Ns × (Np + 1) (Np number of parameters) at each iteration step if computed directly. The adjoint method can be applied, however, after slight manipulation of the Jacobian, for each entry of J
Here, δIij/δμa(k) is calculated by using the adjoint method as illustrated earlier. Importantly, only Ns + Nd evaluations are necessary to compute the Jacobian, plus a series of inner products of vectors with size Nk, which can be carried out very efficiently.
III. Methods
A. Simulated Data and Numerical Errors
Synthetic data were generated from a 3-D FEM model with cubic basis functions. Various noise levels were also added to the simulated data to determine their influence on the final reconstruction.
At each reconstruction iteration step, FEM with linear basis functions was used to solve the forward problem. Such an approach is applied for the purpose of fast image reconstruction as well as to avoid the “inverse crime” of using the same model to simulate and reconstruct data [35]. However, it is important to account for numerical errors arising from the linear approximation in the forward calculation, which are comparable to the added noise levels.
In the Bayesian inversion framework, numerical error is treated as random noise as well. Some assumptions of its density distribution are necessary as previously mentioned. In this study, we assume that numerical errors are also normally distributed such that second-order properties are enough to describe its distribution. To be specific, we first obtain a random sample from the parameter space. Then, for each sample point, the numerical error is found by comparing forward solutions between FEM solutions with linear basis and cubic basis functions. Finally, the sample mean and covariance of numerical errors are computed from this ensemble of numerical errors.
B. Prior Information
In this study, two sources of prior information are included. Inherent to the proposed parametric reconstruction is the physiological a priori knowledge that resulted in our Gaussian distributed target assumption. This allows us to greatly reduce the number of reconstruction parameters and improve the performance of the reconstruction algorithm. This advantage is especially favorable in a reflectance geometry with a sparse spatial dataset.
Additional prior information can also be added through the Bayesian inversion framework, if some knowledge of prior probability densities for parameters of interest is available. For example, the prior expectations of spatial location and size of a particular target can be chosen to be the spatial location and size of the target from an ultrasound scan. Relatively large variances can be specified for these parameters to reflect our uncertainty of the correlation between optical and ultrasound contrast. It should be noted that such specifications of probability densities do not have to be highly accurate and they can be based upon any reasonable assumption. The final Bayesian estimate is averaged over the information from measurements and prior knowledge.
In this study, the expected center location of the Gaussian extended tumor is (0, 10) mm in the x–y plane, and −12.5 mm in depth, with the uncertainty (standard deviation) being 10 mm. The expected peak optical absorption is 0.0175 mm−1, with the standard deviation 0.01 mm−1. The expected FWHM of the extended tumor is (15, 15, 15) mm in x–y–z directions, with the uncertainty 10 mm in all directions.
C. Virtual Probe
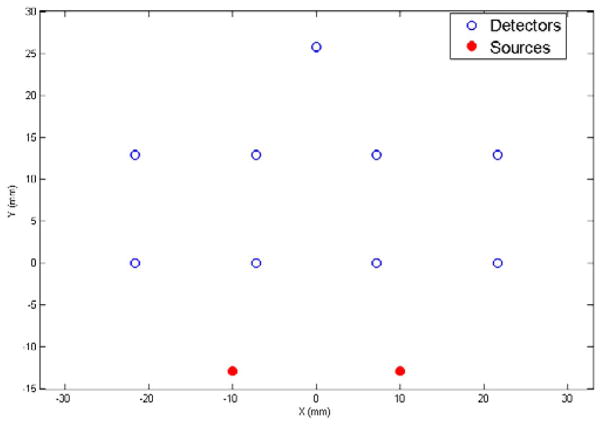
A virtual reflectance probe was used in this study. Two sources and nine detectors were organized asymmetrically in a reflectance geometry, providing a total of 18 views of imaging volume, some of which overlap (see Fig. 1). The source–detector separations ranged from 1.3 to 4 cm, based upon the expected optical properties of breast tissue, the average penetration depth is around 0.5 ~ 2 cm below the surface. This probe is designed to operate in the frequency domain with a 100 MHz modulation frequency.
Fig. 1.
Virtual reflectance probe. Circles indicate the positions of detectors and solid dots indicate the positions of the sources. The source–detector separations ranged from 1.3 to 4 cm.
IV. Results
A. Gaussian Extended Absorbing Target With Fixed Noise Levels
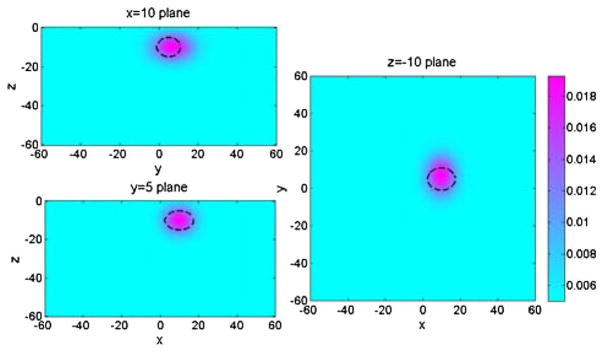
In our first simulation experiment, a Gaussian extended target was inserted at (10, 5) mm in the x–y plane, at −10 mm in depth (i.e., the center position of Gaussian target), with 0.025 mm−1 peak absorption coefficient, and (15, 12, 10) mm FWHMs in x–y–z directions, respectively. The measurement noise level was assumed to be 1%, which is comparable with the measured optical property drift measured over 1 h with our DOSI instrument. One such measurement results in a reconstructed Gaussian object at (9.85, 6.91) mm in the x–y plane, −9.97 mm in depth, 0.0193 mm−1 peak absorption coefficient, and the spatial extensions in x, y, and z are (13.17, 16.99, 11.66) mm. An illustration of the reconstructed image with Gaussian target is shown in Fig. 2, compared with the location and size of true Gaussian target (dashed lines).
Fig. 2.
Cross sections of 3-D reconstruction result of a Gaussian extended absorbing object in x = 10 mm plane, y = 5 mm plane, and z = −10 mm plane. Dashed lines indicate the position and FWHM of the real object.
The parametric reconstruction method was also tested on other Gaussian targets with different sizes and depths with the same measurement noise level (1%). The results are summarized in the Table I. To further compare reconstruction performance, we defined volume contrast as follows:
where the integral is taken within the imaging domain.
TABLE I.
Reconstructed Parameters FOR Gaussian Targets With Different Sizes AND Locations
| True Parameters
|
Reconstructed parameters
|
||||||||
|---|---|---|---|---|---|---|---|---|---|
| (x, y) position (mm) | Depth (mm) | Size (mm) | Apeak (mm−1) | VC (mm2) | (x,y) position (mm) | Depth (mm) | Size (mm) | Apeak (mm−1) | VC (mm2) |
| 0,5 | −10 | 15 12 10 | 0.0250 | 43.01 | 0.297, 5.94 | −10.3 | 14.4, 14.8, 11.0 | 0.0228 | 49.63 |
| −18 | 43.42 | −0.138, 6.45 | −18.1 | 15.4, 14.8, 11.6 | 0.0206 | 49.74 | |||
| 0,5 | −10 | 20 20 20 | 0.0250 | 169.9 | 0.242, 4.86 | −11.1 | 19.9, 20.6, 19.2 | 0.0256 | 178.6 |
| −18 | 189.7 | 0.116, 5.44 | −16.7 | 19.9, 21.0, 17.1 | 0.0255 | 174.8 | |||
The peak optical absorption coefficient is fixed at 0.025 mm−1, which is 5× background absorption. In the x–y plane, the target is put at (0, 5) mm.
In the x–y plane, the biggest discrepancy between the reconstructed position and true position is around 1.5 mm, while for depth parameters, there is a 1.3 mm difference at most. The peak absorption coefficients for larger targets are better recovered in general. It should be noted that for targets with smaller sizes, although the recovered peak absorption coefficients are lower than true values, the reconstructed sizes are slightly larger than the true value. This results in a relatively consistent volume contrast.
B. Non-Gaussian Extended Absorbing Target With Fixed Noise Levels
It is interesting to see how the non-Gaussian targets look like if they were reconstructed as Gaussian targets. Reconstructing non-Gaussian subsurface objects is beneficial, firstly, to test the robustness of the parametric image reconstruction method in case of noise due to model error of non-Gaussian extended target; secondly, to test the feasibility of the simplification of phantom making as well as future phantom measurement. The noise level for the measurement is still kept 1% in this simulation.
Three types of non-Gaussian targets were reconstructed as if they were Gaussian extended. They mimic the situations, where possible model misspecifications may be present in both experimental and clinical applications.
Case 1 (Cylindrical Heterogeneity)
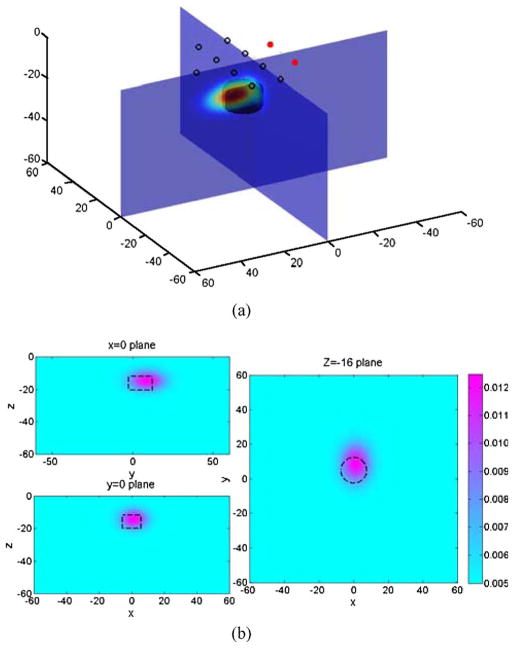
The center of a cylindrical target is located at (0, 5) mm in x–y plane, with the top surface of the cylinder −12 mm below the top surface of the domain. The radius is 7.5 mm and the height is 8 mm. The constant optical absorption coefficient is chosen to be 0.020 mm−1.
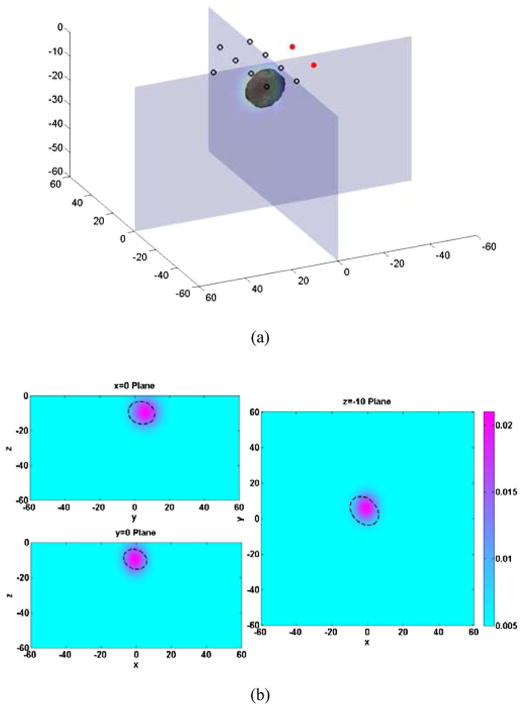
With 1% measurement noise level, the reconstructed parameters are (units are omitted) as follows:
A Gaussian extended object was reconstructed, with its center at position of (1.1, 8.9) mm in the x–y plane and 14.4 mm beneath surface. The spatial extensions in the x-, y-, and z-direction, characterized by its FWHM’s, are (13.5, 17.9, 9.6) mm, respectively. The peak optical absorption contrast is 0.0131 mm−1, which is considerably lower than 0.020 mm−1, but also note that the volume contrast is 22.71 mm2 for the cylinder and 17.92 mm2 for the reconstructed Gaussian object. The relative error is 21%. The reconstructed results are shown in Fig. 3.
Fig. 3.
(a) Illustration of the 3-D reconstruction result of a cylindrical absorbing target. (b) Cross sections of the 3-D plot in x = 0 plane, y = 0 plane, and z = −16 plane. Dashed lines indicate the position of the real object.
Case 2 (Ellipsoid Heterogeneity)
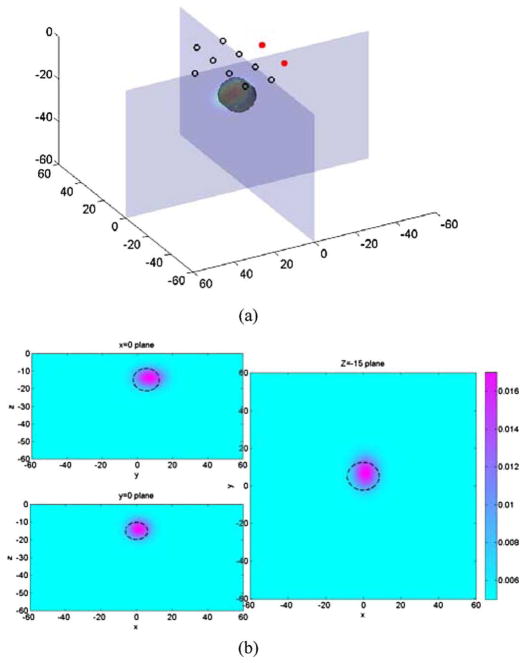
An ellipsoid target with its center located at (0, 5) mm in x–y plane, and 15 mm below the top surface was also tested. The semiaxes along x-, y-, and z-axes are 8.5, 7.5, and 6.5 mm, respectively. The constant optical absorption coefficient was set to be 0.020 mm−1. With 1% measurement noise level, the reconstructed parameters for a Gaussian function are (units are omitted) as follows
The center of the reconstructed Gaussian extended target overlaps well with true center of the ellipsoid (see Fig. 4). The peak contrast is again lower than the true optical contrast within ellipsoid target, but volume contrast is 25.94 mm2 for the ellipsoid and 21.33 mm2 for the reconstructed Gaussian object. The relative error is 18%.
Fig. 4.
(a) Illustration of the 3-D reconstruction result of an ellipsoid absorbing target. (b) Cross sections of the 3-D plot in x = 0 plane, y = 0 plane, and z = −15 plane. Dashed lines indicate the position of the real object.
Case 3 (Irregular Shaped Heterogeneity)
As a general case, a target with irregular shape, which is described by the mathematical function
was also tested, where I(·) is an indicator function. With 1% measurement noise level, the reconstructed parameters for the Gaussian function are (units are omitted)
The spatial parameters (location and size) do not have straightforward meanings for such an irregular-shaped object, but the spatial overlap between real target and reconstructed Gaussian extended target agree well, as shown in (see Fig. 5). The volume contrast is 26.74 mm2 for the irregular shaped object and 32.71 mm2 for the reconstructed Gaussian object. The relative error is 22%.
Fig. 5.
(a) Illustration of the 3-D reconstruction result of an irregularly shaped absorbing target. (b) Cross sections of the 3-D plot in x = 0 plane, y = 0 plane, and z = −10 plane. Dashed lines indicate the position of the real object.
C. Gaussian Target With Different Noise Levels
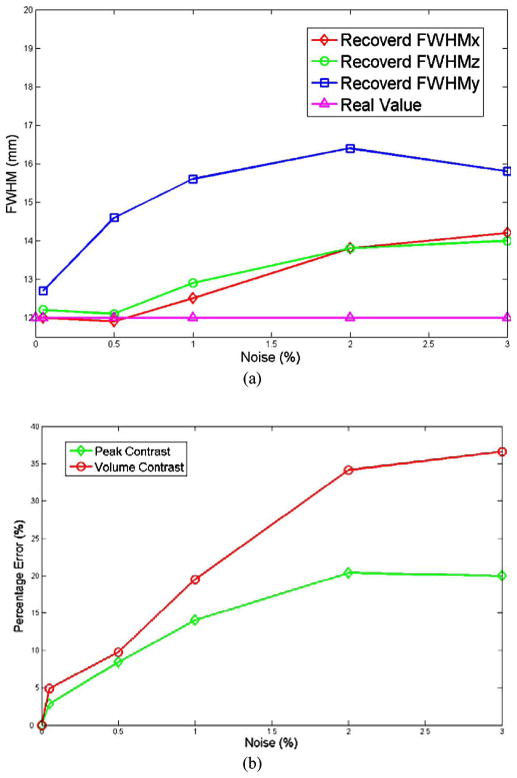
The parametric image reconstruction method was also tested on different measurement noise levels for a fixed Gaussian absorbing target, with its center located at (0, 5) mm in x–y plane, −12 mm in depth, and (12, 12, 12) mm for the FWHM in x-, y-, and z-directions, respectively. The peak optical absorption coefficient is 0.025 mm−1, 5× the background. The results are summarized in Table II.
TABLE II.
Reconstructed Parameters FOR THE Gaussian Absorbing Target FOR Noise Levels Ranging From 0.05% TO 3%
| Noise level | x,y (mm) | Depth (mm) | Size (mm) | Apeak (mm−1) | VC (mm2) |
|---|---|---|---|---|---|
| 0,5 | −12.0 | 12.0, 12.0, 12.0 | 0.025 | 41 | |
| 0.05% | 0.05, 5.35 | −12.2 | 12.0, 12.7, 12.2 | 0.0243 | 43 |
| 0.5% | 0.22, 5.83 | −12.1 | 11.9, 14.6, 12.1 | 0.0229 | 45 |
| 1% | 0.25, 6.20 | −12.2 | 12.5, 15.6, 12.9 | 0.0215 | 49 |
| 2% | 0.33, 6.78 | −12.1 | 13.8, 16.4, 13.8 | 0.0199 | 55 |
| 3% | 0.11, 6.42 | −11.8 | 14.2, 15.8, 14.0 | 0.0200 | 56 |
It is clear that the relative error of the reconstructed parameters increases with increasing noise levels. In addition, the recovered peak contrast drops as the noise level goes up, while the reconstructed size of the object (FWHM in x-, y-, z-directions) increases. The reconstructed FWHM in the y-direction is always bigger than FWHMs in x- and z-direction, possibly, a result of the design of the current probe (see Fig. 6). Finally, the recovered peak absorption drops along with the increasing noise level, but tends to approach a limit around 0.02 mm−1.
Fig. 6.
(a) Variation of reconstructed FWHM in x-, y-, and z-directions as a function of noise. (b) The variation of percentage errors of peak contrast and volume contrast as a function of noise.
V. Discussion
In contrast to conventional pixel-by-pixel image reconstruction methods, only several parameters characterizing the spatial distribution of optical contrast are reconstructed in parametric methods. Here, we have made the assumption that such a distribution is well described by a Gaussian function, which is not spatially confined. This assumption is based on clinical studies, using DOSI measurements, and therefore, relevant to reconstructing optical images. Moreover, it is well-known that diffuse optical images are inherently functional rather than structural and have limited resolution due to the randomness of the imaging medium. By such an assumption, we are able to enhance the performance of the image reconstruction process in terms of stability and speed, reducing the dimensionality of parameter space while minimizing the loss of spatial resolution. This is attractive because it may potentially ease the design of a reflectance tumor visualization probe by greatly reducing the total number of source–detector pairs.
In our simulation study, in case of a synthetic Gaussian absorbing target and with 1% measurement noise, the position can be recovered within an error of 1.5 mm, while the volume contrast has an error less than 14%. The method also performs well in the presence of model noise, e.g., the target is non-Gaussian, and in the presence of higher measurement noise. Moreover, our preliminary simulation has shown that the method is robust in the presence of background physiological noise, e.g., inhomogeneous optical absorption properties. In particular, with a 10% randomly distributed background noise in optical absorption coefficient, the tumor position can be recovered with an error around 1 mm and volume contrast has an error of 20% (based on one realization of the random background simulation and 1% measurement noise). A systematic analysis on the effect of background physiological noise, including both random and structural background heterogeneities, to the current method is necessary and will be studied.
Parametric optical image reconstruction can be easily extended in the following areas. First, tumor scattering properties can also be incorporated as a subsurface distribution characterized by fewer parameters. However, there is no clear clinical evidence that the reduced scattering coefficient follows the same spatial distribution as absorption properties. It is believed that variations in the scattering spectral features may encode morphologic and pathophysiologic changes in tissue at the microscopic level. A direct reconstruction of the distribution of scatterer densities and sizes may be more suitable for tumor optical scattering properties. Secondly, it is widely accepted that a stable tumor structure is composed of a hypoxic core with dead cells and a viable proliferating rim, which may induce heterogeneous optical contrast within the tumor region [36]. Such tumor internal optical contrast (i.e., internal heterogeneity) can be accounted for by introducing more sophisticated mathematical models with more parameters to increase the versatility of the description for tumors. One possible approach is to simply combine multiple concentric Gaussian distributions. Lastly, the proposed method is mathematically equivalent to expanding the tumor optical contrast on a single Gaussian basis. Multiple basis functions can be easily incorporated. However, it should be noted that by introducing more base functions, additional reconstruction parameters are introduced and the inverse problem is more ill-posed.
Acknowledgments
This work was supported in part by the Laser Microbeam and Medical Program, an National Institutes of Health Biomedical Technology Resource under Grant P41-RR01192; in part by the National Cancer Institute under Grant U54-CA136400; in part by the Beckman Foundation; and in part by the Military Photomedicine Program, Air Force Office of Scientific Research under Grant FA9550-08-1-0384.
Biographies
Jing Liu received the B.S. degree in physics from Nanjing University, Nanjing, China, in 2004. He is currently working toward the Ph.D. degree with the Department of Physics and Astronomy, University of California, Irvine, CA.
He is engaged as a Graduate Student Researcher with the Laser Microbeam and Medical Program, Beckman Laser Institute and Medical Clinic, University of California. His current research interests include developing and applying numerical and statistical methods in the fields of image analysis, image reconstruction, and optimal imaging system design.
Ang Li received the Ph.D. degree in medical physics from Tufts University, Boston, MA.
After three year Postdoctorship with the Laser Microbeam and Medical Program, Beckman Laser Institute and Medical Clinic, University of California, Irvine, CA, he started a company, Volighten Scientific, Inc., Salinas to commercialize diffuse optical spectroscopy imaging (DOSI). His current research interests include DOSI and is specialized in developing image reconstruction algorithms.

Albert E. Cerussi received the Ph.D. degree in physics from the University of Illinois at Urbana Champaign, Urbana, IL.
He was a Postdoctoral Researcher in biomedical optics with the Beckman Laser Institute, Irvine, CA, where he applied diffuse optical methods in breast cancer detection. He is currently with the Faculty of the Laser Microbeam and Medical Program, Beckman Laser Institute and Medical Clinic, University of California, where he is heavily involved in the theory, instrumentation and clinical application of diffuse optical spectroscopy, and imaging. His research interests include the application of optical methods to several medical areas including breast cancer, critical care medicine, neonatology, and metabolomics.

Bruce J. Tromberg received the B.A. degree in chemistry from Vanderbilt University, Nashville, TN, and the M.S. and Ph.D. degrees in chemistry from the University of Tennessee, Knoxville.
He was a U.S. Department of Energy Fellow with the Oak Ridge National Laboratory, Oak Ridge. He is the Director of the Laser Microbeam and Medical Program, Beckman Laser Institute and Medical Clinic, University of California, Irvine, CA and the Professor with the Departments of Biomedical Engineering and Surgery. He is Principal Investigator of the Laser Microbeam and Medical Program, a National Institutes of Health National Biomedical Technology Center, and is Editor-in-Chief of THE JOURNAL OF BIOMEDICAL OPTICS. He was a Hewitt Foundation Postdoctoral Fellow with the Beckman Laser Institute. His current research interests include the development and application of optical imaging and spectroscopy technologies for non and minimally-invasive imaging in biology and medicine.
Dr. Tromberg has been a member of the Beckman Faculty since 1990. He has received the Coherent Biophotonics Young Investigator Award, Optical Engineering magazine’s Technology Innovator Award, the R&D 100 Award, and is a Fellow of the International Society for Optical Engineering and the American Institute for Medical and Biological Engineers.
Contributor Information
Jing Liu, Email: jingl@uci.edu, Laser Microbeam and Medical Program, Beckman Laser Institute and Medical Clinic, University of California, Irvine, CA 92612 USA, and also with the Department of Physics and Astronomy, University of California, Irvine, CA 92697 USA.
Ang Li, Email: ang.li@volighten.com, Laser Microbeam and Medical Program, Beckman Laser Institute and Medical Clinic, University of California, Irvine, CA 92612 USA. He is now with the Volighten Scientific, Inc., Salinas, CA 93905 USA.
Albert E. Cerussi, Email: acerussi@uci.edu, Laser Microbeam and Medical Program, Beckman Laser Institute and Medical Clinic, University of California, Irvine, CA 92612 USA
Bruce J. Tromberg, Email: bjtrombe@uci.edu, Laser Microbeam and Medical Program, Beckman Laser Institute and Medical Clinic, University of California, Irvine, CA 92612 USA. He is also with the Department of Biomedical Engineering, University of California, Irvine, CA 92697 USA
References
- 1.Cerussi A, Shah N, Hsiang D, Durkin A, Butler J, Tromberg BJ. In vivo absorption, scattering, and physiologic properties of 58 malignant breast tumors determined by broadband diffuse optical spectroscopy. J Biomed Opt. 2006 Jul./Aug;11(4):044005. doi: 10.1117/1.2337546. [DOI] [PubMed] [Google Scholar]
- 2.Choe R, Corlu A, Lee K, Durduran T, Konecky SD, Grosicka-Koptyra M, Arridge SR, Czerniecki BJ, Fraker DL, DeMichele A, Chance B, Rosen MA, Yodh AG. Diffuse optical tomography of breast cancer during neoadjuvant chemotherapy: A case study with comparison to MRI. Med Phys. 2005 Apr;32(4):1128–1139. doi: 10.1118/1.1869612. [DOI] [PubMed] [Google Scholar]
- 3.Dehghani H, Pogue BW, Poplack SP, Paulsen KD. Multiwave-length three-dimensional near-infrared tomography of the breast: Initial simulation, phantom, and clinical results. Appl Opt. 2003 Jan;42(1):135–145. doi: 10.1364/ao.42.000135. [DOI] [PubMed] [Google Scholar]
- 4.Fantini S, Walker SA, Franceschini MA, Kaschke M, Schlag PM, Moesta KT. Assessment of the size, position, and optical properties of breast tumors in vivo by noninvasive optical methods. Appl Opt. 1998 Apr;37(10):1982–1989. doi: 10.1364/ao.37.001982. [DOI] [PubMed] [Google Scholar]
- 5.Spinelli L, Torricelli A, Pifferi A, Taroni P, Danesini GM, Cubeddu R. Bulk optical properties and tissue components in the female breast from multiwavelength time-resolved optical mammography. J Biomed Opt. 2004 Nov./Dec;9(6):1137–1142. doi: 10.1117/1.1803546. [DOI] [PubMed] [Google Scholar]
- 6.Jiang HB, Iftimia NV, Xu Y, Eggert JA, Fajardo LL, Klove KL. Near-infrared optical imaging of the breast with model-based reconstruction. Acad Radiol. 2002;9(2):186–194. doi: 10.1016/s1076-6332(03)80169-1. [DOI] [PubMed] [Google Scholar]
- 7.Fang QQ, Carp SA, Selb J, Boverman G, Zhang Q, Kopans DB, Moore RH, Miller EL, Brooks DH, Boas DA. Combined optical imaging and mammography of the healthy breast: Optical contrast derived from breast structure and compression. IEEE Trans Med Imag. 2009 Jan;28(1):30–42. doi: 10.1109/TMI.2008.925082. [DOI] [PMC free article] [PubMed] [Google Scholar]
- 8.Gibson AP, Hebden JC, Arridge SR. Recent advances in diffuse optical imaging. Phys Med Biol. 2005 Feb;50(4):R1–R43. doi: 10.1088/0031-9155/50/4/r01. [DOI] [PubMed] [Google Scholar]
- 9.Tromberg BJ, Pogue BW, Paulsen KD, Yodh AG, Boas DA, Cerussi AE. Assessing the future of diffuse optical imaging technologies for breast cancer management. Med Phys. 2008 Jun;35(6):2443–2451. doi: 10.1118/1.2919078. [DOI] [PMC free article] [PubMed] [Google Scholar]
- 10.Pham TH, Coquoz O, Fishkin JB, Anderson E, Tromberg BJ. Broad bandwidth frequency domain instrument for quantitative tissue optical spectroscopy. Rev Sci Instrum. 2000 Jun;71(6):2500–2513. [Google Scholar]
- 11.Kukreti S, Cerussi A, Tromberg B, Gratton E. Intrinsic tumor biomarkers revealed by novel double-differential spectroscopic analysis of near-infrared spectra. J Biomed Opt. 2007 Mar./Apr;12(2):020509. doi: 10.1117/1.2709701. [DOI] [PubMed] [Google Scholar]
- 12.Chung SH, Cerussi AE, Klifa C, Baek HM, Birgul O, Gulsen G, Merritt SI, Hsiang D, Tromberg BJ. In vivo water state measurements in breast cancer using broadband diffuse optical spectroscopy. Phys Med Biol. 2008 Dec;53(23):6713–6727. doi: 10.1088/0031-9155/53/23/005. [DOI] [PMC free article] [PubMed] [Google Scholar]
- 13.Arridge SR. Optical tomography in medical imaging. Inv Problems. 1999 Apr;15(2):R41–R93. [Google Scholar]
- 14.Pogue BW, McBride TO, Prewitt J, Osterberg UL, Paulsen KD. Spatially variant regularization improves diffuse optical tomography. Appl Opt. 1999 May;38(13):2950–2961. doi: 10.1364/ao.38.002950. [DOI] [PubMed] [Google Scholar]
- 15.Li A, Miller EL, Kilmer ME, Brukilacchio TJ, Chaves T, Stott J, Zhang Q, Wu T, Chorlton M, Moore RH, Kopans DB, Boas DA. Tomographic optical breast imaging guided by three-dimensional mammography. Appl Opt. 2003;42(25):5181–5190. doi: 10.1364/ao.42.005181. [DOI] [PubMed] [Google Scholar]
- 16.Brooksby BA, Dehghani H, Pogue BW, Paulsen KD. Near-infrared (NIR) tomography breast image reconstruction with a priori structural information from MRI: Algorithm development for reconstructing heterogeneities. IEEE J Sel Topics Quantum Electron. 2003 Mar./Apr;9(2):199–209. [Google Scholar]
- 17.Zhu Q, Durduran T, Ntziachristos V, Holboke M, Yodh AG. Imager that combines near-infrared diffusive light and ultrasound. Opt Lett. 1999 Aug;24(15):1050–1052. doi: 10.1364/ol.24.001050. [DOI] [PubMed] [Google Scholar]
- 18.Guven M, Yazici B, Intes X, Chance B. Diffuse optical tomography with a priori anatomical information. Phys Med Biol. 2005 Jun;50(12):2837–2858. doi: 10.1088/0031-9155/50/12/008. [DOI] [PubMed] [Google Scholar]
- 19.Holboke MJ, Tromberg BJ, Li X, Shah N, Fishkin J, Kidney D, Butler J, Chance B, Yodh AG. Three-dimensional diffuse optical mammography with ultrasound localization in a human subject. J Biomed Opt. 2000 Apr;5(2):237–247. doi: 10.1117/1.429992. [DOI] [PubMed] [Google Scholar]
- 20.Gu X, Ren K, Masciotti JM, Hielscher AH. Parametric image reconstruction using the discrete cosine transform for optical tomography. Optical Tomography and Spectroscopy of Tissue VI. In: Chance B, Alfano RR, Tromberg BJ, Tamura M, Sevick-Muraca EM, editors. Proc SPIE Int Symp Biomed Opt. Vol. 6434. 2007. p. 64342B. [Google Scholar]
- 21.Kolehmainen V, Arridge SR, Vauhkonen M, Kaipio JP. Simultaneous reconstruction of internal tissue region boundaries and coefficients in optical diffusion tomography. Phys Med Biol. 2000 Nov;45(11):3267–3283. doi: 10.1088/0031-9155/45/11/311. [DOI] [PubMed] [Google Scholar]
- 22.Zacharopoulos AD, Arridge SR, Dorn O, Kolehmainen V, Sikora J. Three-dimensional reconstruction of shape and piecewise constant region values for optical tomography using spherical harmonic parametrization and a boundary element method. Inv Problems. 2006 Oct;22(5):1509–1532. [Google Scholar]
- 23.Kilmer ME, Miller EL, Barbaro A, Boas DA. Three-dimensional shape-based imaging of absorption perturbation for diffuse optical tomography. Appl Opt. 2003;42(16):3129–3144. doi: 10.1364/ao.42.003129. [DOI] [PubMed] [Google Scholar]
- 24.Li A, Liu J, Tanarnai W, Kwong R, Cerussi AE, Tromberg BJ. Assessing the spatial extent of breast tumor intrinsic optical contrast using ultrasound and diffuse optical spectroscopy. J Biomed Opt. 2008 May/Jun;13(3):030504. doi: 10.1117/1.2937471. [DOI] [PMC free article] [PubMed] [Google Scholar]
- 25.Chandrasekhar S. Radiative Transfer. New York: Dover; 1960. [Google Scholar]
- 26.Haskell RC, Svaasand LO, Tsay TT, Feng TC, McAdams MS, Tromberg BJ. Boundary-conditions for the diffusion equation in radiative-transfer. J Opt Soc Amer A-Opt Image Sci Vis. 1994;11:2727–2741. doi: 10.1364/josaa.11.002727. [DOI] [PubMed] [Google Scholar]
- 27.Fantini S, Franceschini MA, Gratton E. Semi-infinite-geometry boundary-problem for light migration in highly scattering media—A frequency-domain study in the diffusion-approximation. J Opt Soc Amer B-Opt Phys. 1994;11:2128–2138. [Google Scholar]
- 28.Arridge SR, Schweiger M, Hiraoka M, Delpy DT. A finite-element approach for modeling photon transport in tissue. Med Phys. 1993 Mar./Apr;20:299–309. doi: 10.1118/1.597069. [DOI] [PubMed] [Google Scholar]
- 29.Schweiger M, Arridge SR, Hiraoka M, Delpy DT. The finite-element method for the propagation of light in scattering media—Boundary and source conditions. Med Phys. 1995;22:1779–1792. doi: 10.1118/1.597634. [DOI] [PubMed] [Google Scholar]
- 30.Bhatti MA. Fundamental Finite Element Analysis and Applications: With Mathematica and MATLAB Computations. New York: Wiley; 2005. [Google Scholar]
- 31.Tarantola A. Inverse Problem Theory and Methods for Model Parameter Estimation. Philadelphia, PA: SIAM; 2005. [Google Scholar]
- 32.Arridge SR, Kaipio JP, Kolehmainen V, Schweiger M, Somersalo E, Tarvainen T, Vauhkonen M. Approximation errors and model reduction with an application in optical diffusion tomography. Inv Problems. 2006 Feb;22:175–195. doi: 10.1109/IEMBS.2006.260738. [DOI] [PubMed] [Google Scholar]
- 33.Nocedal J, Wright SJ. Numerical Optimization. 2. New York: Springer-Verlag; 2006. [Google Scholar]
- 34.Yalavarthy PK, Lynch DR, Pogue BW, Dehghani H, Paulsen KD. Implementation of a computationally efficient least-squares algorithm for highly under-determined three-dimensional diffuse optical tomography problems. Med Phys. 2008 May;35:1682–1697. doi: 10.1118/1.2889778. [DOI] [PMC free article] [PubMed] [Google Scholar]
- 35.Kaipio J, Somersalo E. Statistical inverse problems: Discretization, model reduction and inverse crimes. J Comput Appl Math. 2007 Jan;198(2):493–504. [Google Scholar]
- 36.Frieboes HB, Zheng X, Sun CH, Tromberg B, Gatenby R, Cristini V. An integrated computational/experimental model of tumor invasion. Cancer Res. 2006;66:1597–1604. doi: 10.1158/0008-5472.CAN-05-3166. [DOI] [PubMed] [Google Scholar]


