

Abstract
Tydemania expeditionis Weber-van Bosse (Udoteaceae) is a weakly calcified green alga. In the present paper, liquid chromatography coupled with photodiode array detection and electrospray mass spectrometry was developed to identify the fingerprint components. A total of four triterpenoid sulfates and three hydroxy fatty acids in the ethyl acetate fraction of the crude extract were structurally characterized on the basis of retention time, online UV spectrum and mass fragmentation pattern. Furthermore, detailed LC-MS analysis revealed two new hydroxy fatty acids, which were then prepared and characterized by extensive NMR analyses. The proposed method provides a scientific and technical platform for the rapid identification of triterpenoid sulfates and hydroxy fatty acids in similar marine algae and terrestrial plants.
Keywords: Tydemania expeditionis, Liquid chromatography-mass spectrometry, triterpenoid sulfate, hydroxy fatty acid, fingerprinting analysis
Introduction
Triterpenoid sulfates are featured by the covalent linkage from a triterpenoid moiety to one or more inorganic sulfate groups via C–O–S bonds. Compounds of this class have been found in both terrestrial plants, e.g. Fagonia arabica[1] and Schefflera heptaphylla,[2] and marine organisms, e.g. Tricleocarpa Fragilis[3] and Penicillus capitatus.[4] Some of them have been found to show antiviral[2] and anticancer activities.[5]
Hydroxy fatty acids are characterized by the presence of one or more hydroxyl groups in the fatty acid chain. Though this kind of compounds were found to exist in terrestrial plants, marine alga, animals and microorganisms, they are less common as compared with common fatty acids. Because of the hydroxylation, hydroxy fatty acids are significantly more polar than the corresponding fatty acid and possessed unique biological activities, for examples, antineoplastic[6] and antimicrobial[7] activities and some of them can be used as probes for diagnosing diseases.[8]
Tydemania expeditionis Weber-van Bosse (Udoteaceae) is a weakly calcified green alga. It is distributed in the tropical Pacific and Indian Oceans. Previous phytochemical studies on this species led to the isolation of norcyloartene triterpenoids,[9] linear diterpenoid,[10] and cycloartanol sulfates with inhibitory activity against the pp60v-rsc protein tyrosine kinase.[11] Our recent study on this alga resulted in the isolation and identification of four triterpenoid sulfates with antifungal activity[12] and three hydroxy fatty acids with inhibitory activities against a range of cancer cells[13]. Furthermore, we found that the both the triterpenoid sulfates and hydroxy fatty acids showed characteristic fragmentation patterns and can be used to search for similar components from marine or terrestrial sources.
LC-MS is a hyphenated technique which combines both liquid chromatographic separation and structure identification based on mass spectrometry. Though this technique has been widely used for the fingerprinting analyses of carotenoids[14], isoflavonoid[15] and toxins[16,17] in marine algae, the analyses of triterpenoid sulfates and hydroxy fatty acids were not reported. Herein, we report the fragmentation patterns of both kinds of compounds and the rapid identification of these compounds from Tydemania expeditionis by LC-MS analysis.
Experimental
Chemicals and Reagents
LC grade acetonitrile (Tedia, USA) was used for the HPLC analysis. Water prepared with a Millipore Milli-Q SP purification system (Millipore, France) was used during sample preparation procedures and HPLC analyses. Cycloartan-3,23,29-triol 3,29-disodium sulfate (1) and 3(ζ)-hydroxy-octadeca-4(E),6(Z),15(Z)-trienoic acid (8) were chosen as standards (Fig. 1), which were isolated from T. expeditionis in our laboratory and were identified based on spectral (NMR and MS) analysis in combination with X-ray crystallographic analysis.[12,13]
Fig. 1.

Structural formulae of compounds 1-9
Collection of Samples
T. expeditionis was collected in Kadavu Province of Fiji (GPS location: 18° 46.370’ S and 178° 27.746’ E). Specimens (G-2004-06-45) were identified by Dr. Posa Skelton at University of South Pacific, and deposited at the University of the South Pacific.
Sample Preparation
The pulverized alga (100 g) was extracted under supersonic conditions with methanol (500 mL) for an hour. The extracting process was repeated three times. The extraction solutions were combined, filtered, and evaporated under vacuum to afford the crude extract, which is suspended in distilled water and extracted by hexane, ethyl acetate and butanol successively. The ethyl acetate fraction was dissolved in methanol to make a solution 1 mg/ml. The solution was filtered through a 0.22 μm PTFE syringe filter, and an aliquot of filtrate (10μL) was injected into the LC/MS instrument for analysis.
Equipment and Chromatographic Conditions
The HPLC chromatograms and online UV spectra were acquired on a Waters 2690 system consisting of a vacuum degasser, quaternary pump, autosampler and DAD detector. Separation was achieved with an Alltech Alltima C18 reversed-phase column (3 μm, 2.1 × 150 mm). The mobile phase used was water (A) and acetonitrile (B). Binary gradient was programmed as follows: 0–53 min, linear 10→70% B; 53–60 min: linear 70→100% B and 60–63 min, linear 100→10% B. UV detections were at 215 and 235 nm. The effluent from HPLC directly entered the ESI source.
The ESI–MS spectra were acquired in negative ion modes on a Micromass ZQ 2000 instrument. The mass spectrometry detector parameters were set as follows: Ion source temperature 100°C, desolvation temperature 400°C, spray voltage 3.5 kV, cone voltage 40.0 V, full scan (m/z 50–700) with 500 ms collection time, desolvation gas 300 L/hour, cone gas 50 L/hour and the optimized relative collision energies 50%.
Peaks 1 and 8 were identified by directly comparison with the standard compounds. For the peaks 2-7 and 9 with no available standards for reference, the identities were assigned by comparing the retention time and molecular weight of chemicals in literatures, and by interpretation of the mass spectra. For the new compounds 5 and 6, extensive NMR spectral analyses were further used to support the structural elucidation.
Semipreparative HPLC
Semi-preparative HPLC was performed on a Waters 2695 system equipped with 2996 diode-array UV detection. Mixture of compounds 5-6 (retention time 42.2-43.0 min) was purified using an Agilent Zorbax SB-C18 reversed-phase column (5 μm, 9.4 × 250 mm) utilizing the same gradient of aqueous acetonitrile as that used in the LC-MS analysis with detection at 215 nm.
NMR Spectroscopy
NMR spectra were acquired on a Bruker DRX-500 spectrometer equipped with a 5 mm broadband probe. All NMR spectra were recorded at ambient temperature in CD3OD, and were referenced to the residual light solvent (δH3.31 and δC 49.0 for methanol). Chemical shifts were given on the δ scale. For 1H NMR, 64 transients were acquired with 1.0 s relaxation delay and 10330.6 Hz spectral width. For 13C NMR, 17554 transients were acquired with 2.0 s relaxation delay and 30030.0 Hz spectral width. Both the 1H–1H magnitude-mode ge-2D COSY spectrum and the phase-sensitive ge-2D HSQC spectrum was acquired over 1 K data points in F2 and 256 data points in F1, using standard Bruker library pulse sequence (cosygpqf and hsqcetgpsi2, respectively). The Magnitude-mode ge-2D HMBC spectrum was recorded over 2 K data points in F2 and 256 data points in F1, also using the standard Bruker pulse program (hmbcgplpndqf).
Results and Discussion
Fragmentation behavior of pure triterpenoid sulfate and hydroxy fatty acid
The authentic samples of cycloartan-3,23,29-triol 3,29-disodium sulfate (1) [13] and 3(ζ)-hydroxy-octadeca-4(E),6(Z),15(Z)-trienoic acid (8) [12] were studied by ESI-MS in the negative mode.
Compound 1, as a typical example of lanostane-type triterpenoid sulfate, gave the base peak [M–46]2- at m/z 309, a characteristic double charge ion for the disulfates by loss of two sodium ions. Compound 1 formed a precursor ion at m/z 641 [M–Na]- by loss of a sodium ion which further fragmented into a secondary ion, at m/z 619, by loss of the second sodium ion followed by capture of a proton. Then fragment ions at m/z 539, 521 (Table 1) were generated by loss of a neutral sulfur trioxide and a water molecules from the secondary ion, successively. It was interesting to note that protonation of sulfate compound 1, after the loss of sodium ion, might resulted from the surface enrichment of electrolytically produced protons in the ionization droplets, which was similar to the protonation of caffeine in neutral solution[18]. The mass spectrum of 1 was shown in Fig. 2a and the fragmentation mechanism was proposed in Fig 2b.
Table 1.
Main fragment ions observed by negative ESI-MS analysis of compounds 1-9 from Tydemania expeditionis
| Peak | tR min | Molecular weight | UV λmax (nm) | Fragment ions (m/z) | Identification |
|---|---|---|---|---|---|
| 1 | 19.1 | 664 | - | 309, 641, 619, 539, 521 | cycloartan-3,23,29-triol 3,29-disodium sulfate |
| 2 | 19.8 | 660 | 235 | 307, 637, 615, 535, 517 | cycloart-24-en-3,29-diol-23-one 3,29-disodium sulfate |
| 3 | 21.3 | 662 | - | 308, 639, 617, 537, 519 | cycloartan-3,29-diol-23-one 3,29-disodium sulfate |
| 4 | 22.1 | 662 | 215 | 308, 639, 617, 537, 519 | lanosta-8-en-3,29-diol-23-one 3,29-disodium sulfate |
| 5 | 42.7 | 266 | 234 | 265, 247 | 3(ζ)-hydroxy- hexadeca-4(E),6(Z),13(Z)-trienoic acid |
| 6 | 42.9 | 310 | - | 309. 291 | 3(ζ)-hydroxy-octadeca-4,5-cis-epoxy-6(Z),15(Z)-dienoic acid |
| 7 | 45.9 | 268 | 233 | 267, 249 | 3(ζ)-hydroxy- hexadeca-4(E),6(Z)-dienoic acid |
| 8 | 49.9 | 294 | 235 | 293, 275 | 3(ζ)-hydroxy-octadeca-4(E),6(Z),15(Z)-trienoic acid |
| 9 | 53.4 | 296 | 234 | 295, 277 | 3(ζ)-hydroxy-octadeca-4(E),6(Z)-dienoic acid |
Note: “-” means no significant absorption among 200-400 nm.
Fig.2.

ESI negative ion mass spectrum (a) of compound 1 and the proposed fragmentation pathway (b)
The mass spectrum of 3(ζ)-hydroxy-octadeca-4(E),6(Z),15(Z)-trienoic acid (8) showed [M–H]- at m/z 293 as the base peak, a common deprotonation ion for the carboxylic acid, and [M-H-H2O]- by further loss of a water molecule at m/z 275, indicative of the presence of a hydroxy group. The mass spectrum of 8 was shown in Fig. 3a and the fragmentation mechanism was proposed in Fig. 3b.
Fig.3.

ESI negative ion mass spectrum (a) of compound 8 and the proposed fragmentation pathway (b)
Identification of triterpenoid sulfates and hydroxy fatty acids in Fingerprint Chromatograms
On-line LC–MS was utilized to determine the constituents in the ethyl acetate fraction of the crude extracts of T. expeditionis. The fragmentation rules of the triterpenoid sulfate 1 and hydroxy fatty acid 8 could be used to characterize similar structures. The LC profiles of T. expeditionis included nine major peaks 1 - 9 and are shown in Fig. 4. Peaks 1 and 8 were identified as cycloartan-3,23,29-triol 3,29-disodium sulfate and 3(ζ)-hydroxy-octadeca-4(E),6(Z),15(Z)-trienoic acid, respectively (Table 1), by directly comparison with the standard compounds.
Fig. 4.

HPLC chromatograms at 235 nm (a), 215 nm (b) and LC-MS trace (c) of the ethyl acetate fraction of T. expeditionis
Peaks 2-4 showed similar fragmentation patterns as peak 1. All of them gave the characteristic double charge ion by loss of two sodium ions as the base peak, and formed the precursor ion by loss of a sodium ion, which further fragmented into a secondary ion by loss of the second sodium ion followed by capture of a proton. Fragment ions due to the sequential loss of a neutral sulfur trioxide and water molecule from the secondary ions were also observed (Table 1). With regard compound to 2, these characteristic fragments were at m/z 307, 637, 615, 535 and 517, respectively, indicating that the molecular weight of 2 was four units smaller than compound 1. Likewise the mass spectra of compounds 3 and 4 were characterized by the ions at m/z 308, 639, 617, 537 and 519, indicating they possessed the same molecular weight, that was two units smaller than compound 1 (Table 1). In addition, peak 2 showed strong UV absorbance at both 215 nm and 235 nm, peak 4 showed strong UV absorbance at only 215 nm, while peak 3 showed only very weak UV absorbance at both wavelengths. Accordingly, peaks 2-4 could be elucidated as cycloart-24-en-3,29-diol-23-one 3,29-disodium sulfate (2), cycloartan-3,29-diol-23-one 3,29-disodium sulfate (3) and lanosta-8-en-3,29-diol-23-oxo-3,29-disodium sulfate (4) by referring the retention time, molecular weight, fragmentation pattern and UV spectra to the literature.[13]
Peaks 7 and 9 showed similar fragmentation patterns as that of peak 8. Both of them formed precursor ion by loss of a proton and further fragment ions by the loss of a water molecule. The characteristic ions for 7 were [M–H]- at m/z 267 and [M- H-H2O]- at m/z 249 indicating that the molecular weight was 268. The corresponding ions for 9 were [M–H]- at m/z 295 and [M- H-H2O]- at m/z 277, indicating a molecular weight 296. Both 7 and 9 showed strong UV absorbance at both 215 and 235 nm indicating the presence of a chromophore in the molecules. Referring to the literature,[12] 7 and 9 could be identified as 3(ζ)-hydroxy-hexadeca-4(E),6(Z)-dienoic acid and 3(ζ)-hydroxy-octadeca-4(E),6(Z)-dienoic acid, respectively.
The retention times of peaks 5 and 6 were very close to each other. Peak 5 showed strong UV absorbance at both 215 and 235 nm indicating the presence of a chromophore in the molecule. In contrast, 6 only had very weak absorption at both wavelengths. The negative ESI spectra of 5 and 6 showed similar [M-H]- and [M-H-H2O]- peaks (265 and 247 for 5; 309 and 291 for 6) as those of 7-9, suggesting that they were hydroxy fatty acids. The molecular weight of 5 is 266, which is 2 units less than that of peak 7, suggesting the presence of an additional double bond as compared with 7. The molecular weight of 6 is 310, which is 16 units larger than that of peak 8, suggesting that one of the double bond in 8 might be oxidized into an epoxide ring. Thus detailed LC-MS analysis revealed two new hydroxyl fatty acids.
In order to further confirm the new structures of 5 and 6, we used semi-preparative HPLC to collect the peaks. Due to the close retention time, they were analyzed as a mixture. The quantity ratio was inferred to be 1:1 as shown by the similar intensity of the hydroxylated proton signals (δ 4.10 and 4.16) in the 1H NMR spectrum (Fig. 5).
Fig. 5.

The negative ESI-MS (a), UV spectrum (b), 1H-NMR (c) and 13C-NMR (d) of mixture 5-6
Both the 1H and 13C NMR spectrum of the mixture indicated ten olefinic methines (δH 5.3-6.5; δC 123.7-136.7), two hydroxy methines (δH-3 4.10, dd, J= 12.5, 6.0 Hz; δC-3 73.3) and (δH-3’, 4.16, ddd, J= 2.5, 6.0, 8.5 Hz; δC-3’ 69.3) and two epoxide methines (δH-4’ 2.76 dd, J= 2.0, 6.0 Hz; δC-4’ 62.4) and (δH-5’ 2.87, dt, J= 2.0, 6.0 Hz, δC-5’ 57.0), a methylene envelope (δH 1.33; δC 28.6-30.7), and two terminal methyls group (δH 0.95, t, J= 8.0 Hz,; δC 14.5 and 14.6). Thus the 1H NMR and 13C NMR spectra of the mixture were very similar to those of 8 which was identified previously from this alga.[12]
Bearing the mass spectrometry of 5 and 6 in hand, six olefinic methines and one hydroxy methine could be assigned to peak 5. Because of the similar NMR and UV spectra and mass fragmentation behavior to 8, peak 5 was inferred to have the same double bond pattern in the molecule. Accordingly, peak 5 was tentatively assigned as 3(ζ)-hydroxy- hexadeca-4(E),6(Z),13(Z)-trienoic acid.
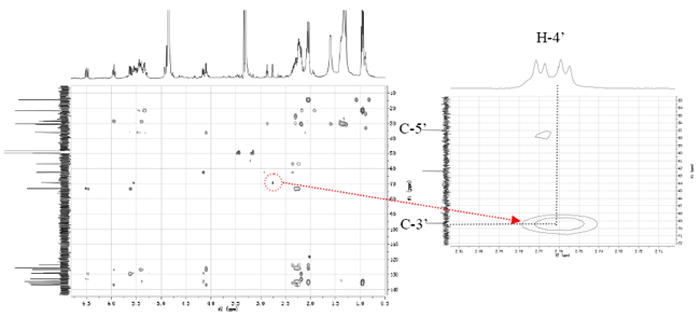
By using the 1H-1H COSY spectrum (Fig. 6), the hydroxylated methine signal δ4.16 (H-3’) and the epoxide signals δ2.76 (H-4’) and 2.87 (H-5’) could be assigned to peak 6. H-4’ showed cross-peaks with H-3’, which suggested that the epoxide ring was adjacent to the hydroxy group at C-3’. In the HMBC spectrum (Fig. 7), the epoxide proton H-4’ showed correlations to C-3’ (δ 69.3), which further confirmed that the epoxide ring was adjacent to the hydroxy group at C-3’. Accordingly, the structure of peak 6 was established as 3(ζ)-hydroxy-octadeca-4,5-cis-epoxy-6(Z),15(Z)-dienoic acid.
Fig. 6.

1H-1H COSY spectrum of mixture 5-6 showing the correlation between H-4’ and H-3’
Fig. 7.
HMBC spectrum of mixture 5-6 showing the correlation between H-4’ and C-3’
Conclusions
For the first time, fragmentation behavior of triterpenoid sulfate and hydroxy fatty acid were investigated using negative ion ESI–MS analyses on the standard compounds, and the corresponding fragmentation rules were used to identify other triterpenoid sulfates and hydroxy fatty acids in the fingerprint of T. expeditionis. The fragmentation patterns of the triterpenoid sulfates and hydroxy fatty acids were characteristic and reproducible, could be used for the rapid characterization of these kinds of compounds in other similar algae or terrestrial plants. Furthermore, detailed LC-MS analysis revealed two new hydroxy fatty acids. These two compounds were characterized by extensive NMR analyses. Results of the current investigation showed that LC-MS could also be used for the rapid discovery of new constituents in the marine algae for phytochemical study.
Acknowledgments
This work was supported by the National Natural Science Foundation of China (30801433), New Century Excellent Talents Scheme of the ministry of education (NCET-08-0612 to R. W. J.), the Fundamental Research Funds for the Central Universities (21609202) and U.S. National Institutes of Health’s International Cooperative Biodiversity Groups program (grant U01-TW007401).
References
- 1.Perrone A, Masullo M, Bassarello C, Hamed AI, Belisario MA, Pizza C, Piacente S. Sulfated Triterpene Derivatives from Fagonia arabica. J Nat Prod. 2007;70:584. doi: 10.1021/np060531m. [DOI] [PubMed] [Google Scholar]
- 2.Li YL, Jiang RW, Ooi LSM, But PPH, Ooi VEC. Antiviral triterpenoids from the medicinal plant Schefflera heptaphylla. Phytother Res. 2007;21:466. doi: 10.1002/ptr.1962. [DOI] [PubMed] [Google Scholar]
- 3.Horgen FD, Sakamoto B, Scheuer PJ. New triterpenoid sulfates from the red alga Tricleocarpa fragilis. J Nat Prod. 2000;63:210. doi: 10.1021/np990448h. [DOI] [PubMed] [Google Scholar]
- 4.Puglisi MP, Tan LT, Jensen PR, Fenical W. Capisterones A and B from the tropical green alga Penicillus capitatus: unexpected antifungal defenses targeting the marine pathogen Lindra thallasiae. Tetrahedron. 2004;60:7035. [Google Scholar]
- 5.Zhang SY, Yi YH, Tang HF. Cytotoxic sulfated triterpene glycosides from the sea cucumber Pseudocolochirus violaceus. Chem Biodiver. 2006;3:807. doi: 10.1002/cbdv.200690083. [DOI] [PubMed] [Google Scholar]
- 6.Abe A, Sugiyama K. Growth inhibition and apoptosis induction of human melanoma cells by ω- hydroxy fatty acids. Anti-Cancer Drugs. 2005;16:543. doi: 10.1097/00001813-200506000-00010. [DOI] [PubMed] [Google Scholar]
- 7.Shin SY, Kim HR, Kang SC. Antibacterial activity of various hydroxy fatty acids bioconverted by Pseudomonas aeruginosa PR3. Agric Chem Biotech. 2004;47:205. [Google Scholar]
- 8.Ferrando R, Szponar B, Sanchez A, Larsson L, Valero-Guillen PL. 3-Hydroxy fatty acids in saliva as diagnostic markers in chronic periodontitis. J Microbiol Methods. 2005;62:285. doi: 10.1016/j.mimet.2005.04.014. [DOI] [PubMed] [Google Scholar]
- 9.Paul VJ, Fenical W, Raffii S, Clardy J. The isolation of new norcycloartene triterpenoids from the tropical marine alga Tydemania expeditionitis (Chlorophyta) Tetrahedron Lett. 1982;23:3459. [Google Scholar]
- 10.Paul VJ, Fenical W. Diterpenoid metabolites from Pacific marine algae of the order Caulerpales (Chlorophyta) Phytochemistry. 1985;24:2239. [Google Scholar]
- 11.Govindan M, Abbas SA, Schmitz FJ, Lee RH, Papkoff JS, Slate D. New cycloartanol sulfates from the alga Tydemania expeditionis: inhibitors of the protein tyrosine kinase pp60v-src. J Nat Prod. 1994;57:74. doi: 10.1021/np50103a010. [DOI] [PubMed] [Google Scholar]
- 12.Jiang RW, Hay ME, Fairchild CR, Prudhomme J, Roch KL, Aalbersberg W, Kubanek J. Antineoplastic unsaturated fatty acids from Fijian macroalgae. Phytochemistry. 2008;69:2495. doi: 10.1016/j.phytochem.2008.07.005. [DOI] [PMC free article] [PubMed] [Google Scholar]
- 13.Jiang RW, Lane AL, Mylacraine L, Hardcastle KI, Fairchild CR, Aalbersberg W, Hay ME, Kubanek J. Structures and Absolute Configurations of Sulfate-Conjugated Triterpenoids Including an Antifungal Chemical Defense of the Green Macroalga Tydemania expeditionis. J Nat Prod. 2008;71:1616. doi: 10.1021/np800307h. [DOI] [PMC free article] [PubMed] [Google Scholar]
- 14.Ranga R, Sarada AR, Baskaran V, Ravishankar GA. Identification of carotenoids from green alga Haematococcus pluvialis by HPLC and LC-MS (APCI) and their antioxidant properties. J Microbiol Biotechnol. 2009;19:1333. [PubMed] [Google Scholar]
- 15.Klejdus B, Lojkova L, Plaza M, Snoblova M, Sterbova D. Hyphenated technique for the extraction and determination of isoflavones in algae: Ultrasound-assisted supercritical fluid extraction followed by fast chromatography with tandem mass spectrometry. J Chromatogr A. 2010;1217:7956–7965. doi: 10.1016/j.chroma.2010.07.020. [DOI] [PubMed] [Google Scholar]
- 16.Gerssen A, Mulder PPJ, de Boer J. Screening of lipophilic marine toxins in shellfish and algae: Development of a library using liquid chromatography coupled to orbitrap mass spectrometry. Anal Chim Acta. 2011;685:176–185. doi: 10.1016/j.aca.2010.11.036. [DOI] [PubMed] [Google Scholar]
- 17.Hummert C, Rühl A, Reinhardt K, Gerdts G, Luckas B. Simultaneous analysis of different algal toxins by LC-MS. Chromatographia. 2002;55:673. [Google Scholar]
- 18.Zhou S, Cook KD. Protonation in Electrospray Mass Spectrometry: Wrong-Way-Round or Right-Way-Round? J Am Soc Mass Spectrom. 2000;11:961–966. doi: 10.1016/S1044-0305(00)00174-4. [DOI] [PubMed] [Google Scholar]