

Abstract
BACKGROUND AND PURPOSE:
Measurements of resting-state functional connectivity have increasingly been used for characterization of neuropathologic and neurodevelopmental populations. We collected data to characterize how much imaging time is necessary to obtain reproducible quantitative functional connectivity measurements needed for a reliable single-subject diagnostic test.
MATERIALS AND METHODS:
We obtained 100 five-minute BOLD scans on a single subject, divided into 10 sessions of 10 scans each, with the subject at rest or while watching video clips of cartoons. These data were compared with resting-state BOLD scans from 36 healthy control subjects by evaluating the correlation between each pair of 64 small spheric regions of interest obtained from a published functional brain parcellation.
RESULTS:
Single-subject and group data converged to reliable estimates of individual and population connectivity values proportional to 1 / sqrt(n). Dramatic improvements in reliability were seen by using ≤25 minutes of imaging time, with smaller improvements for additional time. Functional connectivity “fingerprints” for the individual and population began diverging at approximately 15 minutes of imaging time, with increasing reliability even at 4 hours of imaging time. Twenty-five minutes of BOLD imaging time was required before any individual connections could reliably discriminate an individual from a group of healthy control subjects. A classifier discriminating scans during which our subject was resting or watching cartoons was 95% accurate at 10 minutes and 100% accurate at 15 minutes of imaging time.
CONCLUSIONS:
An individual subject and control population converged to reliable different functional connectivity profiles that were task-modulated and could be discriminated with sufficient imaging time.
Since the discovery that functionally related brain regions show synchronized fluctuations in BOLD signal intensity,1 fcMRI has emerged as a useful tool in identifying the organization of network-level brain architecture.2–4 There is increasing use of fcMRI to characterize neurodevelopmental and neuropathologic conditions on the basis of differences in brain network anatomy and functional network connectivity. Differences in group means in specific or aggregate metrics of functional connectivity between brain regions have been reported in dementia,5–7 autism,8–15 Tourette syndrome,16 schizophrenia,17–21 obsessive compulsive disorder,22 and multiple sclerosis,23,24 among other conditions.
Identifying such abnormalities in disease populations helps characterize the pathophysiology of the disease but is of little use in diagnosis, endophenotype development, genome-wide association studies, prognosis, and treatment monitoring unless such metrics can be reliably obtained from individual subjects. Basic science studies investigating changes in brain connectivity in development and aging would also greatly benefit from robust single-subject metrics. Classification of pathologic or cognitive states also requires reliability at the level of individual subjects. Yet the extent to which functional connectivity measurements are reproducible and key questions related to experimental design such as necessary scanning duration and choice of task have only recently been subjects of investigation.
Core network anatomy of resting-state networks is preserved across subjects, with reproducible qualitative identification of key anatomic relationships, such as in the default mode and attentional networks.25 A study by using independent-component analysis to define resting-state networks in 14 patients each with 5 scans showed similar boundaries of key resting-state networks across sessions, with a voxelwise analysis showing approximately 20% of voxels exhibiting a main effect of session.26
Test-retest studies have been performed on a small number of scans from many subjects. A study in which 3 scans were obtained on 26 subjects found moderate reproducibility, depending on the strength of the correlation between measurements and the network in which the correlate brain regions were located.27 In a study assessing reliability as a function of imaging time, reliability measures decreased with the square root of imaging time, with intersession correlation improving from 0.7 to 0.85 when 40 minutes of imaging time was used instead of 5 minutes.4 Yet the same study showed that average correlation strengths over an entire network stabilized after approximately 5 minutes of imaging time, reaching asymptotic values.4 These results led the authors to conclude that surprisingly reliable estimates could be obtained from a single 5-minute run and that increasing imaging time resulted in marginally small improvements in reliability.4
Although these results are encouraging, the use of functional connectivity as a specific diagnostic test or for use in single-subject classifications will likely require identifying subtle quantitative differences in a subset of “connections” between brain regions. We investigated the reliability of individual functional connectivity measurements within a single subject between small regions of interest to better characterize the incremental improvement in reliability with increased imaging time.
Materials and Methods
Subject Characteristics
One hundred 5-minute scans were obtained during 10 imaging sessions (10 scans per session) on a single male subject (age, 39 years) during a 3-week period. Five sessions were obtained while the subject was instructed to keep his eyes open and remain awake, and 5 sessions were obtained while the subject was watching 10 five-minute clips from Bugs Bunny cartoons (Looney Tunes Golden Collection, Volume 1, Warner Home Video). The same 10 clips were used for each of the 5 cartoon sessions in the same order, with the clips synchronized to the onset of the BOLD acquisition by a fiber-optic trigger pulse.
Additionally, BOLD fMRI data were obtained from 36 healthy adolescent and adult volunteers examined after informed consent in accordance with procedures approved by the institutional review board. A subset of these data has been previously reported.28 Subjects were between the ages of 17 and 53 years: 16 male, 20 female. All subjects had no Diagnostic and Statistical Manual of Mental Disorders-IV Axis I diagnoses based on diagnostic semistructured psychiatric interviews and screening surveys as previously described.28
Data Acquisition
Images were acquired on a 3T Magnetom Trio scanner (Siemens, Erlangen, Germany) with a 12-channel head coil. The scanning protocol consisted of an initial 1-mm isotropic MPRAGE acquisition for an anatomic template. BOLD echo-planar images (TR = 2.0 seconds, TE = 28 ms, generalized autocalibrating partially parallel acquisition with acceleration factor = 2, 40 sections at 3-mm section thickness, 64 × 64 matrix) were obtained during the resting state, in which subjects were instructed to keep their eyes open and remain awake and try to let thoughts pass through their minds without focusing on any particular mental activity. Prospective motion correction was performed during BOLD imaging with a prospective acquisition-correction technique sequence. An 8-minute resting scan (240 volumes) was obtained for each of the group subjects. One hundred 5-minute scans (155 volumes) were obtained for the individual subject. An additional field map scan was obtained for each subject for distortion correction. For all BOLD sequences, simultaneous plethysmograph (pulse oximeter) and chest excursion (respiratory belt) waveforms were recorded for off-line analysis.
fMRI Postprocessing
Postprocessing of BOLD images has been previously described.28 Briefly, BOLD images were processed with RETROICOR29 by using an AFNI (Analysis of Functional NeuroImages, Neuroimaging Informatics Technology Initiative, Bethesda, Maryland) software package30; section-timing correction (SPM8, Wellcome Trust, London, United Kingdom); motion and distortion correction (realign and unwarp, SPM8); coregistration to MPRAGE (SPM8); segmentation of gray matter, white matter, and CSF (SPM8); and normalization to MNI template brain (SPM8, T1.nii), PSTCor,28 allowing removal by regression of motion; physiologic, CSF, white matter, and soft-tissue signals; bandpass filtering between 0.001 and 0.1 Hz31; and linear detrend at each voxel in the brain.
Region-of-Interest Correlation
Sixty regions of interest were adapted from published peak MNI coordinates from a study by using high-model-order independent component analysis to parcellate the brain into 42 independent components based on functional connectivity.32 Coordinates were selected so as to represent 30 pairs of interhemispheric homologues. Four additional coordinates were chosen along the midline. Five-millimeter-radius spheric regions of interest were selected for each of these 64 coordinates (On-line Table). The coordinates were selected such that each coordinate was at least 12 mm from every other coordinate to avoid any overlap in the regions of interest. Mean time series were extracted from each 5-minute scan from each of the 64 regions of interest. The Pearson correlation coefficient between each pair of regions of interest was measured, and Fisher z-transform was performed to obtain a 64 × 64 matrix of correlation between the regions. The correlation procedure was performed separately for each of the group subjects by using 5 or 8 minutes of data, respectively.
A similar approach was performed to extract the mean time series from each of 116 regions in an anatomic parcellation of the brain by using an MNI-normalized version of the AAL atlas,33 packaged with the WFU PickAtlas toolbox software (http://www.fmri.wfubmc.edu/cms/software).34 This approach yielded a 116 × 116 matrix of z-transformed correlation values for one 8-minute scan from each of the 36 group subjects and from 100 five-minute scans from the individual subject.
Reproducibility Calculations
As a measurement of reproducibility, we calculated the mean difference in correlation that would be obtained if a set of measurements was repeated. For intrasession measurements, we selected, at random, 2 groups of k-scans and compared results to those from another group of k-scans from the same scanning session. This process was repeated 100 times for each number of k-scans (1–5). In each case, we took, for each connection between region i and region j, the mean Fisher-transformed correlation r1(i,j) from the first group of k-scans and the mean Fisher-transformed correlation r2(i,j) from the second group of k-scans to calculate mean difference in correlation:
 |
Over the 100 samples for each number of scans, means, and SDs of the mean differences in correlations were used for estimates of reproducibility. Analogous measurements were obtained for intersession reproducibility, by using 100 samples each of between 1 and 10 scans from different sessions within the same subject, and for interindividual reproducibility, by using 100 samples each of between 1 and 18 unique subjects of the 36 subjects in the study.
Statistical and Classifier Analysis
To calculate significant differences between individual and group correlation “fingerprints,” we evaluated, by using a 2-tailed t test, whether a given connection between regions i and j was significantly different between k-scans from the same individual and the 36 scans from different individuals. Significance was taken at P = .05, Bonferroni-corrected for the number of connections considered. For example, when evaluating the full 64 × 64 matrix of connections between ICA-based coordinates, we divided P values by (64 × 63 / 2). When evaluating just the 30 interhemispheric homolog pairs, we divided P values by 30. A connection was considered significant if this Bonferroni-corrected P value was significant for 95 of 100 random samples of k-scans from the 50 resting scans in the individual.
Classification between rest and cartoon scans was performed by obtaining rest and cartoon “standards” from the first 30 rest scans and first 30 cartoon scans. Mean correlation between each pair of regions was calculated across the 30 scans of each type. For testing, 100 samples of 1, 2, or 3 randomly selected rest and cartoon scans from the 20 remaining scans of each type were chosen and the mean correlation values for each connection were compared with the rest and cartoon standards by evaluating the mean difference in correlation as described above. Classification was performed on the basis of whether the test sample showed a mean difference in correlation closer to the rest standard or the cartoon standard.
Results
We measured the reproducibility of quantitative measures of functional connectivity within a single subject. For this subject, we obtained 10 five-minute BOLD scans in each of 10 imaging sessions, half obtained while the subject was resting with eyes open and half obtained while the subject was watching cartoons. Intrasession reproducibility is shown in Fig 1 . The mean difference in correlation between the 2016 pairs of 64 regions of interest from measurements obtained from different scans in the same session showed consistent improvement in reproducibility as more scans were averaged.
Fig 1.

Intrasession reproducibility in 1 subject. A, Mean difference in Fisher-transformed correlations across 2016 pairs of 64 regions of interest between samples of scans obtained in the same session. Error bars show SDs across 100 groupings of ≤5 scans. B, Points show the mean difference in correlations for 100 samples of 5 scans compared with the remaining 5 scans within each of 5 sessions with the subject's eyes open but no stimuli and 5 sessions with the subject watching cartoons. C, Difference in correlations for 2016 pairs of 64 regions for 2 resting (eyes open) scans. D, Difference in correlations for 2 sets of 5 resting scans, averaged within each group and compared with each other in the scatterplot.
The reproducibility of measurements while the subject was watching cartoons was slightly better, though within 1 SD of measurements obtained in the no-stimulus condition. This difference was true despite the fact that different stimuli were shown in each scan within a session. Figure 1B shows the mean difference in correlation between groups of 5 scans within the same session, which indicates that this difference is primarily due to fewer outliers among groups of resting scans.
Similar measurements were obtained for differences in correlation between groups of scans obtained in different imaging sessions, shown in Fig 2. In this case, the groups of cartoon scans consisted of the same stimuli in each of the 2 sessions compared for each group of scans. What is surprising, the difference in correlation between scans in the same session, some of which were within minutes of each other, was nearly as great as that between scans obtained on separate days.
Fig 2.

Intersession reproducibility. Mean difference in Fisher-transformed correlations across 2016 pairs of 64 regions of interest between samples of scans obtained in different sessions. Error bars show SDs across 100 groupings of ≤10 scans.
We also compared scans from 36 different individuals, all obtained in an eyes-open resting state, shown in Fig 3 A. Because these scans were 8 minutes in length, we evaluated difference in correlation by using the entire scan or just the first 5 minutes, for better comparison with individual results shown in the first 2 figures.
Fig 3.

Intersubject reproducibility. A, Mean difference in Fisher-transformed correlations across 2016 pairs of 64 regions of interest between samples of scans obtained in different subjects. The curve showing 0.25 / sqrt(n) is superimposed. Error bars represent SDs across groups of subjects. B, Difference in correlation for 2016 pairs of 64 regions for 2 groups of 20 resting (eyes open) scans. C, Difference in correlation for 36 scans from different subjects by using 5 minutes of imaging data, compared with 50 resting scans from 1 subject.
Again, the differences in correlation between groups of subjects were only slightly higher than those obtained within a single subject and showed a nearly identical rate of decrease as more scans were averaged as was seen in the individual subject results. This rate of decrease was closely approximated by a curve proportional to 1 / sqrt(n), where n was the number of scans averaged, equivalent to the relationship observed by Van Dijk et al.4
We additionally compared the mean correlation of 20 resting (Fig 3B) scans within 1 subject to another 20 resting scans from the same subject to show the reproducibility in each of the 2016 pairs of regions used in the analysis. Comparison of 50 scans from 1 subject with 36 scans all from different subjects (Fig 3C) does not show reproducibility obtained within individual or group results alone, suggesting that individual and group measurements converge to different values.
The scatterplot in Fig 3B shows similar reproducibility throughout the entire set of “connections,” even though pairs of regions differ widely in correlation and likely differ in the extent of underlying anatomic connectivity. These results would indicate that functional connectivity measurements do not require direct connections to achieve consistent absolute individual or population correlation between 2 cortical regions, and functional connectivity information may be useful even when the 2 regions considered are anatomically neither related nor lie within the same resting-state network.
This possibility is further evaluated by considering reproducibility within different subsets of region-of-interest pairs. The regions of interest we selected were generated from a study by using relatively high-model-order independent-component analysis to parcellate the brain. Therefore, we have additional information about which regions of interest were within the same independent component. Moreover, we computed separately, for each pair of connections, whether the correlation was significantly different from zero in the group results and individual resting-state results, by using 2-tailed t tests with Bonferroni corrections for multiple comparisons. The regions of interest we selected included 30 pairs of interhemispheric homologues, which are among the most robust functional connections in the brain.35 Finally, we used a completely separate parcellation of the brain, the AAL atlas, which did not include functional connectivity information in generation of regional boundaries.33,34
If functional connectivity measurements are more or less reliable on the basis of the degree of underlying anatomic connectivity or boundaries of resting-state networks, then we would predict that the reliability of the correlation would be higher for more anatomically connected pairs of regions.
Rather, we saw a trend toward the opposite relationship, illustrated in Fig 4. The best reproducibility was seen within the set of all pairs of the 64 regions selected. When we restricted measurements to only those pairs of regions that were significantly connected in the individual or group data or to pairs of regions within the same independent component or to interhemispheric homologues, the mean differences in correlation were higher. Error in reproducibility between 116 regions in the AAL atlas (which were spatially larger than the 5-mm-radius regions defined by coordinates chosen from peak independent-component goodness-of-fit measurements) was slightly higher than that using the ICA method. All subsets of correlation measurements showed improved reproducibility with an increasing number of scans averaged, following a relationship approximating α / sqrt(n), where α is the SD of the correlation measurements within the sample.
Fig 4.
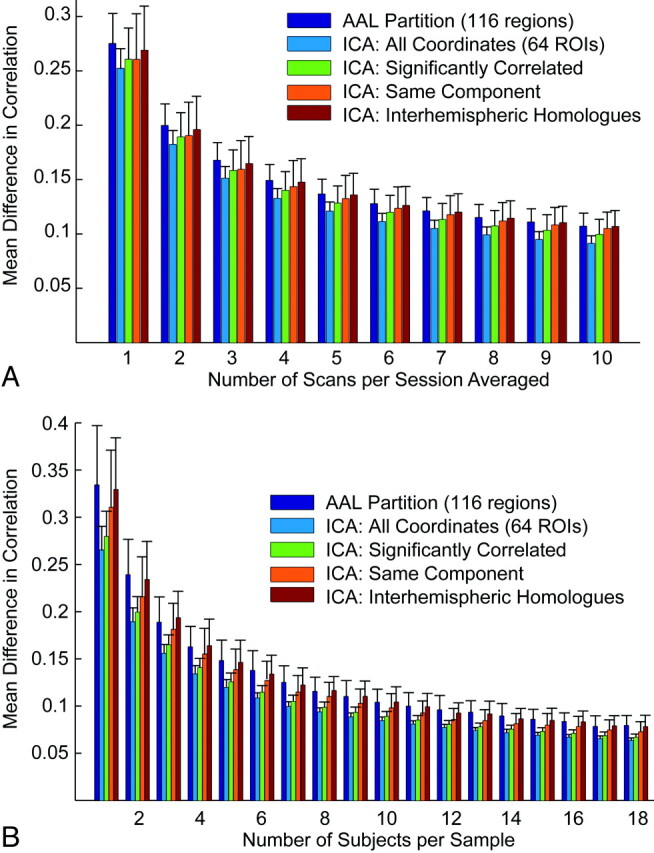
Effect of region-of-interest choice on reproducibility. A, Mean difference in correlation for pairs of regions of interest defined by the AAL atlas and different subsets of the 64 coordinates chosen for the analysis within resting-state scans from a single individual (intersession). Error bars show SDs across 100 groups of scans. B, Mean differences in correlations for the same pairs of regions of interest for group results. Error bars show SDs across 100 groups of subjects for each number of scans averaged.
The similarity of reproducibility of functional connectivity measurements within a session, across sessions but within an individual, and across individuals is compared directly in Fig 5 A. These individual and population means are different, as indicated in Fig 5B, where differences between the individual and group diverge with increased imaging time of the individual. Increased imaging time allows identification of more pairs of regions that can significantly distinguish an individual from the group even in ≤4 hours of imaging time. Moreover, more such significant connections establishing an individual's functional connectivity fingerprint from the group mean are identified within the entire sample of pair-wise connections than within subsets restricted to pairs of regions with expected higher anatomic connectivity, even with the more stringent multiple comparison correction required in the larger sample of correlation pairs. Thus, information is present distinguishing the individual from the group that is not restricted to pairs of connections with the strongest underlying anatomic or functional connectivity.
Fig 5.

Imaging time required to distinguish an individual's functional connectivity fingerprint from the population. A, Interindividual, intersession, and intrasession reproducibility shows only small differences and similar improvements with more imaging time used to construct measurements. B, Mean differences in correlations within the group and between the individual and the group with increased number of scans averaged. The black line shows α / sqrt(n) to project expected reproducibility if increasing numbers of group subjects are used. The individual and group values diverge with increased imaging time. C, Number of individual pairs of regions of interest, which are significantly different between the individual and the group over 95% of n resting scan samples selected from the individual's results.
Functional connectivity values are modulated by the underlying task a subject is performing. This is demonstrated by evaluating the performance of a simple task classifier (Fig 6). The first 30 resting scans and the first 30 cartoon scans were each averaged for each of the 2016 pairs of regions of interest studied to form resting and cartoon “standards.” Then, groups of 1, 2, or 3 resting or cartoon scans from the remaining 20 scans were compared with the standards to obtain a mean difference in correlation from each standard. Classification was performed by assessing whether each group of test scans showed a smaller mean difference in correlation from the resting and cartoon standards. Classification by using 1, 2, and 3 five-minute scans showed 50%, 95%, and 100% classification accuracy.
Fig 6.

Performance of a task classifier (rest versus watching cartoons) with increased imaging time. Each point represents 1 sample of 1, 2, or 3 of the 20 resting or cartoon test scans compared with resting and cartoon standards obtained by averaging the first 30 scans of each type.
Discussion
We show that within a single subject, each correlation measurement between any 2 small regions of interest in the brain converged to an absolute number as a function of 1 over the square root of imaging time. Similarly, within a population of healthy control subjects, any given connection converged to a population mean at a similar rate as a function of imaging time and number of subjects. These individual and population connectivity fingerprints could be discerned reliably beginning at approximately 15 minutes of imaging time, with continued significant improvements in reliability with ≤4 hours of imaging time. Functional connectivity measurements were slightly more reliable during a constrained task (watching video clips) than during a traditional resting-state paradigm.
Our results indicate that though the core architecture of resting-state networks may be discerned with brief imaging times, investigators and clinicians, nevertheless, should consider the advantages of a much longer imaging time if single-subject results are desired rather than population means. Our data, similar to those of Shehzad et al27 and Van Dijk et al,4 indicate that only moderate reliability is present for individual correlation measurements from a 5-minute scan. Because we observe small differences in such individual measurements between intrasession, intersession, and intersubject reproducibility, it is very likely that these measurements have intrinsic noise due to technical factors or moment-to-moment changes in brain activity that is much larger than the effects of interest between individuals or cognitive states.
We use the distinction of the functional connectivity profile of a healthy individual from a healthy population as a benchmark for the reliability of individual connectivity measurements. No single connection was found to reliably identify the individual from the group with <25 minutes of scanning time for the individual. At 4 hours of imaging time, almost 100 of the 2016 pair-wise correlation measurements were significantly different between the individual and group. Although identifying individuals with pathologically altered functional connectivity may require less imaging time, the large variability in measurements obtained from brief scans is likely to limit accurate classification unless ensembles of connections are used. Using ensembles of connections in turn may limit the ability to make more subtle distinctions between disease subpopulations, to develop connectivity-based endophenotypes, or to perform in a robust manner despite differences in task performance.
Task modulation of functional connectivity has been observed in several studies.36–39 A study specifically evaluating resting-state scans obtained with the subject's eyes open or closed showed quantitative differences in functional connectivity in these 2 states.40 Given that BOLD fluctuations have been shown to be related to behavioral measures of task performance,41–43 it seems likely that constraints on the task performed during acquisition will affect functional connectivity results and reliability.
Our results show that within a single subject, a classifier shows increasingly robust ability to discriminate differences in functional connectivity attributable to task with increased imaging time. With 15 minutes of BOLD imaging, our results suggest that even the simple classifier we used was able to distinguish a resting state from when the subject was watching cartoons. Although the results distinguishing the individual from the group in our study may be attributable merely to differences in anatomy, such as the percentage of gray matter within a given region of interest, the distinction based on task can only be attributed to actual differences in functional connectivity.
If longer imaging times are used for functional connectivity measurements, a significant problem is likely to be subject's ability to tolerate longer scanning times while maintaining wakefulness. Given the significant differences in connectivity we and others have observed related to task, with some significant differences found in connectivity with sleep,44 light sedation,45 or even simply eyes closed versus eyes open,40 vigilance related to subject wakefulness is warranted. If a more constrained task such as watching video clips results in improved reliability of functional connectivity measurements, it may be preferable to acquire connectivity measurements during a task. Although differences in task performance between individuals or populations may be a confounding variable in functional connectivity studies, this is not necessarily different from data acquired in the resting state. It is also possible that the resting-state task can be performed in very different ways in groups that relate to cognitive content or other factors. It remains to be determined whether particular tasks (including the conventional resting task) show improved ability to discriminate functional connectivity differences in pathologic or developmental subjects.
Our approach has several limitations. Restricting analysis to an extended one of a single subject limits generalizability. Nevertheless, although reproducibility may vary from subject to subject, our results showing an extended characterization of 1 subject as well as a group sample indicate that both single-subject and group results consistently show improvement in reliability with 1 / sqrt(n) for imaging time n, identical to that seen by Van Dijk et al.4 Thus, it is reasonable to anticipate that other subjects would show scaled reliability curves that may differ in quantitative values but would be otherwise similar. It is possible that it may require less imaging time to characterize subjects with pathologic connectivity values in a diagnostic test or classifier. Because our results were all obtained on the same scanner, we do not have data on the effects of different scanners on the reliability of functional connectivity measurements.
Conclusions
In a characterization of reproducibility of functional connectivity measurements within a single subject, we demonstrated that an individual and a population of subjects each converge to different functional connectivity profiles with increasing imaging time. Given only moderate reproducibility of quantitative functional connectivity measurements in brief scans, we suggest that 15–25 minutes or greater of BOLD imaging be performed when possible for studies used in single-subject diagnosis or classification.
Supplementary Material
Abbreviations
- AAL
Automated Anatomical Labeling
- BOLD
blood oxygen level–dependent
- fcMRI
functional connectivity MR imaging
- fMRI
functional MR imaging
- ICA
independent component analysis
- MNI
Montreal Neurological Institute
- MPRAGE
magnetization-prepared rapid acquisition of gradient echo
- SPM
statistical parametric mapping
- sqrt
square root
Footnotes
This work was supported by the National Institutes of Health grant RO1 DA020269 (D.Y.-T.) and by the Ben B. and Iris M. Margolis Foundation (J.S.A.).
Indicates article with supplemental on-line table.
Indicates article with supplemental on-line figure at www.ajnr.org
References
- 1. Biswal B, Yetkin FZ, Haughton VM, et al. Functional connectivity in the motor cortex of resting human brain using echo-planar MRI. Magn Reson Med 1995;34:537–41 [DOI] [PubMed] [Google Scholar]
- 2. Fox MD, Raichle ME. Spontaneous fluctuations in brain activity observed with functional magnetic resonance imaging. Nat Rev Neurosci 2007;8:700–11 [DOI] [PubMed] [Google Scholar]
- 3. Biswal BB, Mennes M, Zuo XN, et al. Toward discovery science of human brain function. Proc Natl Acad Sci U S A 2010;107:4734–39 [DOI] [PMC free article] [PubMed] [Google Scholar]
- 4. Van Dijk KR, Hedden T, Venkataraman A, et al. Intrinsic functional connectivity as a tool for human connectomics: theory, properties, and optimization. J Neurophysiol 2010;103:297–321. Epub 2009 Nov 4 [DOI] [PMC free article] [PubMed] [Google Scholar]
- 5. Greicius MD, Srivastava G, Reiss AL, et al. Default-mode network activity distinguishes Alzheimer's disease from healthy aging: evidence from functional MRI. Proc Natl Acad Sci U S A 2004;101:4637–42 [DOI] [PMC free article] [PubMed] [Google Scholar]
- 6. Andrews-Hanna JR, Snyder AZ, Vincent JL, et al. Disruption of large-scale brain systems in advanced aging. Neuron 2007;56:924–35 [DOI] [PMC free article] [PubMed] [Google Scholar]
- 7. Seeley WW, Crawford RK, Zhou J, et al. Neurodegenerative diseases target large-scale human brain networks. Neuron 2009;62:42–52 [DOI] [PMC free article] [PubMed] [Google Scholar]
- 8. Cherkassky VL, Kana RK, Keller TA, et al. Functional connectivity in a baseline resting-state network in autism. Neuroreport 2006;17:1687–90 [DOI] [PubMed] [Google Scholar]
- 9. Just MA, Cherkassky VL, Keller TA, et al. Functional and anatomical cortical underconnectivity in autism: evidence from an FMRI study of an executive function task and corpus callosum morphometry. Cereb Cortex 2007;17:951–61 [DOI] [PMC free article] [PubMed] [Google Scholar]
- 10. Just MA, Cherkassky VL, Keller TA, et al. Cortical activation and synchronization during sentence comprehension in high-functioning autism: evidence of underconnectivity. Brain 2004;127:1811–21 [DOI] [PubMed] [Google Scholar]
- 11. Kana RK, Keller TA, Cherkassky VL, et al. Atypical frontal-posterior synchronization of Theory of Mind regions in autism during mental state attribution. Soc Neurosci 2009;4:135–52. Epub 2008 Jul 3 [DOI] [PMC free article] [PubMed] [Google Scholar]
- 12. Kana RK, Keller TA, Minshew NJ, et al. Inhibitory control in high-functioning autism: decreased activation and underconnectivity in inhibition networks. Biol Psychiatry 2007;62:198–206 [DOI] [PMC free article] [PubMed] [Google Scholar]
- 13. Kennedy DP, Courchesne E. The intrinsic functional organization of the brain is altered in autism. Neuroimage 2008;39:1877–85 [DOI] [PubMed] [Google Scholar]
- 14. Kleinhans NM, Richards T, Sterling L, et al. Abnormal functional connectivity in autism spectrum disorders during face processing. Brain 2008;131:1000–12 [DOI] [PubMed] [Google Scholar]
- 15. Di Martino A, Shehzad Z, Kelly C, et al. Relationship between cingulo-insular functional connectivity and autistic traits in neurotypical adults. Am J Psychiatry 2009;166:891–99 [DOI] [PMC free article] [PubMed] [Google Scholar]
- 16. Church JA, Fair DA, Dosenbach NU, et al. Control networks in paediatric Tourette syndrome show immature and anomalous patterns of functional connectivity. Brain 2009;132:225–38. Epub 2008 Oct 24 [DOI] [PMC free article] [PubMed] [Google Scholar]
- 17. Bluhm RL, Miller J, Lanius RA, et al. Spontaneous low-frequency fluctuations in the BOLD signal in schizophrenic patients: anomalies in the default network. Schizophr Bull 2007;33:1004–12 [DOI] [PMC free article] [PubMed] [Google Scholar]
- 18. Jafri MJ, Pearlson GD, Stevens M, et al. A method for functional network connectivity among spatially independent resting-state components in schizophrenia. Neuroimage 2008;39:1666–81 [DOI] [PMC free article] [PubMed] [Google Scholar]
- 19. Lawrie SM, Buechel C, Whalley HC, et al. Reduced frontotemporal functional connectivity in schizophrenia associated with auditory hallucinations. Biol Psychiatry 2002;51:1008–11 [DOI] [PubMed] [Google Scholar]
- 20. Liang M, Zhou Y, Jiang T, et al. Widespread functional disconnectivity in schizophrenia with resting-state functional magnetic resonance imaging. Neuroreport 2006;17:209–13 [DOI] [PubMed] [Google Scholar]
- 21. Calhoun VD, Maciejewski PK, Pearlson GD, et al. Temporal lobe and “default” hemodynamic brain modes discriminate between schizophrenia and bipolar disorder. Hum Brain Mapp 2008;29:1265–75 [DOI] [PMC free article] [PubMed] [Google Scholar]
- 22. Harrison BJ, Soriano-Mas C, Pujol J, et al. Altered corticostriatal functional connectivity in obsessive-compulsive disorder. Arch Gen Psychiatry 2009;66:1189–200 [DOI] [PubMed] [Google Scholar]
- 23. Lowe MJ, Beall EB, Sakaie KE, et al. Resting state sensorimotor functional connectivity in multiple sclerosis inversely correlates with transcallosal motor pathway transverse diffusivity. Hum Brain Mapp 2008;29:818–27 [DOI] [PMC free article] [PubMed] [Google Scholar]
- 24. Lowe MJ, Phillips MD, Lurito JT, et al. Multiple sclerosis: low-frequency temporal blood oxygen level-dependent fluctuations indicate reduced functional connectivity initial results. Radiology 2002;224:184–92 [DOI] [PubMed] [Google Scholar]
- 25. Damoiseaux JS, Rombouts SA, Barkhof F, et al. Consistent resting-state networks across healthy subjects. Proc Natl Acad Sci U S A 2006;103:13848–53 [DOI] [PMC free article] [PubMed] [Google Scholar]
- 26. Chen S, Ross TJ, Zhan W, et al. Group independent component analysis reveals consistent resting-state networks across multiple sessions. Brain Res 2008;1239:141–51 [DOI] [PMC free article] [PubMed] [Google Scholar]
- 27. Shehzad Z, Kelly AM, Reiss PT, et al. The resting brain: unconstrained yet reliable. Cereb Cortex 2009;19:2209–29 [DOI] [PMC free article] [PubMed] [Google Scholar]
- 28. Anderson JS, Druzgal TJ, Lopez-Larson M, et al. Network anticorrelations, global regression, and phase-shifted soft tissue correction. Hum Brain Mapp 2010. June 9. [Epub ahead of print] [DOI] [PMC free article] [PubMed] [Google Scholar]
- 29. Glover GH, Li TQ, Ress D. Image-based method for retrospective correction of physiological motion effects in fMRI: RETROICOR. Magn Reson Med 2000;44:162–67 [DOI] [PubMed] [Google Scholar]
- 30. Cox RW. AFNI: software for analysis and visualization of functional magnetic resonance neuroimages. Comput Biomed Res 1996;29:162–73 [DOI] [PubMed] [Google Scholar]
- 31. Cordes D, Haughton VM, Arfanakis K, et al. Frequencies contributing to functional connectivity in the cerebral cortex in “resting-state” data. AJNR Am J Neuroradiol 2001;22:1326–33 [PMC free article] [PubMed] [Google Scholar]
- 32. Kiviniemi V, Starck T, Remes J, et al. Functional segmentation of the brain cortex using high model order group PICA. Hum Brain Mapp 2009;30:3865–86 [DOI] [PMC free article] [PubMed] [Google Scholar]
- 33. Tzourio-Mazoyer N, Landeau B, Papathanassiou D, et al. Automated anatomical labeling of activations in SPM using a macroscopic anatomical parcellation of the MNI MRI single-subject brain. Neuroimage 2002;15:273–89 [DOI] [PubMed] [Google Scholar]
- 34. Maldjian JA, Laurienti PJ, Kraft RA, et al. An automated method for neuroanatomic and cytoarchitectonic atlas-based interrogation of fMRI data sets. Neuroimage 2003;19:1233–39 [DOI] [PubMed] [Google Scholar]
- 35. Stark DE, Margulies DS, Shehzad ZE, et al. Regional variation in interhemispheric coordination of intrinsic hemodynamic fluctuations. J Neurosci 2008;28:13754–64 [DOI] [PMC free article] [PubMed] [Google Scholar]
- 36. Fransson P. How default is the default mode of brain function? Further evidence from intrinsic BOLD signal fluctuations. Neuropsychologia 2006;44:2836–45 [DOI] [PubMed] [Google Scholar]
- 37. Hampson M, Driesen NR, Skudlarski P, et al. Brain connectivity related to working memory performance. J Neurosci 2006;26:13338–43 [DOI] [PMC free article] [PubMed] [Google Scholar]
- 38. Harrison BJ, Pujol J, Lopez-Sola M, et al. Consistency and functional specialization in the default mode brain network. Proc Natl Acad Sci U S A 2008;105:9781–86 [DOI] [PMC free article] [PubMed] [Google Scholar]
- 39. Clare Kelly AM, Uddin LQ, Biswal BB, et al. Competition between functional brain networks mediates behavioral variability. Neuroimage 2008;39:527–37 [DOI] [PubMed] [Google Scholar]
- 40. Yan C, Liu D, He Y, et al. Spontaneous brain activity in the default mode network is sensitive to different resting-state conditions with limited cognitive load. PLoS One 2009;4:e5743. [DOI] [PMC free article] [PubMed] [Google Scholar]
- 41. Fox MD, Snyder AZ, Vincent JL, et al. Intrinsic fluctuations within cortical systems account for intertrial variability in human behavior. Neuron 2007;56:171–84 [DOI] [PubMed] [Google Scholar]
- 42. Mennes M, Kelly C, Zuo XN, et al. Inter-individual differences in resting-state functional connectivity predict task-induced BOLD activity. Neuroimage 2010;50:1690–701 [DOI] [PMC free article] [PubMed] [Google Scholar]
- 43. Stevens WD, Buckner RL, Schacter DL. Correlated low-frequency BOLD fluctuations in the resting human brain are modulated by recent experience in category-preferential visual regions. Cereb Cortex 2010;20:1997–2006. Epub 2009 Dec 21 [DOI] [PMC free article] [PubMed] [Google Scholar]
- 44. Horovitz SG, Fukunaga M, de Zwart JA, et al. Low frequency BOLD fluctuations during resting wakefulness and light sleep: a simultaneous EEG-fMRI study. Hum Brain Mapp 2008;29:671–82 [DOI] [PMC free article] [PubMed] [Google Scholar]
- 45. Greicius MD, Kiviniemi V, Tervonen O, et al. Persistent default-mode network connectivity during light sedation. Hum Brain Mapp 2008;29:839–47 [DOI] [PMC free article] [PubMed] [Google Scholar]
Associated Data
This section collects any data citations, data availability statements, or supplementary materials included in this article.