

Abstract
Previous data suggested that constitutive expression of the transcription factor Bright (B cell regulator of immunoglobulin heavy chain transcription), normally tightly regulated during B cell differentiation, was associated with autoantibody production. Here we show that constitutive Bright expression results in skewing of mature B lineage subpopulations toward marginal zone cells at the expense of the follicular subpopulation. C57Bl/6 transgenic mice constitutively expressing Bright in B lineage cells generated autoantibodies that were not the result of global increases in immunoglobulin or of breaches in key tolerance checkpoints typically defective in other autoimmune mouse models. Rather, autoimmunity correlated with increased numbers of marginal zone B cells and alterations in the phenotype and gene expression profiles of lymphocytes within the follicular B cell compartment. These data suggest a novel role for Bright in the normal development of mature B cell subsets and in autoantibody production.
Keywords: Bright transcription factor, B lymphocyte, autoantibodies, marginal zone development
1. Introduction
Autoimmunity results from a loss of tolerance to self-antigen. Due to the complexity of this disease, its cause is still largely unknown and treatment options are limited (Fairhurst et al., 2006). Mouse models have been instrumental in identifying normal B cell tolerance checkpoints (Gay et al., 1993;Goodnow et al., 1988;Hartley et al., 1993;Nemazee and Burki, 1989;Okamoto et al., 1992). Receptor editing is the process of continued light chain rearrangement which utilizes other gene segments within the kappa (κ) light chain loci and resorts to the lambda (λ) light chain loci if necessary to change the antigen receptor specificity (Gay et al., 1993;Nemazee and Weigert, 2000). Anergy is a property of low-affinity autoreactive cells that persist in the periphery and demonstrate a reduced capacity to participate in immune responses (Merrell et al., 2006). At the cellular level they do not mobilize Ca2+, initiate tyrosine phosphorylation or proliferate (Merrell et al., 2006;Teague et al., 2007). These anergic cells are commonly referred to as transitional type 3 (T3) immature B cells, and this subset is selected away from the T1→T2→mature B cell developmental pathway (Teague et al., 2007). In multiple lupus-prone strains, this subset is decreased (Teague et al., 2007). BCR stimulation can also lead to clonal deletion and occurs predominantly at the immature T1 B cell stage (Carsetti et al., 1995;Petro et al., 2002;Su and Rawlings, 2002). Furthermore, others have shown that intrinsic hyperactivity and expansions in mature marginal zone (MZ) B cells, which are enriched for autoreactive clones (Martin and Kearney, 2002), are associated with breaches in tolerance. Therefore, defects in multiple pathways and at multiple stages of B cell development contribute to autoimmunity.
Bright (for B cell regulator of Ig heavy chain transcription) is a transcription factor that belongs to the ARID (AT-rich interaction domain) family (Herrscher et al., 1995), which consists of 15 proteins divided into seven subfamilies. Bright and two ARID orthologs in the human and yeast have been associated with chromatin remodeling (Ayoub et al., 2003;Lai et al., 2001;Lin et al., 2007), suggesting a possible function in epigenetic regulation. However, the first Bright binding sites discovered were in the Ig loci and the best characterized function of Bright is its ability to increase immunoglobulin (Ig) production (Webb et al., 1989;Webb, 2001). Predicted Bright-binding sites are present upstream of over half of the variable region genes and within the intronic Eμ enhancer necessary for expression of all Igs (Herrscher et al., 1995;Johnston et al., 2006). Bright Ig enhancing function requires a multi-protein complex containing Bright dimers (Nixon et al., 2004a) and both Bruton’s tyrosine kinase (Btk) and its substrate, TFII-I (Rajaiya et al., 2006;Rajaiya et al., 2005). More recent data suggest that Bright may also affect genes outside of the Ig locus.
Bright is expressed in multiple embryonic tissues where its function is unlikely to be associated with Ig expression. Although transgenic mice that expressed a dominant negative form of Bright specifically in the B cell lineage showed defects in B1 B cell Ig secretion and decreased levels of serum IgM (Nixon et al., 2008), Bright knockout mice died between days 12 and 14 of gestation due to defects in their ability to generate sufficient red blood cells (Webb et al., 2011). In addition, Bright deficient cells from multiple tissues including spleen, bone marrow, and lymph node became developmentally plastic with the ability to differentiate into cells expressing markers from all three germ lines (An et al., 2010). These data demonstrate that Bright plays a role in non-Ig related functions and suggest that it regulates genes other than the immunoglobulin loci.
Bright expression in the adult is restricted to discrete stages during B cell development in both the mouse and human. Bright mRNA expression occurs in large pro-B, pre-B and recirculating B cells in the bone marrow and in germinal center B cells in the spleen, but it is actively down regulated in the majority of peripheral B cells in the spleen (Nixon et al., 2004b;Webb et al., 1998). Normal follicular B cells do not express Bright mRNA transcripts, while marginal zone B cells maintain low levels of expression. These two phenotypically and functionally distinct mature B cell subsets can terminally differentiate into memory or plasma B cells once they have initiated an antibody response. Follicular (FO) B cells represent the largest B cell subset in the periphery, are defined as B220+CD93−CD23+IgM+ (Allman et al., 2001;Allman and Pillai, 2008), and re-circulate between various lymphoid sites where they come into contact with activated T cells and undergo germinal center reactions. In contrast, MZ B cells are a minor mature subset accounting for roughly 5% of the total B cell population, are defined as B220+CD93−CD23−IgMhi (Allman et al., 2001;Allman and Pillai, 2008), and produce natural IgM antibody rapidly to blood-borne antigens. Relative to FO B cells, MZ B cells are partially activated, expressing higher basal levels of co-stimulatory molecules and developing into plasma cells more rapidly following activation (Oliver et al., 1999;Oliver et al., 1997). MZ B cells have a relatively restricted B cell repertoire biased towards common bacterial and self-antigen that tends to be polyreactive, and thus capable of being autoreactive (Reviewed in (Loder et al., 1999)). Generally, autoreactive cells are excluded from the FO compartment, whereas the MZ compartment is enriched for autoreactive clones (Reviewed in (Martin and Kearney, 2002)).
Previously, we demonstrated that over-expression of the transcription factor Bright throughout B cell development was associated with ANA production, proteinuria and kidney glomerulonephritis as transgenic FVB/N mice aged (Shankar et al., 2007). However, other studies suggest that normal FVB/N mice exhibit some traits commonly associated with autoimmunity (Maier et al., 2007), suggesting that the genetic background could have influenced the phenotype of the Bright transgenic mice. Here, we sought to analyze how Bright over-expression resulted in autoantibody production. Therefore, it was important to backcross the FVB/N Bright transgenic lines onto the non-autoimmune strain C57Bl/6 (Bygrave et al., 2004;Vidal et al., 1998) for those analyses. Bright expression was also sufficient to generate autoantibodies on this background in mice only four weeks old, and these mice were analyzed to determine if losses in tolerance were consistent with mechanisms observed in other autoimmune models. Intriguingly, the data presented here suggest new roles for Bright in both B cell development and autoimmunity.
2. Material and Methods
2.1. Mice
FVB/N mice that express the Bright transgene driven by the B lineage restricted CD19 promoter were described previously (Shankar et al., 2007). Two independent transgenic lines were backcrossed onto the C57Bl/6 background for more than 10 generations and were genotyped as described (Shankar et al., 2007). All BrTg mice were maintained as heterozygotes. C57Bl/6 and Bcl2 Eμ transgenic mice on the C57Bl/6 background were purchased from Jackson ImmunResearch Laboratories. Btk−/− mice, also on the C57Bl/6 background, were a gift from Wasif Khan (Vanderbilt University School of Medicine, TN). C57Bl/6 (SJL Ly5.1) congenic mice were a gift from Paul W. Kincade (Oklahoma Medical Research Foundation) and were lethally irradiated (1300 rad) before retro-orbital injection with 2×10⁶ whole bone marrow cells from Bright transgenic and/or C57Bl/6 donors (both Ly5.2). 5-weeks post injections, recipients were sacrificed and analyzed. All mice were bred and maintained in the OMRF animal care facility according to Institutional Animal Care and Use Committee approved protocols. Male and female mice were analyzed between 4 and 12 weeks of age.
2.2. ANA
Mouse sera were tested at multiple dilutions for the presence of anti-nuclear antibodies using the NOVA Lite HEp-2 ANA Kit (INOVA diagnostics) as previously described (Shankar et al., 2007). ANA positive control sera from adult mice typically showed strong staining compared to sera from negative littermate controls even at dilutions of 1:360 (Maier et al., 2007). However, for younger mice and mice with low serum Ig levels, higher dilutions (1:45) were also assayed. Antibodies to nuclear antigens were detected using a secondary FITC-conjugated anti-mouse IgG antibody (Jackson Immunoresearch Laboratories) and visualized using a Zeiss Axioplan 2i inverted microscope with an AxioCam HRm camera (Carl Zeiss).
2.3. ELISA
Serum Ig levels were determined using the clonotyping system-AP kit (Southern biotech) and a Biotech EL800 plate reader with GEN5 Biotech software as previously described (Shankar et al., 2007). Briefly, duplicate serum samples were serially diluted from 1:400 to 1:51,200 and concentrations were determined using standard curves generated with appropriate Ig isotype controls of known concentration. Ig secretion from purified B cells plated at 1×10⁶ cells/ml and stimulated with 10μg/ml goat F(ab′)2 anti-mouse IgM or LPS for 5 days was measured similarly from supernatants by ELISA using anti-kappa light chain reagents as previously described (Nixon et al., 2008).
2.4. Flow cytometry
Cells from spleens, bone marrow, peritoneal cavity and thymuses were isolated and prepared, and B cell staining was performed as described (Shankar et al., 2007). Data were collected using an LSRII (BD Biogenics) and DIVA software ver. 4.1. A minimum of 100,000 events were recorded. Data were analyzed using Flojo (Treestar) software ver. 8.3. Fluorescence conjugated antibodies phycoerythrin-cyanin 5 (PE-Cy5)-B220 (Ra3-6B2), peridinin chlorophyll-a protein (PerCP)-B220 (RA3-6B2), phycoerythrin (PE)-CD23 (B3B4), and -CD43 (S7) were purchased from BD Biosciences; allophycocyanin (APC)-CD93/C1qRp (AA4.1), biotin-CD86/B7.2 (GL1), -TLR4/MD2 (MTS510), and -RP105 (RP/14), fluorescein isothiocyanate (FITC)-CD21/35 (7G6), -CD19 (MB19-1), -IgM (II/41), and PE-CD24 (30-F1) from eBiosciences; streptavidin–PE-TEXAS RED from Invitrogen; FITC-CD23 (01234D), -lambda light chain (R24-46), PE-kappa light chain (187.1), PerCP Cy5.5- CD45.2 (104), biotin-CD80/B7 (16-10A1), -CD45.1, and -CD25(7D4) from Pharmingen; and APC-CD23 and biotin-IgM from Southern biotech. Appropriate isotype controls (BD Biosciences and ebiosciences) were used.
2.5. Proliferation and viability assays
Resting B cells for in vitro stimulation were obtained by CD43 depletion from whole spleens according to the manufacturer’s protocol (Miltenyi Biotech). B220+ B cell subsets were defined and sorted using CD24 and CD21 (Su et al., 2004;Loder et al., 1999;Batten et al., 2000) to avoid inadvertent stimulation through surface IgM. Cells were sorted as previously described (Shankar et al., 2007) using a FACSAria (BD Biosciences) and DIVA software ver. 4.1 or DakoCytomation MLS3042 (Dako) using Summit software ver. 4.3.
Isolated B cells were maintained in RPMI 1640 containing 7% FCS (Webb et al., 1989) and were treated with 0.5 to 20μg/ml LPS (Escherichia coli 0111:1B4 (Sigma Aldrich) or anti-mouse IgM (Thermo Scientific). Viabilities were measured by flow cytometry using forward/side scatter properties and 7-amino actinomycin D (7AAD) (eBiosciences) staining (Batten et al., 2000).
Cell proliferation was measured after 48 hours from quadruplicate cultures of 1×10⁶ cells/ml pulsed with 1μCi [3H] thymidine 8 hours prior to harvest and harvested using a PHD cell harvester.
2.6. Ca2+ measurements
Intracellular Ca2+ was monitored as described (Cooney et al., 2001;Malhotra et al., 2009). Briefly, cells were loaded with 5μM INDO-1 acetoxymethyl ester (Invitrogen) with 0.5% pluronic acid (Invitrogen) in HBSS (supplemented with 1mM Ca2+ and 1mg/ml BSA) for 30 min at 37°C. Cells were washed with HBSS, resuspended at 1×10⁶ cells/ml, and loaded into a quartz cuvette placed into a 37°C LS50B spectrofluorometer (Perkin Elmer). Samples were excited at 355nm and emission at 380nm was recorded over time using FLWinlab software. A base line was collected for 200 seconds and intracellular Ca2+-binding (emission at 380) was monitored in response to 10μg/ml anti-mouse IgM for at least 5 minutes. To monitor efficient cell loading at the end of the response, cells were lysed with 0.5% Triton X 100 to release the INDO-1 and the signal was quenched with 0.5μM EDTA.
2.7. EMSA and western blotting
Nuclear cell extracts were prepared as described (Dignam et al., 1983) and EMSAs were performed according to (Webb et al., 2000). Double stranded oligonucleotides corresponding to NF-κB binding sites from the IL-2 receptor promoter (5′-CAACGGCAGGGGAATTCCCCTCTCCTT-3′) (Andrews and Rawlings, 2009) were labeled on one strand, hybridized with the complementary strand by heating to 95ºC for 5 minutes and cooling to room temperature and used for reactions. For whole cell lysates, cells were pelleted, washed once with cold PBS and lysed in TN1 buffer (50mM Tris-HCL, pH 8.0, 125mM NaCl, 10mM EDTA, 1% Triton supplemented with 10μg/ml leupeptin, 10μg/ml aprotinin, 1mM DTT, 3mM Na3VO4 and PMSF). Protein concentrations were determined using the Bradford assay according to manufacturer’s protocol (Biorad). Samples were run on a 10% SDS-PAGE gel and western blots were probed for pTyrosine (PY99) (Santa Cruz) and actin (c-11) (Santa Cruz) and developed with AP conjugated anti-mouse and anti-goat antibodies (Southern Biotech), respectively.
2.8. QRT-PCR
RNA was isolated from 1×10⁶ sort-purified cells using TRI REAGENT according to the manufacturer’s protocol (Molecular research center, Inc.). RNA was reverse transcribed with M-MLV Reverse transcriptase (Promega) and treated with RNasin and RNase Ribonuclease (Promega) according to the manufacturers’ protocols. Quantitative RT-PCR was performed using the RT2 SYBR Green qPCR Master Mix (SA Biosciences) and ABI Prism 7500 thermocycler. Specific genes were amplified using the following primer sets: KLF4: 5′ GCGAACTCACACAGGCGAGAAACC and 3′ TCGCTTCCTCTTCCTCCGACACA; Notch2: 5′ CCGTCGATTCGCTCGAGT and 3′ TGGGCAATGCTGCGTTTT; Hes1: 5′ CAGCGGAATCCCCTGTCTAC and 3′ GAGCAGTTGAAGGTTTATTATGTCTTAGG, Bclxl: 5′ CTGGGACACTTTTGTGGATCTCT and 3′ GAAGCGCTCCTGGCCTTT, and Actin: 5′ GGTCAGAAGGACTCCTATGTG and 3′AGAGCAACATAGCACAGCTTC. Non-template controls were included for each reaction and dissociation analyses were performed to confirm the specificity of the reaction. Relative expression levels were determined using the ΔΔCT method. Briefly, the CT value of the actin house-keeping gene was subtracted from that of the target gene to get the ΔCT = (CT Test gene − CT Actin). The ΔΔCT was calculated by subtracting the ΔCT of the control population from that of the test population ΔΔCT = (ΔCT − ΔCT FO control). Two raised to the negative of this value = 2(−ΔΔT) gave the relative fold change.
2.9. Statistical analyses
All data were subjected to statistical analyses using the unpaired Student’s T test. P values less than 0.05 were considered to be significant.
3. Results
3.1. Bright transgenic mice exhibit defects in B cell maturation
Previous studies suggest that Bright over-expression in B lineage cells resulted in autoantibody production (Shankar et al., 2007), but the FVB/N background used was suggested to contribute to autoimmunity and precluded performing additional studies to determine how Bright dysregulation resulted in breaches in B cell tolerance. Therefore, we examined the effect of Bright over-expression on ANA production and B cell development in C57Bl/6 transgenic mice derived from more than 10 backcrosses. Bone marrow and splenic B cell subsets were enumerated and compared in Bright transgenic (BrTg) and controls using flow cytometry and gating as described (Shankar et al., 2007). The frequencies and total numbers of B cells from each bone marrow subset were not different from controls (Table I). Importantly, the size of the mature recirculating B cell compartment, which contains a subset of the animal’s antibody secreting cells, was not enlarged compared to controls. Therefore, constitutive Bright expression did not alter early B cell development.
Table I.
Numbers of splenic B cells within individual B cell subsets differed between BrTg mice and littermate controlsa
| Control | BrTg | P value | |
|---|---|---|---|
| Bone marrow B cells (×106) | |||
| Total cells per femur | 21.6±2.89b | 24.5±2.19 | 0.443c |
| Pro-B (B220loCD43+IgM−) | 0.21±0.04 | 0.27±0.04 | 0.317 |
| Pre-B (B220loCD43−IgM−) | 1.94±0.22 | 2.40±0.24 | 0.190 |
| Imm (B220loCD43−IgM+) | 0.69±0.10 | 0.90±0.11 | 0.175 |
| Recirc (B220hiCD43−IgM+) | 1.02±0.15 | 1.28±0.15 | 0.220 |
| Splenic B cells (×106) | |||
| Total cells | 85.7±9.07 | 73.8±8.16 | 0.343 |
| CD19+ B cells | 43.9±3.94 | 35.3±2.68 | 0.089 |
| T1 (B220+ IgMhiCD93+CD23−) | 5.64±0.80 | 6.47±0.37 | 0.360 |
| T2 (B220+ IgMhiCD93+CD23+) | 7.34±0.96 | 4.80±0.37 | 0.024 |
| T3 (B220+ IgMloCD93+CD23−) | 1.82±0.21 | 1.75±0.39 | 0.871 |
| MZ (B220+ IgMhiCD93−CD23−) | 2.29±0.29 | 3.38±0.25 | 0.009 |
| FO (B220+ IgM+CD93−CD23+) | 23.9±2.32 | 13.0±1.02 | 0.001 |
Male and female mice (n = 9 littermates and n = 10 BrTg mice) were analyzed at 6 weeks of age.
Total cell numbers (MEAN±SEM) per femur or spleen were determined by multiplying the frequency of live gated cells (Figure 2) by the number of total cells per femur or spleen and are shown ×106.
Student’s t test
Similar analyses were performed on the immature splenic B cell subsets defined by Allman (Allman et al., 2001) as previously described (Shankar et al., 2007). The most recent emigrant population from the bone marrow, the immature T1 B cell subset, was slightly increased in relative proportions compared to littermate controls (Figure 1A), although absolute T1 cell numbers were not different (Figure 1B and Table I). Alternatively, the absolute numbers of BrTg T2 B cells were decreased by >35% compared to littermate controls, suggesting a partial block in differentiation from the T1→T2 B cell stage. However, the size of the T3 B cell pool, which largely consists of anergic B cells and is decreased in other lupus prone mouse models (Teague et al., 2007), did not differ between transgenics and controls (Figure 1B and Table I). Thus, ANA production in the BrTg mice does not appear to be due to defective production of anergic B cells.
Figure 1. Splenic B cell subsets are skewed in BrTg mice.
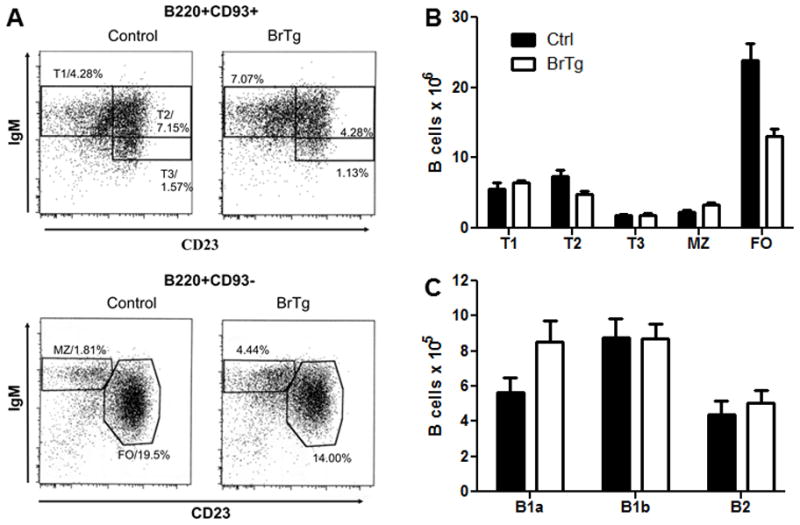
Splenic B cells from littermate controls and BrTg mice were analyzed using flow cytometry and representative gated populations are shown in (A) for immature transitional type 1 (T1 = CD93+IgMhiCD23−), transitional type 2 (T2 = CD93+IgMhiCD23+), and transitional type 3 (T3 = CD93+IgMloCD23+), and mature marginal zone (MZ = CD93−IgMhiCD23−) and follicular (FO = CD93−IgM+CD23+) B cell subsets. Percentages of individual subpopulations are given. (B) Graphic representation of splenic B cell subsets from 9 control and 10 BrTg mice. Standard error bars are shown. (C) Peritoneal lavage cells from 11 control and BrTg mice were gated for B220+ B cells and average percentages of B1a (CD5+ IgM+), B1b (CD5− IgMhi) and B2 (CD5− IgMlo) cells are shown with standard error bars.
Unexpectedly, mature splenic B cell subsets in the BrTg mice were dramatically altered. Total splenic B cell numbers were reduced in the transgenic mice, but BrTg MZ B cell numbers were increased slightly relative to the littermate controls (Figure 1B). In contrast, FO B cells were reduced by nearly 50% in the BrTg mice versus controls (Figure 1B). This resulted in a ratio of one MZ for every three FO cells in the BrTg mice, compared to a 1:10 ration of MZ to FO cells in littermate controls. Consistent with the decreases observed in T2 cell numbers, these data suggest that constitutive expression of Bright negatively impacts FO B cell maturation.
Mature peritoneal B cell numbers were not significantly altered in the BrTg mice compared to littermate controls (Figure 1C). Numbers and proportions of conventional B2 B cells, B1a B cells and B1b B cells were equivalent in all mice tested, indicating that over-expression of Bright did not affect the ability of mature B cells to fill this compartment.
3.2. Bright transgenic mice produce normal levels of circulating Ig, but maintain autoantibody production
Enumeration of CD138+ plasma cells in the spleens of BrTg mice showed slight increases relative to wild type controls (0.28±0.02% versus 0.18±0.02% of total spleen cells, respectively). Therefore, we asked if serum Ig levels were altered in the BrTg mice. Ig isotype levels were measured by ELISA in sera from 6 week-old, non-immunized BrTg mice and littermate controls (Figure 2A). IgM and all IgG isotypes measured were comparable between controls and transgenics. Therefore, levels of serum Ig were not adversely affected by Bright over-expression in these mice.
Figure 2. Bright over-expression results in ANA production without altering serum Ig levels.

(A) Sera from non-immunized 6 to 8 week old mice were analyzed for IgM, IgG1, IgG2a, IgG2b and IgG3 levels by ELISA. Concentrations were determined from standard curves generated for each isotype from serially diluted duplicate samples. Each symbol represents the average of triplicate values from a single mouse. Bars represent the MEAN ± SE for each group (n=7 littermate controls, n=7 BrTg mice). (B) Representative nuclear antigen staining of HEp-2 cells with sera from one of ten control, and two of eleven BrTg mice are shown. All controls were negative for ANA staining, while all 11 BrTg sera were positive. Nuclear antigen reactivity was detected using anti-mouse IgG-FITC. Magnification was at 400x.
Sera from 4 to 8 week-old mice from each of the resulting lines were assayed for antinuclear antibody (ANA) production. Littermate controls were assayed in parallel and representative results from one line are shown in Figure 2B. 100% (11 of 11) of the transgenic mice produced ANAs in mice as young as 4 weeks old, while none of the littermate controls (0 of 10) showed positive nuclear reactivity, consistent with results from FVB/N Bright transgenics (Shankar et al., 2007). Nuclear staining patterns differed from punctuate to homogeneous among different animals of the same line (Figure 2B). The variability in staining patterns suggests that the antibody response was polyclonal, rather than specific for only one type of nuclear antigen, and western blotting confirmed reactivity of individual sera with more than one protein (not shown). These data demonstrate that Bright over-expression in the B lineage was sufficient for ANA production and indicate that their production was not simply a result of global increases in all Igs.
3.3. Early tolerance checkpoints were not affected by Bright transgene over-expression
To begin to explore how Bright over-expression resulted in breaches in B cell tolerance, we asked if Bright transgenic mice might show increases in receptor editing suggesting it affected early events in B cell development. In polyclonal B cell populations, the ratio of λ to κ light chain usage is sufficient to measure alterations in levels of receptor editing (Diamant et al., 2005). Therefore, we compared the λ: κ ratio of BrTg B cells with those from littermate controls. Immature and mature B cells were analyzed using flow cytometry and average ratios of λ to κ were 1:25 in the BrTg and 1:29 in the controls (Table II). Likewise, average mature B cell λ: κ ratios were 1:14 in the transgenics versus 1:16 in the controls. Cell numbers expressing λ or κ light chains did not differ significantly between BrTgs and control mice. These data suggest that BrTg mice exhibit normal levels of receptor editing.
Table II.
The average proportion of kappa and lambda light chain expressing cells was not appreciably different between BrTg and control micea
| Control | BrTg | P value | |
|---|---|---|---|
| Immature B cells (%) | |||
| Lambda+ (B220+CD93+) | 3.13±0.13b | 3.60±0.12 | 0.093c |
| Kappa+ (B220+CD93+) | 90.8±0.55 | 87.8±0.46 | 0.060 |
| λ: κratio | 1:29 | 1:25 | |
| Mature B cells (%) | |||
| Lambda+ (B220+CD93−) | 5.19±0.11 | 6.09±0.21 | 0.100 |
| Kappa+ (B220+CD93−) | 85.5±0.73 | 82.9±1.05 | 0.107 |
| λ: κratio | 1:16 | 1:14 | |
Male mice (n = 4 littermates and n = 5 BrTg mice) were analyzed at 12 weeks of age.
Frequency (MEAN±SEM) of B220+ cells
Student’s t test
Negative selection of autoreactive B cells also occurs at the T1 B cell stage where these cells undergo rapid apoptosis in response to signals through the B cell receptor (BCR) (Carsetti et al., 1995;Petro et al., 2002;Su and Rawlings, 2002). Because T1 B cells were slightly increased in the BrTg mice, we hypothesized that those cells might allow breaches in tolerance at this checkpoint and show increased viability relative to controls. T1 B cells were sorted using markers for CD21 and CD24 to avoid signaling through the Ig receptor (Petro et al., 2002;Su and Rawlings, 2002) and were subsequently stimulated with anti-IgM (Figure 3A and B). Viabilities assessed over time showed no apparent differences in survival between BrTg T1 cells and normal controls, either with or without stimulation (Figure 3B). As expected, the T1 cells from both transgenic and littermate controls were less viable than FO B cells in both cases (Figure. 3C). Nor was there significant incorporation of H3-thymidine in response to BCR signals in either control or BrTg T1 B cells (Figure 3D), as was previously reported by Su, et al. (Su and Rawlings, 2002), which might have suggested increased cell division of the BrTg cells. These data suggest that Bright over-expression does not increase the survival of T1 B cells or alter their responses to BCR signaling.
Figure 3. BrTg and control T1 B cells exhibit similar viabilities and responses to BCR signaling.

(A) Representative sort and post-sort data for isolating T1 and FO cells are shown. Immature T1 B cells were B220+CD24hiCD21−/lo and mature FO B cells were B220+CD24+CD21+. (B) Purified T1 or (C). FO cells (1×10⁶cells/ml) were stimulated with 10μg/ml anti-IgM, or with medium alone and viabilities were assessed over time using forward/side scatter properties and 7AAD dye exclusion. Each symbol represents the mean value of quadruplicate samples from pooled cells obtained from two or more mice. Data are representative of two separate experiments. (D) Anti-IgM-treated T1 cells from littermate controls (filled bars) and BrTg mice (empty bars) were cultured for 48 hours and pulsed with [3H] thymidine 8 hours prior to harvest. Results are representative of two independent experiments.
3.4. Over-expression of Bright does not appear to cause clonal deletion of follicular B cells
Elimination of autoimmune cells can occur by apoptosis and deletion of those cells, as shown in mouse models expressing clonally related autoantibodies. Our previous data suggested that Bright over-expression allows production of B cells with multiple antigen specificities (Shankar et al., 2007). Because FO B cell numbers were greatly reduced in the Bright transgenic mice, we hypothesized that these cells might have been eliminated as an ineffective attempt to eliminate autoreactive cells from this compartment. This would suggest defects in this tolerance checkpoint. In other autoimmune models where clonal deletion occurs, the anti-apoptotic protein Bcl2 has been used to rescue autoreactive cells that would normally be deleted and allow their survival (Lang et al., 1997;Nisitani et al., 1993). Therefore, we asked if we could restore normal numbers of FO B cells in the BrTg mice if they also over-expressed Bcl2. BrTg mice were bred with mice that over-express Bcl2 from the Eμ enhancer. Bcl2 expressing littermate controls also showed expansion of B cell compartments, such that they showed approximately 3–5-fold increases in their total B cell numbers compared to non-transgenic control mice. Therefore, we examined relative increases in the BrTg x Bcl2Tg double transgenic B cell subsets directly to those obtained in the Bcl2 transgenics. FO B cell numbers in mice that expressed both BCL2 and Bright transgenes were decreased compared to the FO B cell numbers in the BCL2 transgenic mice suggesting that BCL2 did not rescue these cells. However, the double transgenic mice showed more than 5-fold increases MZ B cells compared to BCL2 transgenic MZ cell numbers (Table III). These data are consistent with the possibility that the MZ B cell compartment of BrTg mice may be dramatically enriched in clonally deleting (i.e. autoimmune) B cells. The ability of the Bcl2 transgene to hyper-expand the BrTg B cell subsets was also evident at the T1 B cell stage, albeit to a lesser degree, but not at the T3 B cell stage (Table III). Together, these data suggest that reduced numbers of FO cells in the BrTg mice are not the result of deletion of autoreactive cells.
Table III.
Bcl2 over-expression preferentially expands T1, T2 and MZ B cells in BrTg micea
| C57Bl/6 control | BrTg | Bcl2 | BrTg x Bcl2 | Average fold- increase | |
|---|---|---|---|---|---|
| Splenic cell numbers (× 106) | |||||
| Total cells | 109.6±18.5 c | 90.5±13.2 | 533.3±18.9 | 575.4±63.9 | |
| CD19+ B cells | 47.5±4.48 | 38.2.6±2.8 | 264.6±21.9 | 267.5±24.9 | |
| T1b | 5.63±0.81 | 7.39±0.76 | 14.4±2.45 | 35.7±4.22 | 2.5d |
| T2 | 8.33±1.15 | 5.12±0.47 | 34.2±6.02 | 28.0±4.68 | 0.82 |
| T3 | 2.94±0.83 | 2.41±0.49 | 20.2±4.88 | 12.1±1.65 | 0.60 |
| MZ | 2.25±0.27 | 3.69±0.32 | 7.08±2.22 | 40.1±7.17 | 5.7 |
| FO | 26.2±2.98 | 15.3±1.30 | 144.0±10.5 | 75.3±9.99 | 0.52 |
Male and female mice (n = 7 to 11 mice per group) were analyzed at 8 to 12 weeks of age.
Splenic B cell subsets were defined as in Fig 1.
Total cell numbers (MEAN±SEM) per spleen were determined by multiplying the frequency of live gated cells by total cells and are shown ×106.
Average fold increase in BrTg x Bcl2 double transgenic mice compared to Bcl2 transgenic mice was calculated by dividing the average total cell numbers for each subset.
We also considered that deletion of the FO cells might be the result of inappropriate sequestering of Bright with Btk because Btk deficient mice also exhibit defects in FO cell development (Khan et al., 1995), and Bright forms a transcription factor complex that requires Btk (Rajaiya et al., 2006;Rajaiya et al., 2005). However, Btk-deficient Bright transgenic mice did not produce ANAs (not shown), indicating that the phenotype of the BrTg mice could not be explained solely by defects resulting from inappropriate sequestering of Btk.
3.5. Constitutive Bright expression predisposes B lineage development of MZ B cells
MZ B cell numbers were increased relative to FO cell numbers in both BrTg mice and Br Tg x Bcl2-Tg double transgenic mice relative to controls. Therefore, we asked if Bright over-expression resulted in B lineage cells which were preferentially predisposed to become MZ B cells. To test this hypothesis, bone marrow chimeras were generated in which whole bone marrow cells from BrTg and/or C57Bl/6 (both Ly5.2+) mice were transferred at differing ratios into lethally irradiated Ly5.1+ congenic recipients. Splenic development of Ly5.2+ donor cells was analyzed after five weeks (Figure 4, Table IV). Engraftment of Ly5.2+ cells was equivalent in mice receiving either BrTg or control donor bone marrow, and accounted for 75% of the total cells in the recipient spleens (Figure 4A). Analyses of the engrafted donor cells from recipients which received 100% wild type control cells showed a ratio of FO to MZ B cells of 6 to 1 (Figure 4B and C), whereas recipients of 100% BrTg cells showed a FO/MZ ratio of 2 to 1. Consistent with these findings, mice which underwent competitive reconstitution with mixed numbers of BrTg and wild type cells showed intermediate ratios of FO to MZ cell development which correlated with the percent of BrTg B cells used. Increased percentages of BrTg donor B cells also resulted in decreases in total FO B cell numbers as was observed in the original BrTg lines. These data show a clear bias towards MZ B cell versus FO development in B cells over-expressing Bright, suggesting that Bright over-expression may drive B cells toward a MZ cell fate.
Figure 4. Constitutive Bright expression enhances development of MZ B cells.

(A) Four groups of three lethally irradiated mice (CD45.1+) each received 2×10⁶ bone marrow cells from C57Bl/6 or BrTg mice (CD45.2+) in the ratios of donor cells shown and engraftment of donor cells (CD45.2+) was analyzed by flow cytometry. Representative plots of one mouse from each group are shown and exhibit similar levels of engraftment as indicated. (B) Donor spleen cells were gated and analyzed for MZ vs FO cell numbers as shown by representative data for mice receiving 100% control or BrTg cells. (C) The average ratios of donor-derived FO to MZ B cells per spleen for mice from each donor group are shown with standard error bars. (D) ANA staining of sera from positive and negative controls, and sera at identical, representative dilutions from mice receiving the indicated mixtures of BrTg B donor cells are shown.
Table IV.
Bone marrow B cells over-expressing Bright preferentially develop into MZ cellsa.
| FO | MZ | Ratio | |
|---|---|---|---|
| CD45.2+ B cells splenic B cells (×106) | |||
| 0% BrTg (100% Control) | 35.40±8.70b | 5.66±0.94 | 6.18 |
| 50% BrTg (50% Control) | 39.23±1.62 | 8.47±0.27 | 4.63 |
| 75% BrTg (25% Control) | 27.77±2.23 | 6.99±0.82 | 4.01 |
| 100% BrTg (0% Control) | 22.90±3.46 | 10.65±1.14 | 2.14 |
Recipient mice (n = 3 per group) were analyzed after 5 weeks.
Total cell numbers (MEAN±SEM) per spleen were determined by multiplying the frequency of live cells gated as in Figure by the number of total cells per spleen and are shown ×106.
To determine if autoantibody production correlated with numbers of MZ B cells in the reconstituted mice, we analyzed sera from each of these mice for ANA levels. Indeed, in all but one of the twelve animals, ANA staining intensity correlated with the numbers of MZ B cells present in the mice (Figure 4D). This suggests a strong correlation between MZ B cell numbers and ANA production in the BrTg mice.
3.6. BrTg FO B cells are partially hyperactive
We next asked whether the existing BrTg FO B cells were functionally normal. B cells from some lupus-like models demonstrate increased hyperactivity including hyper-proliferation, spontaneous Ig secretion or increased basal activation (Atencio et al., 2004;Nijnik et al., 2006;Wu et al., 2007). Levels of surface markers typically associated with activation were similar on both BrTg and control FO cells (Figure 5A). Additionally, BCR and TLR4 receptor levels did not differ between control and BrTg B cells (Figure 5B). However, isolated FO B cells from BrTg mice were hyper-responsive to stimuli through both the BCR and TLR4 receptors and proliferation was significantly increased in comparison to controls (Figure 5C and D). Isolated MZ B cells from BrTg and littermate controls mice proliferated equivalently when stimulated in culture (Figure 5E). Although BrTg FO cells were hyper-proliferative, total secreted Ig levels did not differ substantially from levels obtained from stimulated control cells in either MZ or FO cultured cells (Figure 5F). Secreted Ig from neither the MZ nor the FO cultured cells contained detectable ANA antibodies (not shown). These data suggest that constitutive expression of Bright in FO cells affects some aspects of their activation through antigen receptors.
Figure 5. BrTg FO B cells exhibit normal BCR signaling responses, but are mildly hyperproliferative.

(A) FO B cells from control and BrTg mice were analyzed for surface activation markers CD25, CD86 and CD80, and (B) BCR and LPS receptors and representative histograms are shown. Staining with isotype controls are presented as gray filled histograms. Data are representative of 4 mice each. (C) Isolated BrTg and control FO cells were stimulated for 48 hours at 1×10⁶ cells/ml with the indicated concentrations of anti-IgM or LPS, (D) Proliferation was measured after an 8 hour pulse with [3H] thymidine. Bars represent the MEAN ± SE of cells isolated from two mice and assayed in quadruplicate. Data are representative of three individual experiments. P values were determined by students T-test. (E) Sorted MZ cells were stimulated with 10 μg/ml LPS and proliferation was measured as in D. (F) Sorted FO and MZ cells from three BrTg and three littermate controls were stimulated with 10 μg/ml anti-IgM and secreted Ig kappa was measured by ELISA after 5 days. Bars represent MEAN±SE values. (G) Calcium influx after BCR signaling of CD43 depleted splenic control (gray line) and BrTg (dark black line) B cells is shown. Data are representative of four independent experiments. (H) Whole cell lysates from B cells stimulated with 10μg/ml anti-IgM for the times indicated were subjected to western blotting and developed with anti-pTyrosine and anti-actin. Data are representative of three independent experiments. (I) NF-κB activity was assessed by EMSA from nuclear extracts prepared from 1×10⁶ sorted FO B cells stimulated with 10μg/ml anti-IgM or LPS for 18 hours. Western blots of duplicate samples were developed for actin as a loading control (bottom panel).
To determine if proximal signaling responses were also affected by Bright expression, resting B cells were loaded with INDO-1, and Ca2+ influx was measured in response to BCR stimulation. Relative to baseline Ca2+ levels, transgenic B cells showed similar increases in magnitude of intracellular Ca2+ compared to control B cells (Figure 5G), suggesting that early membrane signals were not impaired or amplified in the transgenic B cells. Likewise, BrTg and control FO cells exhibited similar global tyrosine phosphorylation kinetics (Figure 5H). NF-κB is a more distal signaling intermediate common to both the BCR and TLR4 signaling pathways and was shown to be hyperactive in other autoimmune models (Wu et al., 2007). We measured NF-κB binding activity 18 hour post-stimulation by EMSA. Basal NF-κB levels were consistently 3-fold lower in FO B cells from BrTg mice than in controls (Figure 5I) compare lanes 1 and 4). However, antigen stimulation led to equivalent increases in levels of NF-κB DNA-binding activity, as assessed using ImageJ software, in both transgenic and control B cells (Figure 5I compare lanes 2 and 3 to 5 and 6). Together, these data demonstrate minor differences in some properties of FO BrTg B cells versus controls, but suggest that the transgenic FO B cells are capable of normal responses through the BCR.
3.7. BrTg FO B cells exhibit MZ-like gene expression profiles
Kin, et al. (Kin et al., 2008), showed that a subset of genes were differentially expressed in FO and MZ B cells from C57Bl/6 mice such that those genes expressed at high levels in MZ cells were expressed at very low levels in FO cells, and vice versa. Because constitutive Bright expression favored MZ development, we asked if the gene expression profile of Bright transgenic B cells compared to control B cells would also indicate a predisposition toward MZ gene expression. Preliminary array data (not shown) obtained from total BrTg versus littermate control, CD43-depleted splenic B cells showed differential expression of 25 of the 29 genes described by Kin et al., to be consistently over-expressed in MZ versus FO cells in multiple mouse strains (Kin et al., 2008). To control for differences in MZ versus FO cell numbers in the BrTg versus control mice, QRT-PCR analyses were performed using RNA obtained from sorted BrTg and littermate control FO and MZ B cells. Relative expression levels of five representative genes are shown in Figure 6. All data were standardized against actin levels, and then are presented compared to the expression level obtained for FO control cells which was given a value of 100% or 1.0. Although expression levels of KLF4, Notch2, Hes1 and BclxL were similar in MZ cells from both BrTg and control mice, expression of these same genes in BrTg FO cells was much lower than in control FO cells, and resembled levels observed in MZ cells from both transgenic and control mice. The exception was cMyc which showed lower than normal expression levels in BrTg MZ B cells compared to control MZ B cells (Figure 6). These data demonstrate that over-expression of Bright in FO cells (which do not normally express this protein) alters the gene expression profile of the transgenic FO cells to more closely resemble that of control MZ B cells.
Figure 6. Bright expression in FO B cells alters gene expression profiles.

QRT-PCR was performed on RNA isolated from sorted control (open bars) and BrTg (filled bars) FO and MZ B cells. Values were standardized to actin levels from individual samples. For comparison, values of control FO cells were arbitrarily set at 1.0 in each case, and the other data are presented relative to that value. Reactions were performed in triplicate and MEAN±SEM are shown. P values were determined by students T test.
4. Discussion
4.1. Constitutive Bright expression during B cell maturation preferentially leads to marginal zone B cells
In this study, transgenic mice that failed to down-regulate Bright expression in T2 and FO splenic B cells showed skewed development toward marginal zone rather than follicular B cell development. Constitutive Bright expression was sufficient to cause autoantibody production on the non-autoimmune, C57Bl/6 background, and ANA production was directly associated with increases in the MZ B cell subset. Intriguingly, our data also demonstrate that transgenic Bright resulted in alterations in transcription of genes typically differentially expressed in FO versus MZ cells such that many genes in the transgenic FO B cells were expressed at levels that more closely resembled control MZ cells rather than control FO B cells. Together, these data show that Bright plays a critical role in developmental pathways leading to maturation of splenic B cells, and suggest that these Bright-mediated effects may be the result of alterations in gene expression profiles.
MZ versus FO cell differentiation has been shown to be influenced in part by B cell receptor (BCR) signaling strength, where strong signals are required for FO development and weaker signals are permissive for MZ B cell development (reviewed in (Pillai and Cariappa, 2009)). BCR surface levels did not differ appreciably between BrTg and control spleen cells at any stage of B cell development (Figures 1 and 5). Moreover, BrTg FO cells exhibited normal signaling responses as measured by Ca2+ influx and tyrosine phosphorylation of downstream mediators (Figure 5). Carey et al, suggested that MZ cells could be derived directly from the T1 immature B cell subset based on similarities in surface marker expression and CDR3 characteristics that preclude cells at the T2 developmental stage (Carey et al., 2008). Indeed, the BrTg mice exhibit slightly decreased numbers of T2 cells (Table I) which might be consistent with the idea that Bright over-expression shunts cells towards the MZ compartment early during differentiation, thus accounting for the depletion in both T2 and FO cells. Because transgenic FO cells exhibit altered gene expression patterns, it is also possible that these cells could also directly differentiate into FO cells, accounting for the decreased FO numbers, but we consider this to be less likely.
Several other proteins have been shown to contribute directly to the MZ versus FO developmental pathway. Notch-2 is a critical player in this lineage decision (reviewed in (Pillai and Cariappa, 2009)). However, over- or under-expression of these proteins does not reproduce the full phenotype of the BrTg mice. For example, c-fos over-expression increases numbers of MZ cells, but not FO cells (Yamashita et al., 2005). Mzb1 protein is expressed specifically in MZ cells rather than FO cells and contributes directly to signaling strength and antibody production (Flach et al., 2010). FO B cell generation is dependent on expression of the ets family of transcription factors, PU.1, Spi-B and Spi-C (DeKoter et al., 2010), but this correlates with direct effects on the surface marker CD23. Intriguingly, KLF-2 deficiency results in increased numbers of MZ cells and FO cells that exhibit some characteristics of normal MZ cells, much like our BrTg B cells (Hart et al., 2011;Winkelmann et al., 2011). It is not yet clear how Bright regulation is linked to these other proteins.
4.2. Bright transgenic mice show normal functions at tolerance checkpoints
Although we originally hypothesized that ANA production in the BrTg mice would correlate with defects in known tolerance checkpoints, this was not the case. Numbers of anergic T3 B cells were normal (Table I), suggesting Bright over-expression and ANA production did not occur from failure to produce this subpopulation. In the NZB/W lupus model, inappropriate responses to BCR stimulation led to the aberrant survival of T1 B cells (Roy et al., 2005), but BrTg T1 B cell numbers were not increased and these cells demonstrated normal viability and proliferative responses to BCR stimulation in vitro (Figure 3). MRL/lpr lupus prone mice show decreased levels of receptor editing (i.e. decreased proportion of λ+ expressing cells), which likely contributes to the breaches in tolerance seen in this model (Lamoureux et al., 2007). However, λ: κ ratios were similar between BrTg and control B cells (Table II), implying that ANA production was not the result of gross defects in receptor editing. Therefore, Bright expression does not result in ANA production through obvious breaches in these well-characterized tolerance checkpoints.
4.3. Autoantibody production correlates with numbers of marginal zone B cells
Reconstitution experiments suggested that ANA production correlated with numbers of BrTg MZ B cells (Figure 4). Several lupus-prone mouse strains, including the NZB/W F1 hybrid and MRL/lpr, have increased MZ B cells (Atencio et al., 2004;Nijnik et al., 2006), and autoreactive B cells were shown previously to preferentially populate the MZ (Martin and Kearney, 2002;O’Reilly et al., 1997). Other studies also suggest that MZ B cells are enriched for autoreactive clones compared to FO B cells (Cyster et al., 1994;Martin and Kearney, 2000). Chromosome 13 transgenic mice show skewing of splenic B cell subpopulations similar to our BrTg mice and also produce autoantibodies (Loh et al., 2011). However, the BrTg mice did not show altered surface activation markers as was found in the congenic mice. The murine lupus susceptibility locus Sle2a was also shown to recruit B cells to the MZ compartment (Zeumer et al., 2011). Consistent with these observations, over-expression of both Bright and Bcl2 in MZ B cells resulted in a >5-fold expansion of cells compared to Bcl2-only expressing MZ B cells (Table III). This result could be due to increased numbers of autoreactive cells that were rescued from apoptosis within the MZ subpopulation of BrTg mice, or it could be the result of undefined synergistic actions between Bright and Bcl2 specific to the MZ cell subpopulation. In any case, our results strongly suggest that Bright-induced ANA production is strongly associated with a MZ cell phenotype.
Secreted antibodies from either sorted MZ and FO B cells stimulated with LPS in vitro failed to show consistent ANA staining in any of four experiments, making it difficult to exclude the possibility that ANAs are also derived from activated BrTg FO cells. Several lines of evidence suggest that BrTg FO cells differ functionally and phenotypically from control FO cells. BrTg FO cells were consistently hyperproliferative to both BCR and TLR4 signals when compared to control FO cells, although the differences were less than two-fold (Figure 5). MZ B cells typically respond more robustly to LPS stimulation in vitro than do FO cells (Oliver et al., 1997). However, the BrTg MZ B cells were not hyperproliferative compared to their control MZ counterparts. Other autoimmune transgenic models show increased B cell proliferation, including the c-Myc Tg (Refaeli et al., 2005) and Fli-1 Tg (Bradshaw et al., 2008) models, and it is possible that Bright contributes to shared pathways with these transgenes. More importantly, BrTg FO B cells exhibit altered gene expression patterns that suggest that the reduced numbers of FO cells that develop in the BrTg show broad similarities at the transcription level to normal MZ B cells with some similarities to KLF-2 deficient FO cells (Hart et al., 2011;Winkelmann et al., 2011). KLF4 is a negative regulator of B cell proliferation and is normally expressed at lower levels in MZ B cells compared to the FO cells (Kin et al., 2008). Over-expression of Bright caused decreased KLF4 levels in BrTg FO cells that resembled levels found in both control and BrTg MZ cells. Nonetheless, BrTg FO cells also differ substantially from control and BrTg MZ cells. For example, the surface markers which define FO versus MZ B cells allow designation of the BrTg cells as FO cells. Furthermore, it seems likely that specific environmental niches and limiting accessory cell types, such as MZ macrophages, may affect gene expression patterns of the BrTg FO cells so that they will also be functionally different from typical MZ cells. Intriguingly, the Sle2 locus, which has been linked to MZ development in lupus models, contains the KLF4 gene (Zeumer et al., 2011). It will be important to examine earlier stages of B cell development, such as the T1 and T2 stages, for expression of this gene, to determine if Bright mediated gene expression patterns that may ultimately affect MZ versus FO development occur there as well.
4.4. Bright over-expression does not mimic a Btk-deficient phenotype
The most striking effect of Bright over-expression in B lineage cells was the skewing of the MZ/FO ratio. Although MZ cell numbers were only increased 1.5-fold over control cell numbers in BrTg spleens, BrTg FO cell numbers were decreased by half (Table I). Because Bright associates with Btk and Btk-deficient mice also develop approximately half the normal number of FO spleen cells, we considered the possibility that decreases in FO cell development in the BrTg mice could be the result of inappropriate sequestration of Btk which then resulted in blocks in development at the FO cell stage. Several arguments can be made that this was not the case. B cells from Btk deficient mice exhibit reduced Ca2+ mobilization (Fluckiger et al., 1998) and proliferation (Satterthwaite et al., 1997) in response to BCR signaling, whereas BrTg B cells mobilize Ca2+ similarly to normal cells (Figure 5). Secondly, serum Ig levels are reduced in Btk deficient mice, presumably due to decreases in recirculating Ig-secreting B cells in the bone marrow (Khan et al., 1995). Serum Ig levels were normal in the BrTg mice (Figure 2), as were numbers of recirculating B cells (Table I). Moreover, all of the BrTg mice produced ANAs, a phenotype not observed in Btk deficient mice at any dilution of serum. Therefore, the decrease in FO B cells likely results from a mechanism independent of Btk depletion.
4.5. Bright affects expression of multiple genes which may be associated with autoimmunity
We have recently shown that inhibition of Bright function alone results in alterations in global gene expression patterns such that the resulting cells develop pluripotent tendencies (An et al., 2010), and suggesting that alterations in Bright levels may broadly impact gene expression and development of specific cell types. Intriguingly, Bright deficiency results in increased KLF4 levels, which are necessary for reprogramming cells to a pluripotent state. These data suggest that Bright may function together, or with other associated proteins, to produce epigenetic changes in gene expression patterns. Lupus is clearly a multigenic disease and recent papers suggest that epigenetic mediators may play a role in its pathology. Interestingly, we found that the human orthologue of Bright, ARID3a, is expressed at abnormally high levels in approximately half of lupus patients we examined (our unpublished data). Thus, Bright/ARID3a may also contribute to ANA production in human autoimmunity.
5. Conclusions
These data confirm that over-expression of Bright in B lymphocytes leads to ANA production on the non-autoimmune C57Bl/6 background. However, constitutive Bright expression in these mice had additional effects on the development of mature B cell subsets, not observed in FVB/N BrTg mice (Shankar et al., 2007), suggesting that appropriate regulation of the transcription factor Bright is critical for normal development of mature B cell subsets. Moreover, constitutive Bright expression in B lineage cells is associated with autoantibody production that correlates with increased numbers of MZ cells rather than with noticeable breaches in earlier tolerance checkpoints. Understanding which genes this transcription factor regulates during B cell differentiation may suggest new targets for interfering with autoantibody production.
Highlights.
The transcription factor Bright was over-expressed in murine B lineage cells.
Bright over-expression skewed mature B cell development toward marginal zone cells.
Bright transgenic mice produced autoantibodies.
Autoantibody production was associated with numbers of marginal zone B cells.
Transgenic follicular B cell gene expression resembled marginal zone B cells.
Acknowledgments
The authors wish to thank Dr. J. Kearney and Dr. M. Coggeshall for technical advice and Dr. S. Kovats and Dr. J. Yaciuk for critically reading the manuscript. This work was supported by NIH AI044215 to CFW and Kirschstein NRSA training grant#T32 AI007633 for ALO.
Abbreviations
- Bright
B cell regulator of immunoglobulin heavy chain transcription
- MZ
marginal zone
- ARID
AT-rich interaction domain
- Ig
immunoglobulin
- Btk
Bruton’s tyrosine kinase
- FO
follicular
- BrTg
Bright transgenic
- ANA
antinuclear antibody
- BCR
B cell receptor
Footnotes
Disclosures
The authors have no financial conflicts of interest.
Publisher's Disclaimer: This is a PDF file of an unedited manuscript that has been accepted for publication. As a service to our customers we are providing this early version of the manuscript. The manuscript will undergo copyediting, typesetting, and review of the resulting proof before it is published in its final citable form. Please note that during the production process errors may be discovered which could affect the content, and all legal disclaimers that apply to the journal pertain.
References
- Allman D, Lindsley RC, DeMuth W, Rudd K, Shinton SA, Hardy RR. Resolution of three nonproliferative immature splenic B cell subsets reveals multiple selection points during peripheral B cell maturation. J Immunol. 2001;167:6834–6840. doi: 10.4049/jimmunol.167.12.6834. [DOI] [PubMed] [Google Scholar]
- Allman D, Pillai S. Peripheral B cell subsets. Curr Opin Immunol. 2008;20:149–157. doi: 10.1016/j.coi.2008.03.014. [DOI] [PMC free article] [PubMed] [Google Scholar]
- An G, Miner CA, Nixon JC, Kincade PW, Bryant J, Tucker PW, Webb CF. Loss of Bright/ARID3a Function Promotes Developmental Plasticity. Stem Cells. 2010;28:1560–1567. doi: 10.1002/stem.491. [DOI] [PMC free article] [PubMed] [Google Scholar]
- Andrews SF, Rawlings DJ. Transitional B cells exhibit a B cell receptor-specific nuclear defect in gene transcription. J Immunol. 2009;182:2868–2878. doi: 10.4049/jimmunol.0802368. [DOI] [PMC free article] [PubMed] [Google Scholar]
- Atencio S, Amano H, Izui S, Kotzin BL. Separation of the New Zealand Black genetic contribution to lupus from New Zealand Black determined expansions of marginal zone B and B1a cells. J Immunol. 2004;172:4159–4166. doi: 10.4049/jimmunol.172.7.4159. [DOI] [PubMed] [Google Scholar]
- Ayoub N, Noma K, Isaac S, Kahan T, Grewal SI, Cohen A. A novel jmjC domain protein modulates heterochromatization in fission yeast. Mol Cell Biol. 2003;23:4356–4370. doi: 10.1128/MCB.23.12.4356-4370.2003. [DOI] [PMC free article] [PubMed] [Google Scholar]
- Batten M, Groom J, Cachero TG, Qian F, Schneider P, Tschopp J, Browning JL, Mackay F. BAFF mediates survival of peripheral immature B lymphocytes. J Exp Med. 2000;192:1453–1466. doi: 10.1084/jem.192.10.1453. [DOI] [PMC free article] [PubMed] [Google Scholar]
- Bradshaw S, Zheng WJ, Tsoi LC, Gilkeson G, Zhang XK. A role for Fli-1 in B cell proliferation: Implications for SLE pathogenesis. Clin Immunol. 2008;129:19–30. doi: 10.1016/j.clim.2008.05.010. [DOI] [PMC free article] [PubMed] [Google Scholar]
- Bygrave AE, Rose KL, Cortes-Hernandez J, Warren J, Rigby RJ, Cook HT, Walport MJ, Vyse TJ, Botto M. Spontaneous autoimmunity in 129 and C57BL/6 mice-implications for autoimmunity described in gene-targeted mice. PLoS Biol. 2004;2:E243. doi: 10.1371/journal.pbio.0020243. [DOI] [PMC free article] [PubMed] [Google Scholar]
- Carey JB, Moffatt-Blue CS, Watson LC, Gavin AL, Feeney AJ. Repertoire-based selection into the marginal zone compartment during B cell development. J Exp Med. 2008;205:2043–2052. doi: 10.1084/jem.20080559. [DOI] [PMC free article] [PubMed] [Google Scholar]
- Carsetti R, Kohler G, Lamers MC. Transitional B cells are the target of negative selection in the B cell compartment. J Exp Med. 1995;181:2129–2140. doi: 10.1084/jem.181.6.2129. [DOI] [PMC free article] [PubMed] [Google Scholar]
- Cooney DS, Phee H, Jacob A, Coggeshall KM. Signal transduction by human-restricted Fc gamma RIIa involves three distinct cytoplasmic kinase families leading to phagocytosis. J Immunol. 2001;167:844–854. doi: 10.4049/jimmunol.167.2.844. [DOI] [PubMed] [Google Scholar]
- Cyster JG, Hartley SB, Goodnow CC. Competition for follicular niches excludes self-reactive cells from the recirculating B-cell repertoire. Nature. 1994;371:389–395. doi: 10.1038/371389a0. [DOI] [PubMed] [Google Scholar]
- DeKoter RP, Geadah M, Khoosal S, Xu LS, Thillainadesan G, Torchia J, Chin SS, Garrett-Sinha LA. Regulation of follicular B cell differentiation by the related E26 transformation-specific transcription factors PU.1, Spi-B, and Spi-C. J Immunol. 2010;185:7374–7384. doi: 10.4049/jimmunol.1001413. [DOI] [PubMed] [Google Scholar]
- Diamant E, Keren Z, Melamed D. CD19 regulates positive selection and maturation in B lymphopoiesis: lack of CD19 imposes developmental arrest of immature B cells and consequential stimulation of receptor editing. Blood. 2005;105:3247–3254. doi: 10.1182/blood-2004-08-3165. [DOI] [PubMed] [Google Scholar]
- Dignam JD, Lebovitz RM, Roeder RG. Accurate transcription initiation by RNA polymerase II in a soluble extract from isolated mammalian nuclei. Nucleic Acids Res. 1983;11:1475–1489. doi: 10.1093/nar/11.5.1475. [DOI] [PMC free article] [PubMed] [Google Scholar]
- Fairhurst AM, Wandstrat AE, Wakeland EK. Systemic lupus erythematosus: multiple immunological phenotypes in a complex genetic disease. Adv Immunol. 2006;92:1–69. doi: 10.1016/S0065-2776(06)92001-X. [DOI] [PubMed] [Google Scholar]
- Flach H, Rosenbaum M, Duchniewicz M, Kim S, Zhang SL, Cahalan MD, Mittler G, Grosschedl R. Mzb1 protein regulates calcium homeostasis, antibody secretion, and integrin activation in innate-like B cells. Immunity. 2010;33:723–735. doi: 10.1016/j.immuni.2010.11.013. [DOI] [PMC free article] [PubMed] [Google Scholar]
- Fluckiger AC, Li ZM, Kato RM, Wahl MI, Ochs HD, Longnecker R, Kinet JP, Witte ON, Scharenberg AM, Rawlings DJ. Btk/Tec kinases regulate sustained increases in intracellular Ca2+ following B-cell receptor activation. EMBO J. 1998;17:1973–1985. doi: 10.1093/emboj/17.7.1973. [DOI] [PMC free article] [PubMed] [Google Scholar]
- Gay D, Saunders T, Camper S, Weigert M. Receptor editing: an approach by autoreactive B cells to escape tolerance. J Exp Med. 1993;177:999–1008. doi: 10.1084/jem.177.4.999. [DOI] [PMC free article] [PubMed] [Google Scholar]
- Goodnow CC, Crosbie J, Adelstein S, Lavoie TB, Smith-Gill SJ, Brink RA, Pritchard-Briscoe H, Wotherspoon JS, Loblay RH, Raphael K, Trent RJ, Basten A. Altered immunoglobulin expression and functional silencing of self-reactive B lymphocytes in transgenic mice. Nature. 1988;334:676–682. doi: 10.1038/334676a0. [DOI] [PubMed] [Google Scholar]
- Hart GT, Wang X, Hogquist KA, Jameson SC. Kruppel-like factor 2 (KLF2) regulates B-cell reactivity, subset differentiation, and trafficking molecule expression. Proc Natl Acad Sci U S A. 2011;108:716–721. doi: 10.1073/pnas.1013168108. [DOI] [PMC free article] [PubMed] [Google Scholar]
- Hartley SB, Cooke MP, Fulcher DA, Harris AW, Cory S, Basten A, Goodnow CC. Elimination of self-reactive B lymphocytes proceeds in two stages: arrested development and cell death. Cell. 1993;72:325–335. doi: 10.1016/0092-8674(93)90111-3. [DOI] [PubMed] [Google Scholar]
- Herrscher RF, Kaplan MH, Lelsz DL, Das C, Scheuermann R, Tucker PW. The immunoglobulin heavy-chain matrix-associating regions are bound by Bright: a B cell-specific trans-activator that describes a new DNA-binding protein family. Genes Dev. 1995;9:3067–3082. doi: 10.1101/gad.9.24.3067. [DOI] [PubMed] [Google Scholar]
- Johnston CM, Wood AL, Bolland DJ, Corcoran AE. Complete sequence assembly and characterization of the C57BL/6 mouse Ig heavy chain V region. The Journal of Immunology. 2006;176:4221–4234. doi: 10.4049/jimmunol.176.7.4221. [DOI] [PubMed] [Google Scholar]
- Khan WN, Alt FW, Gerstein RM, Malynn BA, Larsson I, Rathbun G, Davidson L, Muller S, Kantor AB, Herzenberg LA, Rosen FS, Sideras P. Defective B cell development and function in Btk-deficient mice. Immunity. 1995;3:283–299. doi: 10.1016/1074-7613(95)90114-0. [DOI] [PubMed] [Google Scholar]
- Kin NW, Crawford DM, Liu J, Behrens TW, Kearney JF. DNA microarray gene expression profile of marginal zone versus follicular B cells and idiotype positive marginal zone B cells before and after immunization with Streptococcus pneumoniae. J Immunol. 2008;180:6663–6674. doi: 10.4049/jimmunol.180.10.6663. [DOI] [PMC free article] [PubMed] [Google Scholar]
- Lai A, Kennedy BK, Barbie DA, Bertos NR, Yang XJ, Theberge MC, Tsai SC, Seto E, Zhang Y, Kuzmichev A, Lane WS, Reinberg D, Harlow E, Branton PE. RBP1 recruits the mSIN3-histone deacetylase complex to the pocket of retinoblastoma tumor suppressor family proteins found in limited discrete regions of the nucleus at growth arrest. Mol Cell Biol. 2001;21:2918–2932. doi: 10.1128/MCB.21.8.2918-2932.2001. [DOI] [PMC free article] [PubMed] [Google Scholar]
- Lamoureux JL, Watson LC, Cherrier M, Skog P, Nemazee D, Feeney AJ. Reduced receptor editing in lupus-prone MRL/lpr mice. J Exp Med. 2007;204:2853–2864. doi: 10.1084/jem.20071268. [DOI] [PMC free article] [PubMed] [Google Scholar]
- Lang J, Arnold B, Hammerling G, Harris AW, Korsmeyer S, Russell D, Strasser A, Nemazee D. Enforced Bcl-2 expression inhibits antigen-mediated clonal elimination of peripheral B cells in an antigen dose-dependent manner and promotes receptor editing in autoreactive, immature B cells. Journal of Experimental Medicine. 1997;186:1513–1522. doi: 10.1084/jem.186.9.1513. [DOI] [PMC free article] [PubMed] [Google Scholar]
- Lin D, Ippolito GC, Zong RT, Bryant J, Koslovsky J, Tucker P. Bright/ARID3A contributes to chromatin accessibility of the immunoglobulin heavy chain enhancer. Mol Cancer. 2007;6:23. doi: 10.1186/1476-4598-6-23. [DOI] [PMC free article] [PubMed] [Google Scholar]
- Loder F, Mutschler B, Ray RJ, Paige CJ, Sideras P, Torres R, Lamers MC, Carsetti R. B cell development in the spleen takes place in discrete steps and is determined by the quality of B cell receptor-derived signals. Journal of Experimental Medicine. 1999;190:75–89. doi: 10.1084/jem.190.1.75. [DOI] [PMC free article] [PubMed] [Google Scholar]
- Loh C, Pau E, Chang NH, Wither JE. An intrinsic B-cell defect supports autoimmunity in New Zealand black chromosome 13 congenic mice. Eur J Immunol. 2011;41:527–536. doi: 10.1002/eji.201040983. [DOI] [PubMed] [Google Scholar]
- Maier SM, Gross JK, Hamlin KL, Maier JL, Workman JL, Kim-Howard XR, Schoeb TR, Farris AD. Proteinuria of nonautoimmune origin in wild-type FVB/NJ mice. Comp Med. 2007;57:255–266. [PubMed] [Google Scholar]
- Malhotra S, Kovats S, Zhang W, Coggeshall KM. B cell antigen receptor endocytosis and antigen presentation to T cells require Vav and dynamin. J Biol Chem. 2009;284:24088–24097. doi: 10.1074/jbc.M109.014209. [DOI] [PMC free article] [PubMed] [Google Scholar]
- Martin F, Kearney JF. B-cell subsets and the mature preimmune repertoire. Marginal zone and B1 B cells as part of a “natural immune memory”. Immunol Rev. 2000;175:70–79. [PubMed] [Google Scholar]
- Martin F, Kearney JF. Marginal-zone B cells. Nat Rev Immunol. 2002;2:323–335. doi: 10.1038/nri799. [DOI] [PubMed] [Google Scholar]
- Merrell KT, Benschop RJ, Gauld SB, Aviszus K, Decote-Ricardo D, Wysocki LJ, Cambier JC. Identification of anergic B cells within a wild-type repertoire. Immunity. 2006;25:953–962. doi: 10.1016/j.immuni.2006.10.017. [DOI] [PubMed] [Google Scholar]
- Nemazee D, Weigert M. Revising B cell receptors. Journal of Experimental Medicine. 2000;191:1813–1817. doi: 10.1084/jem.191.11.1813. [DOI] [PMC free article] [PubMed] [Google Scholar]
- Nemazee DA, Burki K. Clonal deletion of B lymphocytes in a transgenic mouse bearing anti-MHC class I antibody genes. Nature. 1989;337:562–566. doi: 10.1038/337562a0. [DOI] [PubMed] [Google Scholar]
- Nijnik A, Ferry H, Lewis G, Rapsomaniki E, Leung JC, Daser A, Lambe T, Goodnow CC, Cornall RJ. Spontaneous B cell hyperactivity in autoimmune-prone MRL mice. Int Immunol. 2006;18:1127–1137. doi: 10.1093/intimm/dxl047. [DOI] [PubMed] [Google Scholar]
- Nisitani S, Tsubata T, Murakami M, Okamoto M, Honjo T. The bcl-2 gene product inhibits clonal deletion of self-reactive B lymphocytes in the periphery but not in the bone marrow. J Exp Med. 1993;178:1247–1254. doi: 10.1084/jem.178.4.1247. [DOI] [PMC free article] [PubMed] [Google Scholar]
- Nixon JC, Ferrell S, Miner C, Oldham AL, Hochgeschwender U, Webb CF. Transgenic mice expressing dominant-negative bright exhibit defects in B1 B cells. J Immunol. 2008;181:6913–6922. doi: 10.4049/jimmunol.181.10.6913. [DOI] [PMC free article] [PubMed] [Google Scholar]
- Nixon JC, Rajaiya J, Webb CF. Mutations in the DNA-binding domain of the transcription factor Bright act as dominant negative proteins and interfere with immunoglobulin transactivation. J Biol Chem. 2004a;279:52465–52472. doi: 10.1074/jbc.M403028200. [DOI] [PubMed] [Google Scholar]
- Nixon JC, Rajaiya JB, Ayers N, Evetts S, Webb CF. The transcription factor, Bright, is not expressed in all human B lymphocyte subpopulations. Cell Immunol. 2004b;228:42–53. doi: 10.1016/j.cellimm.2004.03.004. [DOI] [PubMed] [Google Scholar]
- O’Reilly LA, Harris AW, Tarlinton DM, Corcoran LM, Strasser A. Expression of a bcl-2 transgene reduces proliferation and slows turnover of developing B lymphocytes in vivo. J Immunol. 1997;159:2301–2311. [PubMed] [Google Scholar]
- Okamoto M, Murakami M, Shimizu A, Ozaki S, Tsubata T, Kumagai S, Honjo T. A transgenic model of autoimmune hemolytic anemia. J Exp Med. 1992;175:71–79. doi: 10.1084/jem.175.1.71. [DOI] [PMC free article] [PubMed] [Google Scholar]
- Oliver AM, Martin F, Gartland GL, Carter RH, Kearney JF. Marginal zone B cells exhibit unique activation, proliferative and immunoglobulin secretory responses. Eur J Immunol. 1997;27:2366–2374. doi: 10.1002/eji.1830270935. [DOI] [PubMed] [Google Scholar]
- Oliver AM, Martin F, Kearney JF. IgMhighCD21high lymphocytes enriched in the splenic marginal zone generate effector cells more rapidly than the bulk of follicular B cells. J Immunol. 1999;162:7198–7207. [PubMed] [Google Scholar]
- Petro JB, Gerstein RM, Lowe J, Carter RS, Shinners N, Khan WN. Transitional type 1 and 2 B lymphocyte subsets are differentially responsive to antigen receptor signaling. J Biol Chem. 2002;277:48009–48019. doi: 10.1074/jbc.M200305200. [DOI] [PubMed] [Google Scholar]
- Pillai S, Cariappa A. The follicular versus marginal zone B lymphocyte cell fate decision. Nat Rev Immunol. 2009;9:767–777. doi: 10.1038/nri2656. [DOI] [PubMed] [Google Scholar]
- Rajaiya J, Hatfield M, Nixon JC, Rawlings DJ, Webb CF. Bruton’s tyrosine kinase regulates immunoglobulin promoter activation in association with the transcription factor Bright. Mol Cell Biol. 2005;25:2073–2084. doi: 10.1128/MCB.25.6.2073-2084.2005. [DOI] [PMC free article] [PubMed] [Google Scholar]
- Rajaiya J, Nixon JC, Ayers N, Desgranges ZP, Roy AL, Webb CF. Induction of immunoglobulin heavy chain transcription through the transcription factor Bright requires TFII-I. Mol Cell Biol. 2006;26:4758–4768. doi: 10.1128/MCB.02009-05. [DOI] [PMC free article] [PubMed] [Google Scholar]
- Refaeli Y, Field KA, Turner BC, Trumpp A, Bishop JM. The protooncogene MYC can break B cell tolerance. Proc Natl Acad Sci U S A. 2005;102:4097–4102. doi: 10.1073/pnas.0409832102. [DOI] [PMC free article] [PubMed] [Google Scholar]
- Roy V, Chang NH, Cai Y, Bonventi G, Wither J. Aberrant IgM signaling promotes survival of transitional T1 B cells and prevents tolerance induction in lupus-prone New Zealand Black mice. J Immunol. 2005;175:7363–7371. doi: 10.4049/jimmunol.175.11.7363. [DOI] [PubMed] [Google Scholar]
- Satterthwaite AB, Cheroutre H, Khan WN, Sideras P, Witte ON. Btk dosage determines sensitivity to B cell antigen receptor cross-linking. Proc Natl Acad Sci USA. 1997;94:13152–13157. doi: 10.1073/pnas.94.24.13152. [DOI] [PMC free article] [PubMed] [Google Scholar]
- Shankar M, Nixon JC, Maier S, Workman J, Farris AD, Webb CF. Anti-nuclear antibody production and autoimmunity in transgenic mice that over-express the transcription factor Bright. J Immunol. 2007;178:2996–3006. doi: 10.4049/jimmunol.178.5.2996. [DOI] [PMC free article] [PubMed] [Google Scholar]
- Su TT, Guo B, Wei B, Braun J, Rawlings DJ. Signaling in transitional type 2 B cells is critical for peripheral B-cell development. Immunol Rev. 2004;197:161–178. doi: 10.1111/j.0105-2896.2004.0102.x. [DOI] [PubMed] [Google Scholar]
- Su TT, Rawlings DJ. Transitional B lymphocyte subsets operate as distinct checkpoints in murine splenic B cell development. J Immunol. 2002;168:2101–2110. doi: 10.4049/jimmunol.168.5.2101. [DOI] [PubMed] [Google Scholar]
- Teague BN, Pan Y, Mudd PA, Nakken B, Zhang Q, Szodoray P, Kim-Howard X, Wilson PC, Farris AD. Cutting edge: Transitional T3 B cells do not give rise to mature B cells, have undergone selection, and are reduced in murine lupus. J Immunol. 2007;178:7511–7515. doi: 10.4049/jimmunol.178.12.7511. [DOI] [PubMed] [Google Scholar]
- Vidal S, Kono DH, Theofilopoulos AN. Loci predisposing to autoimmunity in MRL-Fas lpr and C57BL/6-Faslpr mice. J Clin Invest. 1998;101:696–702. doi: 10.1172/JCI1817. [DOI] [PMC free article] [PubMed] [Google Scholar]
- Webb CF. The transcription factor, Bright, and immunoglobulin heavy chain expression. Immunol Res. 2001;24:149–161. doi: 10.1385/IR:24:2:149. [DOI] [PubMed] [Google Scholar]
- Webb CF, Bryant J, Popowski M, Allred L, Kim D, Harriss J, Schmidt C, Miner CA, Rose K, Cheng HL, Griffin C, Tucker PW. The ARID Family Transcription Factor Bright Is Required for both Hematopoietic Stem Cell and B Lineage Development. Mol Cell Biol. 2011;31:1041–1053. doi: 10.1128/MCB.01448-10. [DOI] [PMC free article] [PubMed] [Google Scholar]
- Webb CF, Das C, Coffman RL, Tucker PW. Induction of immunoglobulin μ mRNA in a B cell transfectant stimulated with interleukin-5 and a T-dependent antigen. J Immunol. 1989;143:3934–3939. [PubMed] [Google Scholar]
- Webb CF, Smith EA, Medina KL, Buchanan KL, Smithson G, Dou S. Expression of Bright at two distinct stages of B lymphocyte development. J Immunol. 1998;160:4747–4754. [PubMed] [Google Scholar]
- Webb CF, Yamashita Y, Ayers N, Evetts S, Paulin Y, Conley ME, Smith EA. The transcription factor Bright associates with Bruton’s tyrosine kinase, the defective protein in immunodeficiency disease. J Immunol. 2000;165:6956–6965. doi: 10.4049/jimmunol.165.12.6956. [DOI] [PubMed] [Google Scholar]
- Winkelmann R, Sandrock L, Porstner M, Roth E, Mathews M, Hobeika E, Reth M, Kahn ML, Schuh W, Jack HM. B cell homeostasis and plasma cell homing controlled by Kruppel-like factor 2. Proc Natl Acad Sci U S A. 2011;108:710–715. doi: 10.1073/pnas.1012858108. [DOI] [PMC free article] [PubMed] [Google Scholar]
- Wu T, Qin X, Kurepa Z, Kumar KR, Liu K, Kanta H, Zhou XJ, Satterthwaite AB, Davis LS, Mohan C. Shared signaling networks active in B cells isolated from genetically distinct mouse models of lupus. J Clin Invest. 2007;117:2186–2196. doi: 10.1172/JCI30398. [DOI] [PMC free article] [PubMed] [Google Scholar]
- Yamashita K, Sakamoto A, Ohkubo Y, Arima M, Hatano M, Kuroda Y, Tokuhisa T. c-fos Overexpression in splenic B cells augments development of marginal zone B cells. Mol Immunol. 2005;42:617–625. doi: 10.1016/j.molimm.2004.09.011. [DOI] [PubMed] [Google Scholar]
- Zeumer L, Sang A, Niu H, Morel L. Murine lupus susceptibility locus Sle2 activates DNA-reactive B cells through two sub-loci with distinct phenotypes. Genes Immun. 2011;12:199–207. doi: 10.1038/gene.2010.69. [DOI] [PMC free article] [PubMed] [Google Scholar]