Abstract
The pyruvate dehydrogenase complex (PDC) oxidizes pyruvate to acetyl CoA and is critically important in maintaining normal cellular energy homeostasis. Loss-of-function mutations in PDC give rise to congenital lactic acidosis and to progressive cellular energy failure. However, the subsequent biochemical consequences of PDC deficiency that may contribute to the clinical manifestations of the disorder are poorly understood. We postulated that altered flux through PDC would disrupt mitochondrial electron transport, resulting in oxidative stress. Compared to cells from 4 healthy subjects, primary cultures of skin fibroblasts from 9 patients with variable mutations in the gene encoding the alpha subunit (E1α) of pyruvate dehydrogenase (PDA1) ) demonstrated reduced growth and viability. Superoxide (O2·− from the Qo site of complex III of the electron transport chain accumulated in these cells and was associated with decreased activity of manganese superoxide dismutase. The expression of uncoupling protein 2 was also decreased in patient cells, but there were no significant changes in the expression of cellular markers of protein or DNA oxidative damage. The expression of hypoxia transcription factor 1 alpha (HIF1α) also increased in PDC deficient fibroblasts. We conclude that PDC deficiency is associated with an increase in O2·− accumulation coupled to a decrease in mechanisms responsible for its removal. Increased HIF1α expression may contribute to the increase in glycolytic flux and lactate production in PDC deficiency and, by trans-activating pyruvate dehydrogenase kinase, may further suppress residual PDC activity through phosphorylation of the E1α subunit.
Keywords: human PDC deficiency, mitochondria, oxidative stress, reactive oxygen/nitrogen species
Introduction
The nuclear-encoded pyruvate dehydrogenase multienzyme complex (PDC) catalyzes the rate-limiting step in the mitochondrial oxidation of pyruvate and lactate to acetyl CoA and is thus integral to cellular energetics (Reed 1974). Patients with a deficiency in PDC present with clinically heterogeneous disorders that mostly arise from mutations in the X-linked PDA1 gene, which encodes the E1α enzymatic subunit of PDC (Lissens et al. 2000; Patel et al. 2011). The biochemical consequences of PDC deficiency that occur at the cellular level remain poorly understood. Studies using NMR spectroscopy to examine the fate of U-13C-glucose in primary cultures of skin fibroblasts from PDC deficient patients suggest that, regardless of the underlying mutation, glycolysis and lactate production are increased, glucose carbon is diverted from PDC to pyruvate carboxylase and flux through the tricarboxylic acid (TCA) cycle is reduced (Simpson et al. 2006).
We hypothesized that altered flux through both the PDC-catalyzed step and the TCA cycle in PDC deficiency might alter normal mitochondrial electron transport and predispose cells to oxidative stress. We tested this postulate in skin fibroblasts cultured from healthy and PDC deficient individuals and found evidence that PDC deficiency is associated with increased production of reactive oxygen species (ROS) and other cellular alterations that may contribute to the pathophysiology of the disease.
Materials and Methods
Cell culture conditions
Primary adherent skin fibroblasts cell lines were established after biopsy of four healthy male subjects and nine PDC-deficient patients. All of the patients that participated in this study had a mutation in PDA1 (Table 1). Cell lines were grown in Dulbecco’s Modified Eagle’s medium (DMEM; Lonza Rockland Inc., Conshohocken, PA) containing 4.5g/L glucose and supplemented with 10% fetal bovine serum (FBS; Mediatech, Manassas, VA), 2mM L-glutamine, 100 U/ml penicillin, and 100μg/ml streptomycin. They were maintained at 37°C under humidified conditions (5% CO2/95% air). Rotenone (1μM, Sigma Aldrich, St. Louis, MO) or myxothiazol (20 μM, Sigma Aldrich, St. Louis, MO) was added, when indicated, to the complete medium. Myco Probe (mycoplasma detection kit, R&D Systems, Minneapolis, MN) was used to test for the presence of mycoplasma in all cultured cell lines prior to experimentation. The numbers of passages for patient and control cell lines in any given experiment were similar.
Table 1.
Characteristics of PDC deficient cells.
| Cell line number | Patient gender | Residual PDC activity (% of control) | PDA1 mutation
|
||
|---|---|---|---|---|---|
| Location | Mutation | Type | |||
| 1 | F | 38 | Exon 7 | 642 G>T | Missense |
| 2 | F | 38 | Exon 7 | 642 G>T | Missense |
| 3 | F | 13 | Intron7 | 759GGCCA | Deletion |
| Intron8 | 831G>A | Invariant splicing site | |||
| 4 | F | 38 | Exon 10 | 904 C>T | Missense |
| 5 | F | 44 | Exon 11 | 1063–1068 | Deletion |
| 6 | M | 25 | Exon 11 | 1159AAGT | Duplication |
| 7 | M | 25 | Exon 11 | 1159AAGT | Duplication |
| 8 | M | 70 | Exon 7 | 748 C>A | Missense |
| 9 | M | 45 | Exon 7 | 787 C>G | Missense |
Lines 1 and 2 are from identical twins. Enzyme-specific activity ranged from – nmols 14CO2/min/mg protein to – nmols 14CO2/min/mg protein.
Cell growth and viability
Fibroblasts were cultured as described above and were seeded in a 12-well plate format at a density of approximately 3 × 10⁴ cells/ml. Cells were trypsinized and counted in triplicate using a hemacytometer and phase contrast microscopy. Cell growth was determined by cell count, not protein content. Viability was determined by Trypan Blue exclusion.
Superoxide (O2·−)
We used MitoSOX Red (Invitrogen, Carlsbad, CA) to examine changes in mitochondrial free radical production. Cells were trypsinized, washed twice with PBS, incubated with 5 μM of the reagent for 20 minutes at 37°C followed by two wash procedures and then analyzed by Accuri C6 Flow Cytometer. We set the flow cytometer to collect data from 30,000 cells per sample. Flow cytometry data were collected from 30,000 cells per sample. Data are presented as a percentage of the fluorescent intensity of control cells (100%).
Reactive oxygen species
Cytosolic accumulation of reactive (oxygen and/or nitrogen) species was determined using CM-H2DCFDA [5-(and-6-)-chloromethyl-2′7′-dichloro-dihydro-fluorescein diacetate], a derivative of dichlorofluorescin-diacetate ester (DCF-DA) (Molecular Probes, Eugene, OR). Adherent cells were trypsinized, washed with phosphate buffered saline (PBS), and incubated with CM-H2DCFDA (5 μM) for 20 minutes at 37°C. After incubation cells were washed twice in PBS and then analyzed using an Accuri C6 Flow Cytometer (Accuri Cytometers Inc., Ann Arbor, MI). Data are presented as a percentage of the fluorescent intensities of control cells (100%).
Mitochondrial membrane permeability
We used JC-1 (5,5′,6,6′-tetrachloro-1,1′,3,3′-tetraethyl- benzamidazolocarbocyanin iodide; Invitrogen) to determine changes in mitochondrial membrane potential. Adherent fibroblasts were cultivated in complete medium supplemented with 0.3 μg/ml JC-1 for 50 minutes at 37°C. Cells were trypsinized, washed twice with PBS and then analyzed using an Accuri C6 Flow Cytometer. Flow cytometry data were collected from 30,000 cells per sample. Data are presented as a ratio of red to green fluorescence intensities.
Manganese superoxide dismutase (MnSOD)
MnSOD activity was measured in cell lysates using a superoxide dismutase detection kit (Cell Technology, Inc., Mountain View, CA). Whole cell lysates were diluted to 1 mg/mL in PBS and 20 μl of lysate was used for each replicate. To inhibit the CuZn-SOD activity, 2mM potassium cyanide (KCN) was added to lysates prior to beginning the assay. Controls, standards, and samples were plated in triplicate according to manufacturer’s instructions. Following a 20-minute incubation at 37°C, the absorbance at 450nm was read using a VERSAmax microplate reader (Molecular Devices, Sunnyvale, CA).
Western blotting
Cells were collected in 1× cell lysis buffer (Cell Signaling, Danvers, MA) containing 20mM Tris-HCl (pH 7.5), 150mM NaCl, 1mM Na2EDTA, 1mM EGTA, 1% Triton, 2.5mM sodium pyrophosphate, 1mM β-glycerophosphate, 1mM Na3VO4, and 1μg/ml leupeptin and supplemented with 1mM PMSF just before use. Protein concentrations were determined using the DC-Protein assay (Bio-Rad, Hercules, CA). Lysates were separated using PAGEr Gold Precast polyacrylamide gels (Lonza, Basel, Switzerland) and transferred to polyvinylidene fluoride (PVDF) membranes (Amersham Hybond-P, GE Healthcare). Membranes were blocked for 1 hr at room temperature in 0.1% TBS/Tween containing 5% blotting grade blocker (Bio-Rad, Hercules, CA) and incubated overnight at 4°C with primary antibodies. The following primary antibodies were used: anti-SOD2 (ab16956; Abcam); anti-UCP2 (AB3226; Chemicon); and anti HIF-1α (610958; BD Transduction Laboratories). After washing and incubating with appropriate secondary antibodies, proteins were detected using chemiluminescence (Pierce SuperSignal, Rockford, IL).
Nitrotyrosine
Detection of nitrotryosine-containing proteins was performed by ELISA (Cell BioLabs, Inc., San Diego, CA). The quantity of 3-nitrotyrosine present in cell lysates was determined by comparing their absorbance with that of a nitrated BSA standard curve. Lysates were added in triplicate to a pre-coated EIA plate and incubated at room temperature for 10 minutes. An anti-nitrotyrosine antibody was then added, followed by washing and incubating with a horseradish-peroxidase conjugated secondary antibody. Absorbance at 450nm was read using a VERSAmax microplate reader (Molecular Devices, Sunnyvale, CA) after the addition of substrate and stop solutions.
Protein carbonyls
Protein carbonyls were measured by Western blotting using an OxyBlot Protein Oxidation Detection kit (Chemicon, Temecula, CA).
Oxidative DNA damage
The amount of 8-hydroxy deoxyguanosine (8-OHdG) present in DNA samples from controls and PDC-deficient cells was measured by ELISA (Cell BioLabs, Inc., San Diego, CA). DNA was isolated from cells using the QIAamp DNA mini kit (Qiagen, Valencia, CA) and following the spin protocol for cultured cells.
Statistical analysis
Data are presented as means ± standard error. Statistical significance was determined using GraphPad Prism software (La Jolla, CA) and an unpaired, two-tailed Student’s t-test with a p-value of < 0.05 was considered significant.
Results
Cell growth and viability
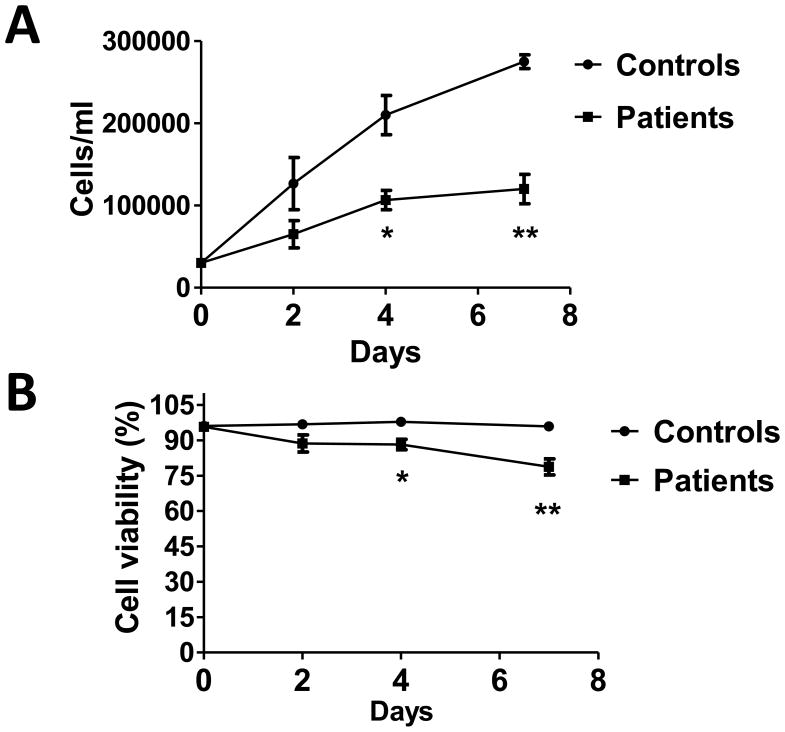
The 9 PDC-deficient skin fibroblast cell lines established from 5 female and 4 male patients (Table 1) as well as the 4 control cell lines from healthy male subjects were analyzed for their growth (Fig. 1A) and viability (Fig. 1B) over a 7 day period of culture. Both growth and viability were significantly decreased in the patient cell lines compared to controls.
Fig. 1.
Cell growth (A) and viability (B) are decreased in PDC deficient fibroblasts. Numbers and the percent of viable cells (mean±SEM) from 4 independent experiments are shown. *P<0.005, **P<0.0005.
ROS accumulation
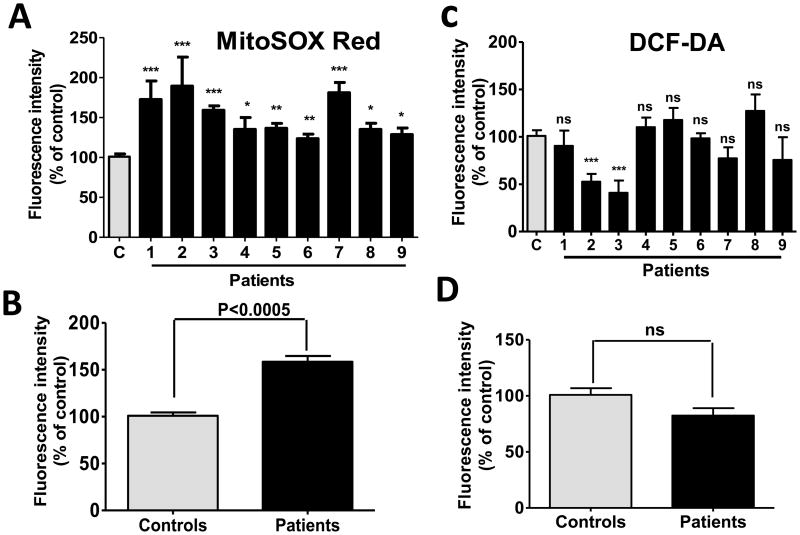
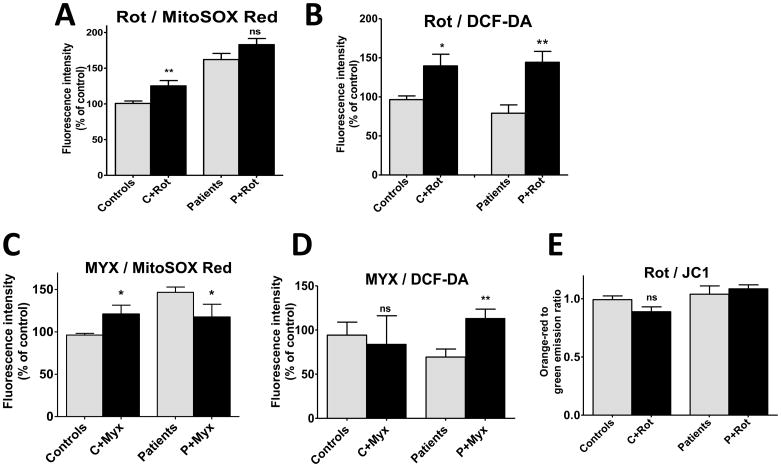
Intramitochondrial O2·− accumulation, as determined using MitoSOX Red, was significantly increased in all PDC deficient cell lines, compared to control cells (Fig. 2A and B). In contrast, intracellular accumulation of reactive (oxygen and/or nitrogen) species measured by DCF was not increased in patient cells (Fig. 2C and D). A noteworthy difference was observed in DCF fluorescence in the cells from the identical female twins (patients 1 and 2 of Table 1). This discrepancy may relate to the fact that, despite their common genetic background and identical residual enzyme activity, these patients have always exhibited strikingly different clinical (Berendzen et al. 2006) and biochemical (Simpson et al. 2006) phenotypes, a phenomenon presumably due to variable X-inactivation and differential expression of the mutant PDHA1 allele in the girls and/or to their apparent difference in cytosolic ROS production (patients 1 and 2 in Fig. 2C). Treatment of cells with rotenone increased the production of O2·− in control cells and increased intracellular ROS in both healthy and PDC deficient cells (Fig. 3A and B). In contrast, addition of myxothiazol increased mitochondrial O2·− accumulation in control cells, but had the opposite effect in PDC deficient cells (Fig. 3C). Cytosolic ROS was significantly higher in PDC deficient but not control fibroblasts treated by myxothiazol (Fig. 3D). The magnitude of mitochondrial membrane polarization was similar in healthy and patient cells and was unaffected by exposure to rotenone (Fig. 3E).
Fig. 2.
Intramitochondrial O2·−, but not intracellular ROS, is increased in PDC deficiency. Results are means±SEM expressed as a percent of control cells and represent results of 4–9 independent experiments. 2A and 2B: mitochondrial O2·− accumulation. 2C and 2D: intracellular ROS accumulation. *P<0.05, **P<0.005, ***P<0.0005.
Fig. 3.
Inhibition of electron transport chain complexes modifies O2·− and ROS accumulation, but not mitochondrial membrane potential, in PDC deficiency. Results are means±SEM expressed as a percent of control cells and represent results of 3 independent experiments on each of 3 control and 5 patient cell lines. 3A and 3B: complex I inhibition by rotenone (1 μM for 24 hrs). 3C and 3D: complex III inhibition by myxothiazol (20 μM for 24 hrs). *P<0.05, **P<0.005.
Oxidative stress
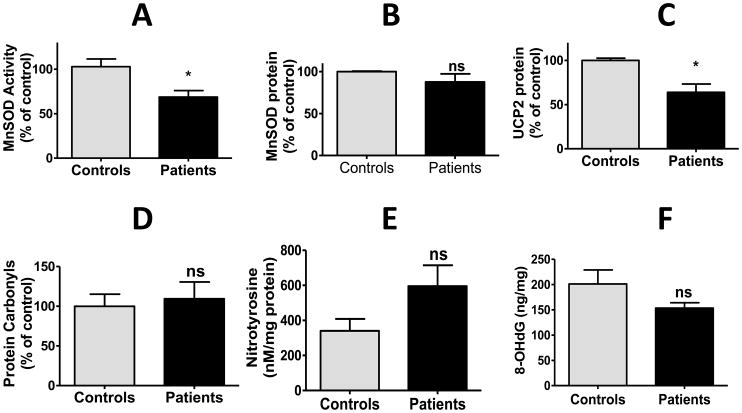
We sought evidence that the increased accumulation of O2·− by mitochondria of PDH deficient cells was associated with biological markers of oxidative stress. MnSOD plays a major role in scavenging mitochondrial ROS by facilitating the dismutation of O2·− to the less reactive hydrogen peroxide. MnSOD activity was decreased in patient cells, although protein expression of the enzyme was similar in both healthy and PDC deficient cells (Fig. 4A and B). In addition, the expression of uncoupling protein-2 (UCP-2), a protein known to modulate mitochondrial ROS levels, was also decreased in PDC deficient cells (Fig. 4C). However, PDC deficiency was not associated with evidence of oxidative damage to cellular proteins, as measured by the amount of protein carboxylation (Fig. 4D) or tyrosine nitrosylation (Fig. 4E) or to nuclear DNA, as reflected by the level of 8-hydroxy deoxyguanosine (8-OHdG) (Fig. 4F).
Fig. 4.
Detoxifying and oxidative stress markers in PDC deficiency. Results are means±SEM expressed as a percent of control cells and represent results of 3 independent experiments on each of 3 control and 9 patient cell lines. Details regarding measurement of MnSOD specific activity and the expression of various proteins by Western immunoblotting are described in the Methods. *P<0.05
Hypoxia inducible factor 1α (HIF1α)
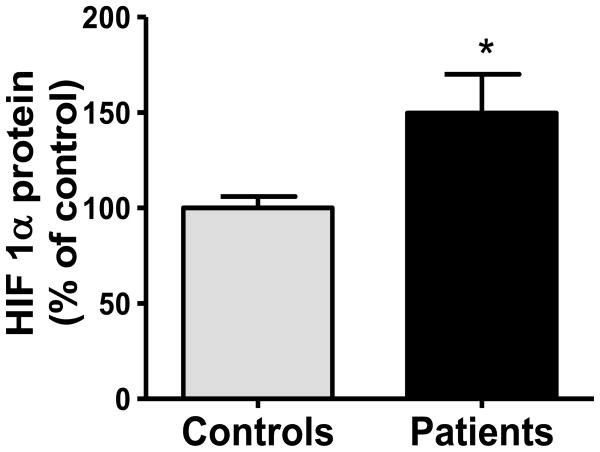
Several metabolic properties of PDC deficient fibroblasts, such as increased glycolysis, lactate accumulation and diminished oxidative phosphorylation are reminiscent of hypoxic and neoplastic cells (Archer et al. 2008). We postulated that these biochemical perturbations in PDC deficiency might be mediated, at least in part, by enhanced expression of HIF1α, a major regulator of intermediary metabolism (Semenza 2010), as a potential survival mechanism to ensure adequate ATP production from glycolysis. We found that the expression of HIF1α was increased approximately 1.5-fold in PDC deficient cells (Fig. 5).
Fig. 5.
HIF1α expression is increased in PDC deficiency. Results are means±SEM expressed as a percent of control cells and represent results of 3 independent experiments on each of 3 control and 9 patient cell lines. See Methods for details. *P<0.05
Discussion
Under physiological conditions, the primary mitochondrial sources of reactive oxygen species (ROS) are considered to be complexes I (NADH: ubiquinone oxidoreductase) and III (cytochrome bc1 complex) (Murphy 2009). Although physiological levels of ROS can play important roles in cell signaling (Hamanaka and Chandel 2010), their abnormal production and/or removal can be deleterious to the host (Hiona et al. 2010).
Our data indicate that an increased concentration of O2·− is present in cells cultured from patients with PDC deficiency caused by different mutations in the E1α subunit of the complex (Fig. 2). The origin of the increased O2·− was the mitochondria (Fig. 2A), with no contribution originating from cytoplasmic sources in most cases (Fig. 2C). PDC deficient cells had elevated mitochondrial free radical accumulation in the matrix, as indicated by the increased fluorescence signal by MitoSOX Red. Therefore, we tested the matrix side ROS producing centers of the electron transport chain, namely, complex I and the Qo site of complex III (Fig. 3). To determine the site of the elevated ROS production we used rotenone and myxathiozol, which inhibit complexes I and III, respectively (Murphy 2009). Both compounds were used in the context of MitoSOX Red. Incubation of PDC deficient fibrobalsts with rotenone did not change ROS production by mitochondria. However, when the PDC deficient cells were exposed to myxothiazol, there was a significant reduction in MitoSOX Red fluorescence. These results implicate the Qo site of complex III as being responsible for the elevated mitochondrial O2·− produced by PDC deficient cells.
An increase in O2·− accumulation in PDC deficiency may appear counterintuitive, particularly given that diminished flux through the PDC and TCA cycle (Simpson et al. 2006) should decrease electron flow through the respiratory chain. However, the abnormal accumulation of a metabolite reflects the balance between its formation and elimination. Our data reveal that PDC deficiency is associated with a significant decrease in the activity of MnSOD, the principal enzyme responsible for mitochondrial O2·− removal. The decrease in MnSOD activity, but not in expression (Fig. 5A and 5B), in patient cells was unexpected because antioxidant enzymes are generally believed to be upregulated in response to an increase in oxidative stress (Ji 2007). However, MnSOD can also be inactivated by ROS (Miguel et al. 2009). We also found that UCP2 expression was decreased in PDC deficient cells (Fig. 5C) and there is strong evidence that UCP2 protects against oxidant damage by scavenging O2·− (Brand and Esteves 2005). Thus, we conclude that the principal mechanism accounting for accumulation of O2·− in PDC deficient fibroblasts is its decreased removal, through reduced dismutation to hydrogen peroxide and through deficiencies in one or more other antioxidant defense systems. Consistent with such a complex etiology for O2·− accumulation, we found no significant correlation between O2·− levels and either MnSOD activity or UCP2 expression, nor with residual PDC activity. Although ATP derived from oxidative metabolism is reduced in PDC deficient fibroblasts, total cellular energy charge is maintained by a compensatory increase in glycolysis (Simpson et al. 2006). Nevertheless, we postulate that, once a threshold level of PDC deficiency is reached, diminished mitochondrial energy production may impair mitochondrial antioxidant defenses, such as MnSOD and UCP2, resulting in O2·− accumulation.
The combined presence of increased O2·−, the suppression of putative antioxidant defense mechanisms and the reduced capacity to generate ATP in the mitochondria of PDC deficient cells may also be causally related to the decrease in growth rate and viability observed in PDC deficient fibroblasts, compared to healthy cells. Autophagic cell death is known to be regulated by ROS. Superoxide has been implicated as the major reactive species accounting for this process, which can be blocked by overexpression of MnSOD (Chen et al. 2009). Oxidative stress occurs when mitochondrial ROS production exceeds the capacity of the cell’s antioxidant defense systems; in our study, the magnitude of accumulation of O2·− apparently was insufficient to provoke oxidative damage to specific cellular components, as reflected by the expression of protein carbonyls, nitrotyrosine or 8-OHdG, respectively (Fig. 5D–5F).
ROS production is sharply regulated by the amplitude of transmembrane potential (Starkov and Fiskum 2003). We speculate that mitochondrial metabolite shuttles (such as the malate/aspartate shuttle) could spread redox imbalance into the cytoplasmic NAD(P) pool. This process might be energy-consuming and require a high membrane potential (as we observed in patient cells) provided by ATP hydrolysis. Further studies are required to test this hypothesis.
It is particularly interesting that PDC deficient fibroblasts exhibit a significant increase in the expression of the transcription factor HIF1α (Fig. 6), which is a new and potentially important aspect of the pathobiology of this disease. ROS levels are increased in hypoxia and have been demonstrated to play a role in stabilizing HIF1α (Semenza 2010). HIF1α is a regulator of cellular intermediary metabolism that transactivates genes encoding glucose transporters, glycolytic enzymes and pyruvate dehydrogenase kinase (PDK) (Archer et al. 2008). HIF1α-induced activation of PDK thus provides an additional potential mechanism accounting for suppression of PDC activity in patients with congenital deficiency of the complex. Furthermore, up-regulation of PDK would be expected to shift cells from oxidative to glycolytic metabolism and lactate accumulation. The mechanism by which HIF1α expression is increased in PDC deficient cells is unknown. HIF1α undergoes stabilization upon its translocation to the cell nucleus and is degraded by hydroxylation that is catalyzed by cytoplasmic prolyl hydroxylases (Semenza 2010). However, glycolytic metabolites, such as pyruvate, are also reported to stabilize HIF1α by inhibiting prolyl hydroxylase enzyme activity (Lu et al. 2005) and their accumulation could contribute to HIF1α overexpression in congenital PDC deficiency, leading to a positive feedback loop. The potential relevance of this biochemical schema to the clinical complications of PDC deficiency is supported by the recent observation that patients with Chuvash polycythemia, an autosomal recessive disorder in which HIF1α degradation is impaired, demonstrate exercise-induced lactic acidosis, increased muscle levels of transcripts for glycolytic enzymes and PDK and diminished exercise tolerance (Formenti et al. 2010), the latter being a common clinical finding in PDC deficient subjects.
A caveat in interpreting the clinical significance of our results is that skin fibroblasts are not normally highly oxidative cells and may not be representative of tissues, such as muscle and brain, that are most vulnerable to the inhibition of oxidative phosphorylation caused by PDC deficiency. However, fibroblasts are a common cell type used in diagnosing PDC deficiency and exhibit changes in fuel metabolism consistent with genetically-induced inhibition of the complex (Simpson et al. 2006). Moreover, all the patient cell lines we studied demonstrated qualitatively similar biochemical perturbations, regardless of gender or the particular mutation. Thus, it seems reasonable to conclude that the biochemical differences we observed between primary cultures of normal and patient fibroblasts may reflect fundamental characteristics of PDC deficient cells in general.
In summary, primary cultures of skin fibroblasts from patients with PDC deficiency due to loss-of-function mutations in the PDA1 gene exhibit diminished cell growth and viability and accumulation of mitochondrial O2·−, compared to healthy fibroblasts. These pathological changes are not associated with evidence of damage to specific cellular components, but are associated with overexpression of HIF1α. This latter finding has implications regarding the fundamental regulation of intermediary metabolism in PDC deficiency and, if confirmed by further studies, could represent a new therapeutic target for this devastating disease.
Acknowledgments
We thank Dr. Brian Robinson (University of Toronto) for providing some of the patient cell lines and Ms. Kathryn St. Croix for editorial assistance. This work was supported in part by U54RR025208-01 (University of Florida Clinical and Translational Science Award).
Footnotes
Publisher's Disclaimer: This is a PDF file of an unedited manuscript that has been accepted for publication. As a service to our customers we are providing this early version of the manuscript. The manuscript will undergo copyediting, typesetting, and review of the resulting proof before it is published in its final citable form. Please note that during the production process errors may be discovered which could affect the content, and all legal disclaimers that apply to the journal pertain.
References
- 1.Andrews ZB, Horvath TL. Uncoupling protein-2 regulates lifespan in mice. Am J Physiol Endocrinol Metab. 2009;296:E621–7. doi: 10.1152/ajpendo.90903.2008. [DOI] [PMC free article] [PubMed] [Google Scholar]
- 2.Archer SL, Gomberg-Maitland M, Maitland ML, Rich S, et al. Mitochondrial metabolism, redox signaling, and fusion: a mitochondria-ROS-HIF-1alpha-Kv1.5 O2-sensing pathway at the intersection of pulmonary hypertension and cancer. Am J Physiol Heart Circ Physiol. 2008;294:H570–8. doi: 10.1152/ajpheart.01324.2007. [DOI] [PubMed] [Google Scholar]
- 3.Brand MD. The sites and topology of mitochondrial superoxide production. Exp Gerontol. 2010;45:466–472. doi: 10.1016/j.exger.2010.01.003. [DOI] [PMC free article] [PubMed] [Google Scholar]
- 4.Brand MD, Esteves TC. Physiological functions of the mitochondrial uncoupling proteins UCP2 and UCP3. Cell Metab. 2005;2:85–93. doi: 10.1016/j.cmet.2005.06.002. [DOI] [PubMed] [Google Scholar]
- 5.Cannon B, Shabalina IG, Kramarova TV, Petrovic N, et al. Uncoupling proteins: a role in protection against reactive oxygen species--or not? Biochim Biophys Acta. 2006;1757:449–58. doi: 10.1016/j.bbabio.2006.05.016. [DOI] [PubMed] [Google Scholar]
- 6.Chen Y, Azad MB, Gibson SB. Superoxide is the major reactive oxygen species regulating autophagy. Cell Death Differ. 2009;16:1040–52. doi: 10.1038/cdd.2009.49. [DOI] [PubMed] [Google Scholar]
- 7.Crane D, Haussinger D, Graf P, Sies H. Decreased flux through pyruvate dehydrogenase by thiol oxidation during t-butyl hydroperoxide metabolism in perfused rat liver. Physiol Chem. 1983;364:S977–87. doi: 10.1515/bchm2.1983.364.2.977. [DOI] [PubMed] [Google Scholar]
- 8.DeBrosse SD, Okajima K, Schotzer CL, Frohnapfel MB, Kerr DS. Abstract. United Mitochondrial Disease Foundation; Chicago, IL: Jun 14–19, 2011. Spectrum of clinical outcomes in pyruvate dehydrogenase deficiency. [Google Scholar]
- 9.Duval C, Nègre-Salvayre A, Dogilo A, Salvayre R, et al. Increased reactive oxygen species production with antisense oligonucleotides directed against uncoupling protein 2 in murine endothelial cells. Biochem Cell Biol. 2002;80(6):757–64. doi: 10.1139/o02-158. [DOI] [PubMed] [Google Scholar]
- 10.Echtay KS. Mitochondrial uncoupling proteins – what is their physiological role? Free Radic Biol Med. 2007;43:1351–1371. doi: 10.1016/j.freeradbiomed.2007.08.011. [DOI] [PubMed] [Google Scholar]
- 11.Falk RE, Cederbaum SD, Blass JP, Gibson GE, et al. Ketogenic diet in the management of pyruvate dehydrogenase deficiency. Pediatrics. 1976;58:713–21. [PubMed] [Google Scholar]
- 12.Formenti F, Constantin-Teodosiu D, Emmanuel Y, Cheeseman J, et al. Regulation of human metabolism by hypoxia-inducible factor. Proc Natl Acad Sci U S A. 2010;107(28):12722–7. doi: 10.1073/pnas.1002339107. [DOI] [PMC free article] [PubMed] [Google Scholar]
- 13.Hamanaka RB, Chandel NS. Mitochondrial reactive oxygen species regulate cellular signaling and dictate biological outcomes. Trend Biochem Sci. 2010;35:505–513. doi: 10.1016/j.tibs.2010.04.002. [DOI] [PMC free article] [PubMed] [Google Scholar]
- 14.Hiona A, Sanz A, Kujoth GC, Pamplona R, Seo AY, Hofer T, et al. Mitochondrial DNA mutations induce mitochondrial dysfunction, apoptosis and sarcopenia in skeletal muscle of mitochondrial DNA mutator mice. PLoS One. 2010;5(7):e11468. doi: 10.1371/journal.pone.0011468. [DOI] [PMC free article] [PubMed] [Google Scholar]
- 15.Ji LL. Antioxidant signaling in skeletal muscle: a brief review. Exp Gerontol. 2007;42(7):582–93. doi: 10.1016/j.exger.2007.03.002. [DOI] [PubMed] [Google Scholar]
- 16.Kerr DS. Treatment of congenital lactic acidosis: a review. Int Pediatr. 1995;10:75–81. [Google Scholar]
- 17.Lissens W, De Meirleir L, Seneca S, Liebaers I, et al. Mutations in the X-linked pyruvate dehydrogenase (E1) alpha subunit gene (PDHA1) in patients with a pyruvate dehydrogenase complex deficiency. Hum Mutat. 2000;15(3):209–19. doi: 10.1002/(SICI)1098-1004(200003)15:3<209::AID-HUMU1>3.0.CO;2-K. [DOI] [PubMed] [Google Scholar]
- 18.Lu H, Dalgard CL, Mohyeldin A, McFate T, et al. Reversible inactivation of HIF-1 prolyl hydroxylases allows cell metabolism to control basal HIF-1. J Biol Chem. 2005;280:41928–39. doi: 10.1074/jbc.M508718200. [DOI] [PubMed] [Google Scholar]
- 19.MacMillan-Crow LA, Cruthirds DL, Ahki KM, Sanders PW, et al. Mitochondrial tyrosine nitration precedes chronic allograft nephropathy. Free Radic Biol Med. 2001;31(12):1603–8. doi: 10.1016/s0891-5849(01)00750-x. [DOI] [PubMed] [Google Scholar]
- 20.Miguel F, Augusto AC, Gurgueira SA. Effect of acute vs chronic H2O2-induced oxidative stress on antioxidant enzyme activities. Free Radic Res. 2009;43(4):340–7. doi: 10.1080/10715760902751894. [DOI] [PubMed] [Google Scholar]
- 21.Murphy MP. How mitochondria produce reactive oxygen species. Biochem J. 2009;417(1):1–13. doi: 10.1042/BJ20081386. [DOI] [PMC free article] [PubMed] [Google Scholar]
- 22.Patel KP, Subramony SH, Shuster J, Stacpoole PW. Abstract. United Mitochondrial Disease Foundation; Chicago, IL: Jun 14–19, 2011. The spectrum of pyruvate dehydrogenase complex deficiency: clinical, biochemical and genetic features in 366 patients. [Google Scholar]
- 23.Pi J, Bai Y, Daniel KW, Liu D, Lyght O, et al. Persistent oxidative stress due to absence of uncoupling protein 2 associated with impaired pancreatic beta-cell function. Endocrinology. 2009;150:3040–8. doi: 10.1210/en.2008-1642. [DOI] [PMC free article] [PubMed] [Google Scholar]
- 24.Reed LJ. Multienzyme complexes. Acc Chem Res. 1974;7:40–46. [Google Scholar]
- 25.Ridout CK, Brown RM, Walter JH, Brown GK. Somatic mosaicism for a PDHA1 mutation in a female with pyruvate dehydrogenase deficiency. Hum Genet. 2008;124:187–93. doi: 10.1007/s00439-008-0538-0. [DOI] [PubMed] [Google Scholar]
- 26.Robinson BH. Lactic academia (disorders of pyruvate carboxylase, pyruvate dehydrogenase) In: Scriver CR, Beaudet AL, Sly WS, Valle D, editors. The metabolic and molecular bases of inherited disease. 7. McGraw-Hill; New York: 2001. pp. 1479–1499. [Google Scholar]
- 27.Semenza GL. Hypoxia-inducible factor 1: Regulator of mitochondrial metabolism and mediator of ischemic preconditioning. Biochim Biophys Acta. 2010 doi: 10.1016/j.bbamcr.2010.08.006. In press. [DOI] [PMC free article] [PubMed] [Google Scholar]
- 28.Sheline CT, Wei L. Free radical-mediated neurotoxicity may be caused by inhibition of mitochondrial dehydrogenases in vitro and in vivo. Neurosci. 2006;140:235–246. doi: 10.1016/j.neuroscience.2006.02.019. [DOI] [PubMed] [Google Scholar]
- 29.Simpson NE, Han Z, Berendzen KM, Sweeney CA, Oca-Cossio JA, Constantinidis I. Magnetic resonance spectroscopic investigation of mitochondrial fuel metabolism and energetics in cultured human fibroblasts: effects of pyruvate dehydrogenase complex deficiency and dichloroacetate. Mol Genet Metab. 2006;89(1–2):97–105. doi: 10.1016/j.ymgme.2006.04.015. [DOI] [PubMed] [Google Scholar]
- 30.Starkov AA, Fiskum G. Regulation of brain mitochondrial H2O2 production by membrane potential and NAD(P)H redox state. J Neurochem. 2003;86:1101–1107. doi: 10.1046/j.1471-4159.2003.01908.x. [DOI] [PubMed] [Google Scholar]
- 31.Starkov AA, Fiskum G, Chinopoulos C, Lorenzo BJ, et al. Mitochondrial alpha-ketoglutarate dehydrogenase complex generates reactive oxygen species. J Neurosci. 2004;24(36):7779–7788. doi: 10.1523/JNEUROSCI.1899-04.2004. [DOI] [PMC free article] [PubMed] [Google Scholar]
- 32.Tabatabaie T, Potts JD, Floyd RA. Reactive oxygen species-mediated inactivation of pyruvate dehydrogenase. Arch Biochem Biophys. 1996;336:290–6. doi: 10.1006/abbi.1996.0560. [DOI] [PubMed] [Google Scholar]


