Summary
Human epidermal growth factor receptor 2 (HER2) belongs to the EGFR family of receptor tyrosine kinases that comprises four members. As opposed to the other family members, HER2 does not require ligand binding for activation. Hence, HER2 molecules can undergo spontaneous dimerization, autophosphorylation and activation of downstream signaling pathways especially under conditions of overexpression, a commonly encountered phenomenon in breast cancer. In this study, we sought to investigate the mechanism by which HER2 musters signaling and transformation potency. We show that HER2 overexpression per se induces a significant increase in basal mitogenic and cell survival signaling, which was augmented by EGF stimulation. Inhibition of the normally expressed EGFR significantly suppressed the ability of overexpressed HER2 to induce enhanced signaling and cell transformation, suggesting that HER2 requires the EGFR and potentially other members to maximize its signaling and transformation potency. The novel observation revealed by prolonged EGF stimulation studies was the biphasic signaling pattern in the presence of HER2 overexpression that suggested the induction of a short-circuited mechanism, permitting sustained signaling. Our results further show that the short-circuited signaling was due to the re-shuttling of internalized receptor molecules to the Rab11-positive recycling endosomes, while suppressing channeling to the LAMP1-positive lysosome-targeting endosomes. Therefore, HER2’s oncogenicity is dependent, not only on its constitutively active nature, but also on its ability to muster collaborative signaling from family members through modulation of ligand-induced receptor regulation.
Keywords: HER2, EGFR, signaling, transformation
1. Introduction
The epidermal growth factor receptor (EGFR) family of receptor tyrosine kinases (RTKs) comprises four members that include EGFR1-4. The human counterparts are called HER1-4, also referred to as ErbB1-4 [1-3]. All members are composed of an extracellular ligand-binding region, a transmembrane region, and a cytoplasmic region containing a Tyr kinase domain (except HER3) and Tyr autophosphorylation sites. Three of the family members, except HER2, are activated by ligand binding (EGF, TGFα, herregulin, amphiregulin and heparin binding EGF) to the extracellular region, while HER2 is a constitutively active protein. Because EGFR1 is commonly known as EGFR and EGFR2 as HER2, we have used these abbreviations throughout this manuscript hereinafter.
X-ray crystallographic structure of the EGFR ectodomain has revealed that each receptor molecule is autoinhibited by intramolecular interaction between domains 2 and 4 in the absence of EGF, but EGF binding induces conformational changes that relieve the dimerization arm, leading to homo- or heterodimerization [4-6]. The On the other hand, no interactions between domains 2 and 4 were observed in the HER2 ectodomain [7]. As a result, HER2 can readily heterodimerize with ligand-activated family members or homodimerize with itself especially under conditions of overexpression, a commonly encountered genetic abnormality particularly in breast cancer [8-11].
Receptor dimerization leads to activation of the kinase domain and autophosphorylation of tyrosine residues in the C-terminal region that provide docking sites for Src homology 2 (SH2) or phosphotyrosine binding (PTB) domain-containing signaling molecules [12]. These interactions lead to recruitment of adaptor proteins such as Gab1/2 and Shc that mediate further interactions, translocation of enzymes to substrate micro domains such as PI3K and the Grb2-SOS complex, binding of regulatory proteins such as c-Cbl and RasGAP, and in some instances, induction of enzyme activity such as SHP1 and SHP2 [13-16]. The formation of multiprotein signaling complexes at the level of the receptor culminates in downstream activation of mitogenic and cell survival signaling pathways that lead to cell growth, migration and/or differentiation. On the other hand the interaction of regulatory proteins such as c-Cbl and RasGAP leads to receptor degradation [17-19] and inactivation of GTP-Ras to GDP-Ras, respectively [20-24].
HER2 molecules can undergo spontaneous homodimerization and autoactivation especially under conditions of overexpression for the extracellular domain of HER2 is unconstrained by intramolecular interactions [7]. This property of HER2 can explain its ability to induce cell transformation even under conditions of modest expression, while similar expression of the other family members does not due to tight regulations. Recent reports show that HER2 can also induce EGFR resistance to ligand-induced degradation, but the biological significance of this capability has remained insufficiently explored. It is possible that HER2 may exploit the normally-expressed family members to strengthen its signaling and transformation potency through enhancing their stability. In this report, we have presented evidence that show that the signaling and cell transformation potency of HER2 is dependent on the normally-expressed EGFR and possibly on HER3. We have also shown that the mechanism by which HER2 exploits the contribution of the normally-expressed EGFR is by promoting reprocessing of activated molecules that ultimately lengthens the signaling life.
2. Materials and Methods
2.1 Cells, cell culture and reagents
The MCF10A breast epithelial cell line, and the BT20 and the BT474 breast cancer cell lines were purchased from ATCC. The BT20 and BT474 cells were grown in Dulbecco’s Modified Eagle’s Medium (DMEM) and in RPMI 1640, respectively, both supplemented with 10% fetal calf serum. On the other hand, the MCF10A were grown in DMEM supplemented with 10 μg/ml recombinant human insulin, 20 ng/ml EGF (PeproTech), 0.5 μg/ml hydrocortisone, 100 ng/ml cholera toxin (Sigma) and 5% horse serum, as described previously [25]. All cell lines were maintained at 37°C with 5% CO2. The anti-HER2 (610162) monoclonal antibody was purchased from Pharmagen, the anti-EGFR polyclonal antibody (E1157) and the anti-β-actin (A5441) monoclonal antibodies were from Sigma-Aldrich, while the anti-phospho-ERK1/2 (9101S) and the anti-phospho-Akt (9271S) were from Cell Signaling. The anti-HER3 monoclonal antibody (SC-7390) was purchased from Santa Cruz Biotechnology. Horseradish peroxidase-conjugated secondary antibodies were from Amersham (NA934V and NA931V), and TRITC-labeled EGF (E13345) and the anti-goat secondary antibody (A11079) were from Molecular Probes. The general proteosome inhibitor MG-132 was purchased from Sigma Aldrich.
2.2 Subcloning, retroviral transduction and production of stable cell lines
The subcloning of HER2 into REBNA/IRES/GFP retroviral vector was reported previously [26]. The FuGENE 6 transfection reagent (Roche) was used for transducing retroviral constructs into appropriate packaging cells. The MCF-10A and the BT20 cell lines stably expressing the HER2 protein or the control construct (vector alone) were produced by infection with the respective retroviruses in the presence of 1μg/ml polybrene (Sigma). After incubation in growth medium for approximately 48 hours, cells were treated with 10 μg/ml blasticidine, the selection antibiotic, to remove non-expressing cells. Blasticidine-resistant cell populations were used for the various experiments described in this manuscript.
2.3 Preparation of cell lysates, gel electrophoresis and immunoblotting analysis
All cell lysates were prepared in a buffer containing 20 mM Tris-HCl, pH7.2, 150 mM NaCl, 50 mM NaF, 1 mM EDTA, 10% glycerol, 1% triton-X-100, 1 mM Na orthovanadate and a protease inhibitor cocktail. Lysates were briefly sonicated to breakdown chromosomal DNA that could interfere with protein separation by polyacrylamide gel electrophoresis. After clearing by centrifugation at 12,000 rpm for 10 minutes, the lysates were analyzed as described in the respective experiments. For separation of proteins, samples were mixed with Laemmli sample buffer, denatured by boiling for 10 minutes, and then run on an 8% or 10% denaturing polyacrylamide gel. After transfer onto a nitrocellulose membrane and blocking with 3% bovine serum albumin, the membranes were stained with primary antibodies overnight at 4°C, washed 3 times with TBST (Tris-buffered saline containing 0.1% Tween-20) to remove unbound primary antibody, stained with secondary antibodies for 1 hour at room temperature, washed 3 times with TBST to remove unbound secondary antibody, and finally detected by the chemiluminescence method.
2.4 Production of cells stably expressing anti-EGFR shRNA
The expression of the EGFR protein was suppressed by stable expression of two distinct small hairpin RNA (shRNA) that were previously shown to specifically target the EGFR mRNA [27]. Briefly, short double-stranded DNA oligonucleotides that code for anti-EGFR shRNA were custom-synthesized (Integrated DNA Technologies) and ligated into the BamHI and EcoRI sites of the retroviral vector termed pSIREN-RetroQ-TetP (BD Biosciences, Palo Alto, CA). The targeting oligonucleotide sequences were 5′-GGAGCTGCCCATGAGAAAT-3′ and GGCACGAGTAACAAGCTCATT. The retroviral shRNA constructs were transfected into appropriate packaging cells, and transient supernatants (after 48 hours of incubation) were used to infect the BT20-HER2, the MCF10A-HER2 and the BT474 cells. A non-targeting shRNA (anti-Luc) provided by the company was used as a control. After 48 hours of infection, cells were treated with puromycin to remove non-infected cells. Puromycin-resistant populations were used for the various experiments described in this manuscript.
2.5 Anchorage-independent growth assay
Anchorage-independent growth in soft agar was performed to determine the importance of EGFR in HER2-induced transformation, and also to investigate the synergistic effect of EGFR and HER2 inhibition on cell transformation. These experiments were carried out in 6 cm cell culture plates. Briefly, the bottom of plates was coated with 0.3% agar in the growth medium, equal number of cells from each group were suspended in 3 ml of growth medium and then mixed with melted agar to a final concentration of 0.3% and immediately poured onto the agar overlay. After 5 min of incubation at room temperature, cells were transferred to a 37 °C and 5% CO2 incubator for 10 days. The cells were fed with growth medium containing 0.3% soft agar every three days. Colony formation was visualized under a microscope and phase contrast pictures were taken using an Olympus IX71 microscope equipped with Olympus DP30BW digital camera.
2.6 Immunofluorescence microscopy
Cells were grown on microscopic slide cover slips, serum-starved overnight and then stimulated with EGF for varying time points ranging from 10 minutes to 6 hours. EGF treatment of cells was accomplished as described previously [17, 28, 29]. Briefly, serum-starved cells were stimulated with 10 ng/ml EGF at 4°C for 1 hour, promptly washed two times with room temperature serum free DMEM, replenished with same medium and transferred to 37°C for varying time points. Cover slips were then fixed in 4% paraformaldehyde for 20 minutes, washed 3 times with PBS, permeablized with 0.3% triton-X-100 in PBS for 30 minutes and blocked with 3% bovine serum albumin in PBS for 1 hour. Primary antibody staining was at 4°C overnight. The next day, cover slips were washed 3 times to remove unbound primary antibody, incubated with fluorescent-labeled secondary antibodies for 1 hour at room temperature, further washed 3 times to remove unbound secondary antibody, mounted on microscopic slides and sealed. Immunofluorescence pictures were collected under the 40× objectives of Olympus IX-71 microscope.
3. Results
3.1 HER2 overexpression alone is insufficient to induce enhanced signaling
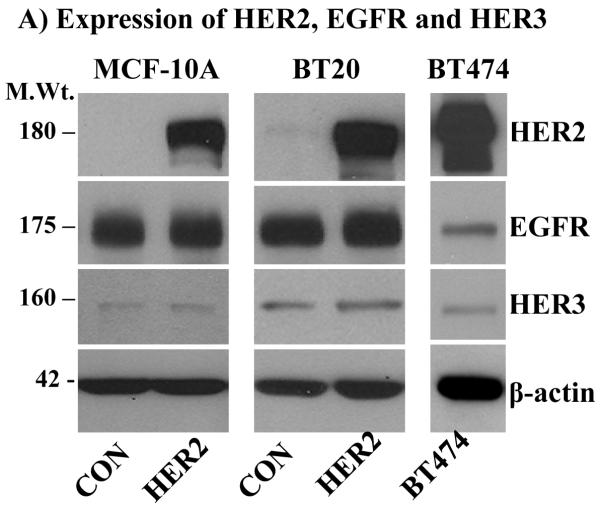
To investigate if HER2 overexpression alone is sufficient to induce enhanced signaling, a cell-based model system was established by overexpressing HER2 in the MCF-10A breast epithelial cell line and the BT20 breast cancer cell line, which express the EGFR, but have very low amount of endogenous HER2 and HER3 (Fig.1A). The BT474 breast cancer cell line that overexpresses HER2 due to gene amplification, but has a low amount of endogenous EGFR [30] also was used in this study. The choice for the MCF-10A and the BT20 cells was to test the importance of EGFR in HER2-induced signaling, while the choice for the BT474 cell line was to examine if overexpressed HER2 alone is sufficient to cause enhanced signaling. The MCF-10A and the BT20 cells expressing vector alone and HER2 were referred to as controls and HER2 cells, respectively.
Figure 1.
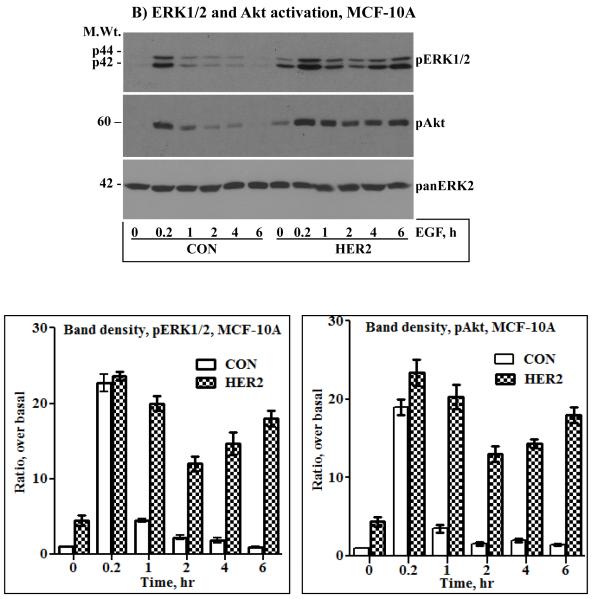
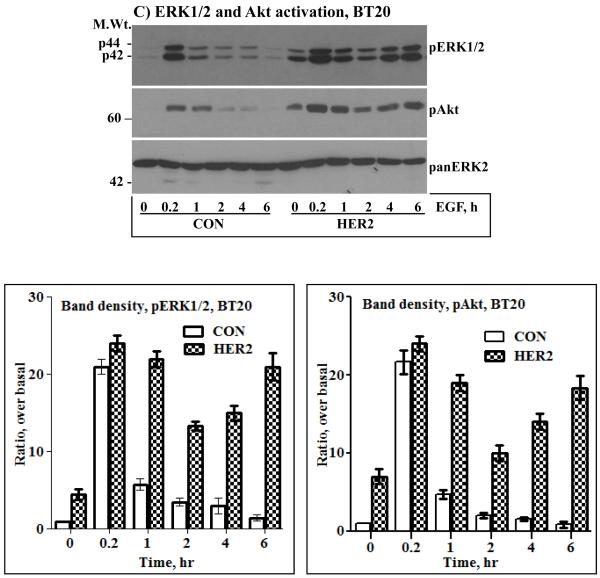
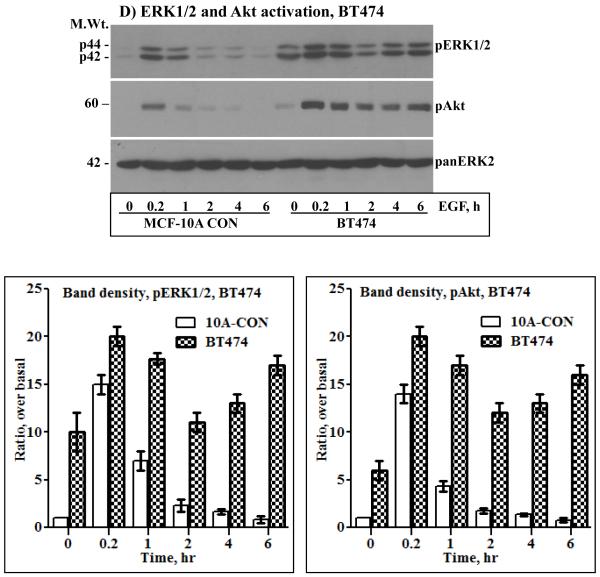
A) Immunoblotting analysis of HER2, EGFR and HER3. HER2 was ectopically expressed in the MCF-10A breast epithelial and in the BT20 breast cancer cell lines by retrovirus transduction. Both cell lines have undetectable amount of endogenous HER2 and a low amount of HER3. On the other hand, the BT474 breast cancer cell lines overexpresses HER2, but has a very low amount of EGFR and HER3. Expression of HER2 in the MCF-10A (B), the BT20 (C) and the BT474 (D) cell lines induces sustained ERK1/2 and Akt activation characterized by a biphasic pattern. Bottom panels in the respective sections are band density measurement of pERK1/2 and pAkt immunoblots. The bar graphs represent mean ± standard deviation from three independent experiments.
Serum starved cells were treated with 10 ng/ml EGF in a time course fashion, ranging from 10 minutes to 6 hours. The need for EGF stimulation was to examine if signaling under condition of HER2 overexpression can be augmented, and the requirement for prolonged treatment was to study its temporal dynamics, a point that has not been addressed in previous studies. When compared to the control cells, the HER2 cells showed increased basal activation of ERK1/2 and Akt. The same was true for the BT474 cells that overexpress HER2 (Figs.1B, C and D). These results were suggestive of the occurrence of constitutive signaling under conditions of HER2 overexpression. EGF stimulation increased the intensity of ERK1/2 and Akt activation in all cells, but was short lived in the controls and prolonged in the HER2 and the BT474 cells. Furthermore, ERK1/2 and Akt activation in the HER2 and the BT474 cells was biphasic as revealed by a gradual decline and a revamp in 4 - 6 hours. Anti-panERK2 immunoblotting showed that the amount of total protein loaded to each lane was comparable. Band density measurements (lower panels of Figs.1B, C and D) confirmed that ERK1/2 and Akt activation was comparable in all cells at the 10 minutes time point, but rapidly declined in the controls to approximately 20% of the initial value within 1 hour. In the HER2 and the BT474 cells, the decline was modest and gradual, reaching approximately 50% within 2 hours, and then revamping back to approximately 85% of the initial value within 6 hours. Therefore, EGF stimulation leads to enhanced and sustained signaling in HER2-overexpressing cells. In addition, these results show that HER2 overexpression induces a revamping signaling pattern in the continuous presence of EGF.
3.2 EGFR is essential for HER2-induced sustained signaling and cell transformation
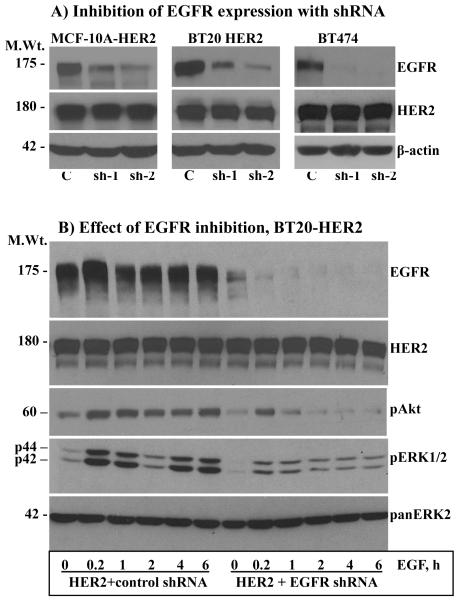
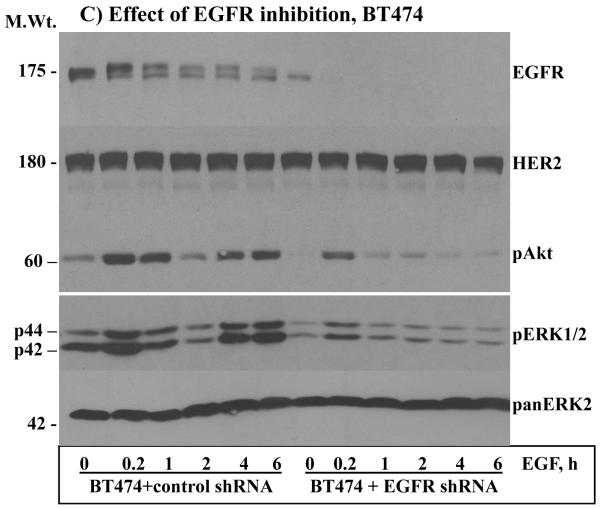
From the above results, it was possible to discern that HER2 overexpression alone can lead to enhanced basal signaling, but EGF stimulation was necessary to increase the intensity even in the BT474 cells that have very low amount of EGFR. The implication is that the normally expressed EGFR plays a critical role under conditions of HER2 overexpression. To further explore these findings, the expression of EGFR was suppressed in the MCF-10A-HER2, the BT20-HER2 and in the MCF-10AHER2 cells (Fig.2A) by constitutive expression of anti-EGFR shRNAs that were previously shown to be specific to EGFR [27]. Because of the similarities, we chose cells expressing shRNA-1 for the ensuing experiments. Inhibition of EGFR expression in the MCF-10A-HER2 (data not shown) BT20-HER2 (Fig.2B) and BT474 (Fig.2C) cells significantly suppressed the intensity, and abolished the revamping pattern of ERK1/2 and Akt activation. Anti-HER2 immunoblotting showed that the level of HER2 was comparable in both the control shRNA and the EGFR shRNA cells, suggesting that the observed results were due to inhibition of EGFR expression. Band density measurements further confirmed that inhibition of EGFR suppresses EGF-induced ERK1/2 and Akt activation in HER2 overexpressing cells (Figs.S1A and S1B). Therefore, even under conditions of HER2 overexpression, the normally-expressed EGFR is required for inducing enhanced and sustained signaling.
Figure 2.
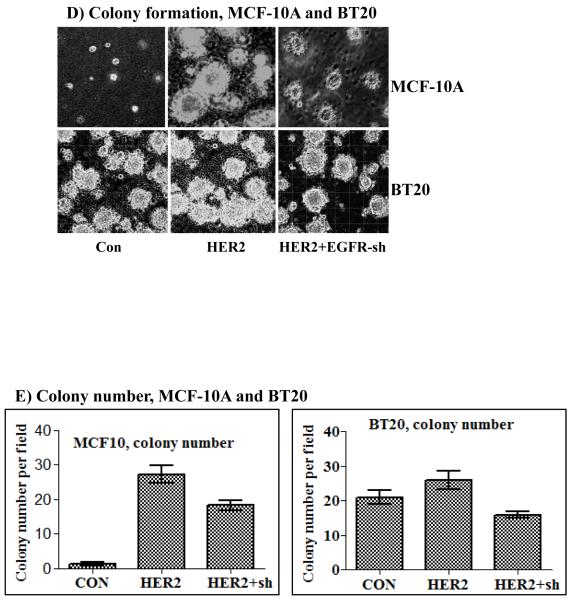
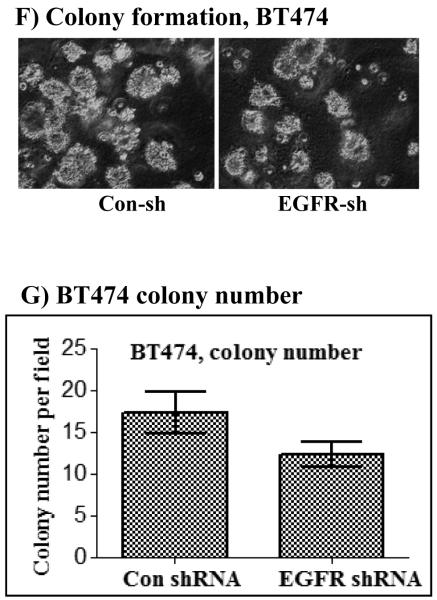
A) Inhibition of EGFR expression by stable expression of anti-EGFR shRNA. Both shRNA-1 (sh-1) and shRNA-2 (sh-2) suppressed EGFR expression efficiently without affecting HER2 expression in all three cell lines. Effect of EGFR inhibition on EGF-induced ERK1/2 and Akt activation in the BT20-HER2 (B) and the BT474 (C) cell lines. D) Effect of EGFR inhibition on colony formation in soft agar by the MCF-10A-HER2 and the BT20-HER2 cell lines. E) Bar graphs showing colony number formed by the control, the HER2 and the HER2 plus EGFR shRNA cells. F) Effect of EGFR inhibition on colony formation by the BT474 cell line. G) Bar graph showing colony number formed by the control and the EGFR shRNA cells derived from the BT474 cell line. All of the bar graphs represent mean ± standard deviation from three independent experiments. Abbreviations; C: control; sh-1: shRNA-1; sh-2: shRNA-2.
The potentiation effect of EGFR in HER2-overexpressing cells suggested that EGFR might also be required for HER2-induced cell transformation. Indeed, the ability of HER2 to induce colony formation in the MCF-10A cells and to enhance the already existent property in the BT20 cells was largely suppressed when the expression of EGFR was inhibited (Figs.2D and E). The results in the BT474 cells were particularly interesting for they show that even the low amount of endogenous EGFR contributes significantly to HER2 overexpression-induced transformation (Fig.2F and G). Together, these results suggest that the normally-expressed EGFR plays critical roles in HER2 overexpression-induced signaling and cell transformation.
3.3 HER2-induced receptor stability correlates with sustained signaling
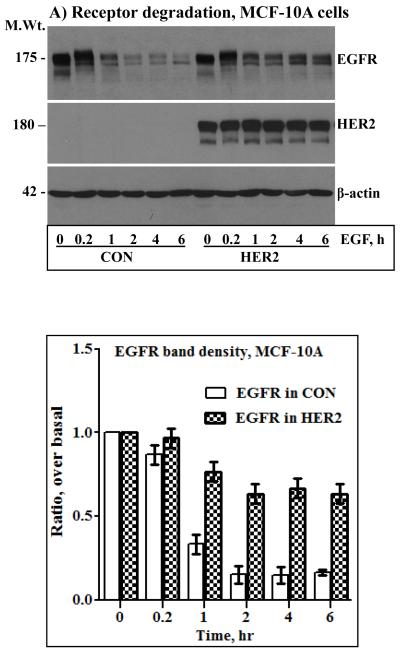
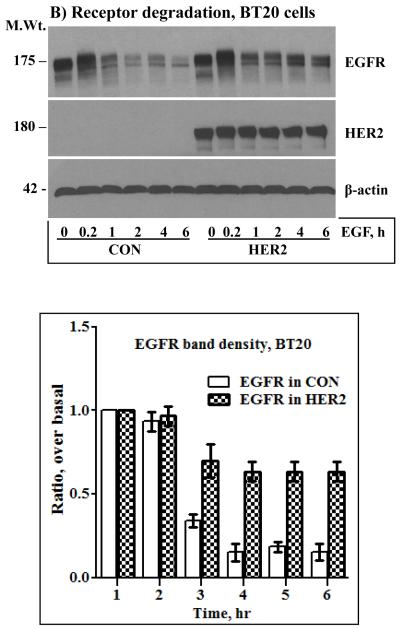
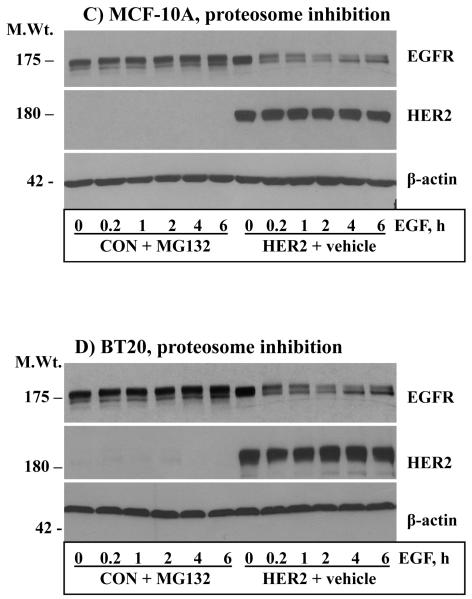
The results shown in Fig.2 indicated that even a low amount of endogenous EGFR contributes significantly to HER2 overexpression-induced signaling and transformation. It was thus logical to investigate how HER2 effectively utilizes the EGFR to potentiate its oncogenic property. Previous studies have shown that co-expression of HER2 with EGFR confers EGFR resistance to ligand-induced degradation [31, 32]. Here, we conducted prolonged time course EGF stimulation studies to explore the dynamics of HER2 and EGFR regulation and to assess the existence of correlative relationships between sustained signaling and receptor stability. Surprisingly, the level of HER2 was unaffected by prolonged EGF stimulation, and EGFR in the HER2 cells was less sensitive to prolonged EGF stimulation. On the other hand, EGFR in the controls was degraded rapidly and remained virtually the same for at least 6 hours (Figs.3A and B, top panels). Band density measurements of the EGFR immunoblots confirmed that EGF treatment induced an approximately 80% reduction in EGFR levels in the control cells within an hour, but the decrease in the HER2 cells was approximately 20% even after 6 hours of EGF treatment (Fig.3A and B, bottom panels). Although synthesis of new EGFR molecules within 6 hours was a possibility, absence of a significant gradual increase in the controls suggested that the observed stability in the HER2 cells was due to protection from degradation. Treatment of the control cells with the general proteosome inhibitor MG-132 completely blocked EGF-induced EGFR degradation, which suggested that HER2 confers EGFR resistance by interfering with proteosomal degradation (Figs.3C and D). Therefore, our experimental conditions recapitulate previous observations and furthers show that HER2 itself is untouchable by EGF stimulation while conferring resistance to EGFR. Thus, one of the mechanisms by which HER2 musters signaling and transformation efficiency is by counteracting ligand-induced receptor degradation, prolonging the signaling life of itself and EGFR.
Figure 3.
Anti-HER2 and anti-EGFR immunoblotting analysis of total cell lysates prepared from the control and the HER2 cells derived from the MCF-10A (A) and the BT20 (B) lines. Cells were stimulated with EGF for the indicated time points. The bar graphs in the lower panels of A and B represent band density measurements of EGFR immunoblots presented as mean ± standard deviation from three independent experiments. Treatment of the MCF-10A (C) and the BT20 (D) cells with the general proteosome inhibitor MG-132 blocks EGF-induced EGFR degradation. Cells were treated with 5 μg/ml MG-132 for 1 hour prior to the start of EGF stimulation. Note that MG-132 completely blocks EGFR degradation while HER2 expression is relatively partial, suggesting that only heterodimerized EGFR with HER2 is protected.
3.4 HER2 is not immune to endocytosis, but promotes receptor reprocessing
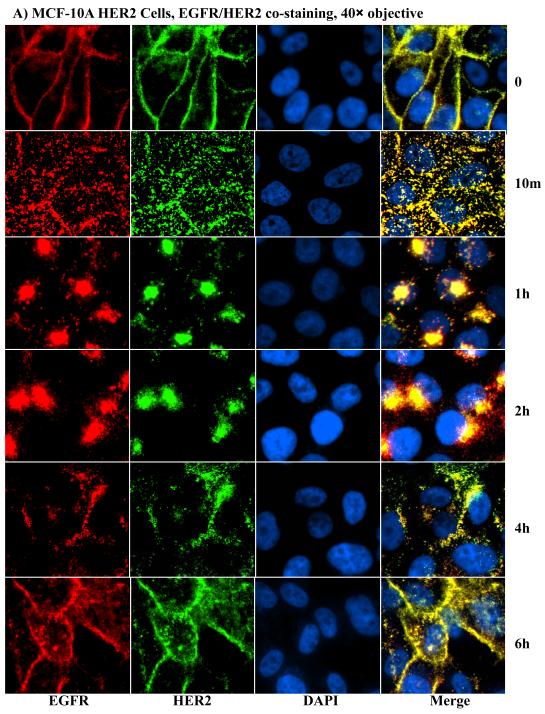
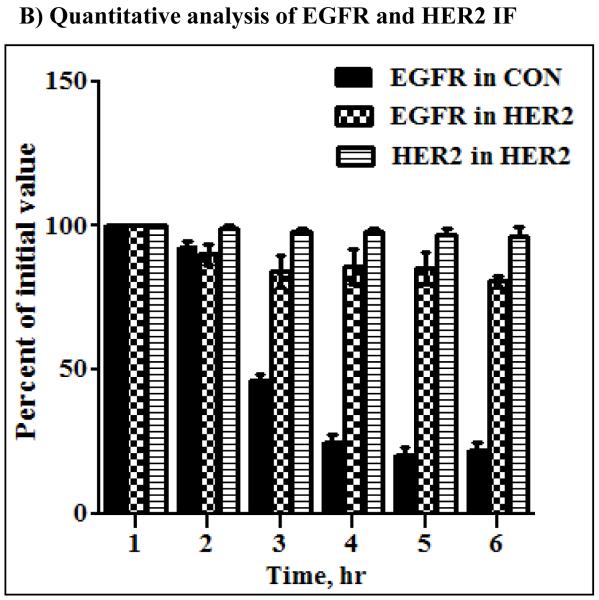
How HER2 confers EGFR resistance to ligand-induced degradation has been contentious. One line of evidence suggests that HER2 blocks ligand-induced internalization [31], while another proposes that HER2 does not block ligand-induced EGFR internalization [32]. We reasoned that prolonged time-course incubations with appropriately spaced time points followed by immunofluorescence microscopy might be needed to delineate between these possibilities. To overcome complications due to continuous ligand binding and internalization, conditions that allow ligand binding without internalization were chosen. Cells were stimulated with EGF at 4°C for 1 hour to allow saturated ligand binding and then incubated at 37°C for varying time points after removal of unbound ligand. EGF can bind to EGFR at 4°C without inducing internalization [17, 28, 29] hence allowing a synchronized receptor processing when cells are transferred to 37°C. Because of the similarity of results, we focused only on the MCF-10A for the ensuing studies. At the zero time point, EGFR in the controls (Fig.S2) and both EGFR and HER2 in the HER2 cells (Fig.4A) were localized at the PM, confirming that EGF treatment at 4°C does not lead to receptor internalization. Remarkably, both EGFR and HER2 in the HER2 cells were efficiently internalized within 10 minutes of incubation at 37°C, demonstrating that HER2 is not immune, and it also does not block EGFR internalization. As expected, EGFR in the control cells was also efficiently internalized within 10 minutes (Fig. S2).
Figure 4.
A) Anti-EGFR and anti-HER2 immunofluorescence microscopy of the HER2 cells derived from the MCF-10A. Notable findings were efficient internalization of both EGFR and HER2, co-localization of EGFR and HER2, and reappearance of both proteins at the plasma membrane within 4 – 6 hours. B) Fluorescence intensity measurements of EGFR in the control and HER2 cells as well as HER2 in the HER2 cells of MCF10A origin. The bar graph represents mean ± standard deviation from three independent experiments.
Although initial endocytic processing was similar, sorting differences between the control and the HER2 cells became apparent after the 10 minutes time point. At the 1 hour time point, EGFR in the controls was sorted to the perinuclear region, and gradually declined to approximately 20% of the initial value as determined by fluorescence intensity (Fig.4B) with no significant change in location (Fig.S2). On the other hand, HER2 and EGFR in the HER2 cells continued to be co-localized and sorted to one side of the nucleus with gradual outward extension, which later reappeared at the plasma membrane (Fig.4A). However, further incubation of the control cells did not lead to a significant reappearance of EGFR at the PM, suggesting that most of the EGFR molecules were degraded in the 6 hours of incubation at 37°C. Fluorescence intensity measurements further confirmed that HER2 is untouchable by proteosomal degradation (Fig.4B). The absence of a significant EGFR fluorescence increase in the control cells in the 6 hours of incubation at 37°C suggests that the synthesis of new EGFR molecules was minimal. Therefore, HER2 is not immune to ligand induced endocytosis, but promotes the recycling of EGFR and itself following ligand stimulation.
3.5 Mechanism for HER2-induced resistance to ligand-induced degradation
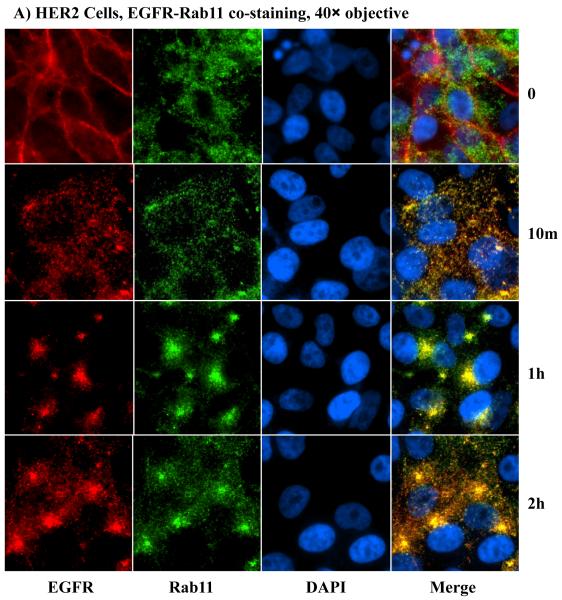
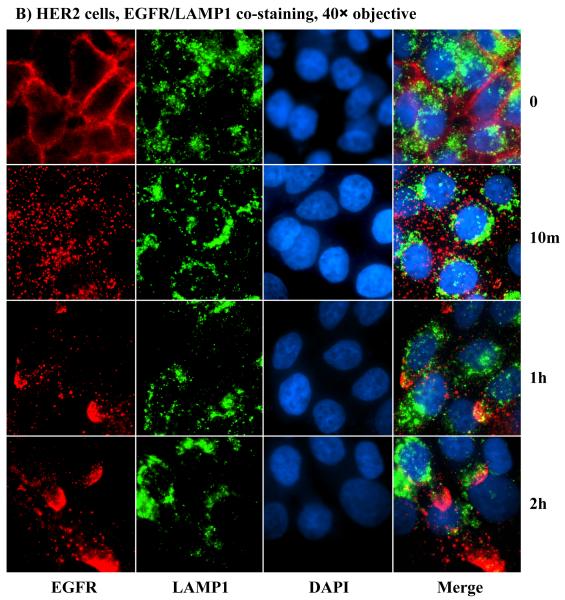
The gradual reappearance of HER2 and EGFR at the PM following ligand-induced internalization clearly demonstrated that HER2 promotes receptor recycling, but the mechanism was unclear. As a result, we sought to investigate the mechanism of HER2-induced receptor recycling. The small GTPase Rab11 and the lysosome-associated membrane protein-1 (LAMP1) have been shown to serve as markers for recycling and lysosomal targeting, respectively [17]. Hence, we used these proteins as markers for assessing the impact of HER2. Because HER2 is undetectable in the controls and hence comparisons between the controls and the HER2 cells could not be made, we used the EGFR for co-staining with the recycling and the degradation markers. At the zero time point, EGFR was at the PM in both the controls and the HER2 cells, Rab11 was randomly distributed in the cytoplasm, and LAMP1 was mostly localized to the perinuclear region (Figs.5A, 5B, S3A and S3B). At the 10 minutes time point, most of the EGFR in the HER2 cells was co-localized with Rab11 (Fig.5A), but there was very little co-localization in the controls (Fig.S3A). The vice versa was true for EGFR and LAMP1 - most EGFR molecules co-localized with LAMP1 in the controls (Fig.S3B), but very little in the HER2 cells (Fig.5B). At subsequent time points, EGFR/Rab11-positive endosomes in the HER2 cells were sorted to one side of the nucleus with gradual outward extension and minimal decline in overall immunofluorescence signal (Fig.5A), which was consistent with the HER2/EGFR immunofluorescence shown in Fig.4. In contrast, further incubation of the control cells did not lead to a significant co-localization of EGFR with Rab11 (Fig.S3A), suggesting that negligible amount of EGFR was recycling. Rather, there was a gradual decline in EGFR fluorescence signal, indicating enhanced degradation (Fig.S3B). Therefore, HER2 promotes receptor recycling by channeling the EGFR and itself to Rab11-positive, while blocking targeting to LAMP1-positive endosomes.
Figure 5.
HER2 promotes sorting of itself and the EGFR to the recycling apparatus of the cell. A) Co-staining with anti-EGFR and anti-Rab11 antibodies in the HER2 cells. B) Co-staining with anti-EGFR and anti-LAMP1 antibodies in the HER2 cells. Notable findings were co-localization of EGFR with Rab11 (A), but absence of EGFR co-localization with LAMP1 (B).
Discussion
Under conditions of overexpression, HER2 molecules undergo spontaneous homodimerization and autophosphorylation that subsequently activates downstream signaling pathways. Spontaneous homodimerization is possible because the extracellular domain of HER2 is unconstrained by intramolecular interactions [7]. This property of HER2 is often invoked to explain its oncogenicity in breast cancer and other cancers in which HER2 is overexpressed. A great deal of experimental data shows that even a modest expression of HER2 induces cell transformation, while similar expression of the other family members does not due to tight regulations. But, the sufficiency of HER2 overexpression as well as the potential contribution of the normally expressed family members especially EGFR, whose elevated expression accompanies anti-HER2 therapy resistance in HER2-positive breast cancer [33, 34], have not been addressed. In this report, we have presented evidence that show that HER2 alone is modestly sufficient, but has extraordinary ability to muster signaling and cell transformation potency from the normally-expressed EGFR. We also show that the mechanism by which HER2 potentiates its oncogenic property is by promoting receptor recycling following ligand activation.
We have demonstrated that HER2 overexpression alone can induce increased basal signaling, but EGF stimulation was necessary to increase the intensity and/or duration even in the BT474 breast cancer cells that have a relatively low amount of endogenous EGFR (Fig.1). These results were further corroborated by shRNA-mediated inhibition of EGFR in which the intensity of ERK1/2 and Akt activation was significantly suppressed. We also have demonstrated that EGFR makes critical contribution to HER2 overexpression-induced cell transformation as determined by anchorage-independent growth in soft agar. Hence, HER2 requires a contribution from the EGFR and possibly from the other family members for optimal signaling and cell transformation. The finding that overexpressed HER2 exploits the normal level of EGFR for its transformation potential is very interesting and may have clinical significance. The implication is that combinatorial therapy with specific anti-HER2 and anti-EGFR drugs might be beneficial to HER2-positive breast cancer even in the absence of elevated expression of the EGFR. In support of this proposal, recent reports have shown that concurrent inhibition of EGFR and HER2 sensitizes herceptin-resistant cells [35].
EGF-induced ERK1/2 and Akt activation in the presence of HER2 followed a revamping pattern (Figs.1B, C and D), a clue provided by time course EGF stimulation experiments. Remarkably, this signaling pattern was abolished by down regulation of the EGFR (Figs.2B and C), suggesting that EGFR plays essential roles in enhancing the signaling potency of HER2. A logical explanation for the revamping pattern is the induction of short-circuited receptor internalization and reprocessing by HER2, leading to sustained signaling. A supporting evidence for this possibility is the demonstration by us (Fig.3) and by others [31, 32, 36] that HER2 overexpression confers EGFR resistance to ligand-induced degradation. Not only does HER2 protect EGFR, but it also is untouchable. It does so not by avoiding endocytosis, but by outwitting activation-induced degradation. This possibility was supported, at least indirectly, by proteosome inhibitor treatment studies (Figs.3C and D) that suggested that HER2 might be blocking poteosomal targeting. Therefore, one of the mechanisms by which HER2 musters signaling potency is by suppressing ligand-induced receptor degradation.
There has not been consensus on the immediate receptor response to ligand stimulation in the presence of HER2 overexpression. One view proposes that HER2 impairs endocytosis by sequestering EGFR at endocytosis-incompetent sites of the plasma membrane (non-clathrin-coated pits) [31, 37, 38], while the other view suggests that HER2 does not interfere with ligand-induced internalization [32, 39, 40]. Our results are in agreement with the latter reports and further show that the major role of HER2 is at the level of receptor reprocessing not internalization as evidenced by efficient internalization of both EGFR and HER2 following EGF stimulation (Fig.4A and S2). The reports that suggested HER2’s role as being at the level of the PM [31, 37, 38], particularly Offterdinger and Bastiaens, used a single time point (1 hour) EGF stimulation to make their conclusion, but it is possible that enough EGFR may have been recycled back to the PM within one hour to provide semblance of retention at the PM, and/or it might reflect presence of unliganded EGFR molecules due to ectopic overexpression.
Ligand activation of the EGFR leads to its endocytosis, ubiquitinylation and degradation, culminating in signal termination [41, 42], but HER2 overcomes this regulatory mechanism by inducing a short-circuited receptor reprocessing that leads to re-localization to the PM. The efficient internalization of both HER2 and EGFR within 10 minutes of EGF stimulation in the HER2 cells clearly demonstrates that HER2’s primary role is not sequestering EGFR and itself at the PM. Rather, HER2 promotes the sorting of EGFR and itself to Rab11-positive (recycling) while suppressing sorting to LAMP1-positive (lysosome-targeting) endosomes, which is consistent with enhanced receptor recycling (Figs. 5A, 5B, S3A and S3B). It can be argued that the reappearance of EGFR and HER2 at the PM in the 6 hours time range could be due to synthesis of new molecules. Our results cannot entirely rule out this possibility, but the insignificant decline in EGFR and HER2 in the HER2 cells and the lack of revamp in EGFR levels in the controls suggest otherwise. In addition, it is important to note that the immunoblotting (Fig.3) and immunofluorescence experiments (Fig.4) were conducted in serum-free medium that is not conducive to protein synthesis. Hence, blocked receptor degradation and enhanced recycling were the major factors for the sustained receptor levels in the HER2 cells. It will be interesting to study the molecular mechanism by which HER2 channels early endosomes to recycling Rab11-positive endosomes in future studies.
Supplementary Material
Figure S1: Band density measurement of pERK1/2 and pAkt in the control and EGFR-shRNA cells derived from the BT20-HER2 (A) and the BT474 (B) cells, corresponding to Fig.2B and 2C, respectively. The bar graphs represent mean ± standard deviation from three independent experiments.
Figure S2: Immunofluorescence microscopy of the control MCF-10A cells with anti-EGFR and anti-HER2 antibodies, corresponding to Fig.4A. Note that HER2 is undetectable, confirming that this cell line has a very low amount of endogenous HER2. As expected, EGF stimulation led to degradation of the EGFR as depicted by gradual decline of the fluorescence signal. Refer to Fig.4B for corresponding fluorescence intensity measurements.
Figure S3: Immunofluorescence microscopy in the MCF-10A-derived control cells, corresponding to Fig.5. A) Co-staining with anti-EGFR and anti-Rab11 antibodies, and B) co-staining with anti-EGFR and anti-LAMP1 antibodies. Notable findings were insignificant co-localization of EGFR with Rab11 (S3A) and enhanced localization of EGFR with LAMP1 (S3B).
*Highlights.
In the revised version, we have addressed all the concerns raised by reviewers. We have included new data, modified previous data as per suggestions from reviewers, and corrected errors. We hope that the revised version of the manuscript satisfies both the reviewers and yourself. Once again, we would like to state on our part that the publication of this article will further our understanding on the ability of HER2 to exploit normally-expressed receptor tyrosine kinases to enhance its oncogenic property.
Acknowledgement
This work was supported by a grant number CA124940 from the National Cancer Institute (NCI), a component of the National Institute of Health (NIH) to YMA.
Footnotes
Publisher's Disclaimer: This is a PDF file of an unedited manuscript that has been accepted for publication. As a service to our customers we are providing this early version of the manuscript. The manuscript will undergo copyediting, typesetting, and review of the resulting proof before it is published in its final citable form. Please note that during the production process errors may be discovered which could affect the content, and all legal disclaimers that apply to the journal pertain.
The authors do not have any commercial affiliation or conflict of interest to disclose.
References
- [1].Dionne CA, Jaye M, Schlessinger J. Ann N Y Acad Sci. 1991;638:161–166. doi: 10.1111/j.1749-6632.1991.tb49026.x. [DOI] [PubMed] [Google Scholar]
- [2].Johnson DE, Williams LT. Adv Cancer Res. 1993;60:1–41. doi: 10.1016/s0065-230x(08)60821-0. [DOI] [PubMed] [Google Scholar]
- [3].Ullrich A, Coussens L, Hayflick JS, Dull TJ, Gray A, Tam AW, Lee J, Yarden Y, Libermann TA, Schlessinger J, et al. Nature. 1984;309(5967):418–425. doi: 10.1038/309418a0. [DOI] [PubMed] [Google Scholar]
- [4].Ferguson KM, Berger MB, Mendrola JM, Cho HS, Leahy DJ, Lemmon MA. Mol Cell. 2003;11(2):507–517. doi: 10.1016/s1097-2765(03)00047-9. [DOI] [PubMed] [Google Scholar]
- [5].Garrett TP, McKern NM, Lou M, Elleman TC, Adams TE, Lovrecz GO, Zhu HJ, Walker F, Frenkel MJ, Hoyne PA, Jorissen RN, Nice EC, Burgess AW, Ward CW. Cell. 2002;110(6):763–773. doi: 10.1016/s0092-8674(02)00940-6. [DOI] [PubMed] [Google Scholar]
- [6].Ogiso H, Ishitani R, Nureki O, Fukai S, Yamanaka M, Kim JH, Saito K, Sakamoto A, Inoue M, Shirouzu M, Yokoyama S. Cell. 2002;110(6):775–787. doi: 10.1016/s0092-8674(02)00963-7. [DOI] [PubMed] [Google Scholar]
- [7].Garrett TP, McKern NM, Lou M, Elleman TC, Adams TE, Lovrecz GO, Kofler M, Jorissen RN, Nice EC, Burgess AW, Ward CW. Mol Cell. 2003;11(2):495–505. doi: 10.1016/s1097-2765(03)00048-0. [DOI] [PubMed] [Google Scholar]
- [8].Badache A, Goncalves A. J Mammary Gland Biol Neoplasia. 2006;11(1):13–25. doi: 10.1007/s10911-006-9009-1. [DOI] [PubMed] [Google Scholar]
- [9].Carlsson J, Nordgren H, Sjostrom J, Wester K, Villman K, Bengtsson NO, Ostenstad B, Lundqvist H, Blomqvist C. Br J Cancer. 2004;90(12):2344–2348. doi: 10.1038/sj.bjc.6601881. [DOI] [PMC free article] [PubMed] [Google Scholar]
- [10].Fukushige S, Matsubara K, Yoshida M, Sasaki M, Suzuki T, Semba K, Toyoshima K, Yamamoto T. Mol Cell Biol. 1986;6(3):955–958. doi: 10.1128/mcb.6.3.955. [DOI] [PMC free article] [PubMed] [Google Scholar]
- [11].King CR, Kraus MH, Aaronson SA. Science. 1985;229(4717):974–976. doi: 10.1126/science.2992089. [DOI] [PubMed] [Google Scholar]
- [12].Pawson T, Gish GD. Cell. 1992;71(3):359–362. doi: 10.1016/0092-8674(92)90504-6. [DOI] [PubMed] [Google Scholar]
- [13].Feng GS, Shen R, Heng HH, Tsui LC, Kazlauskas A, Pawson T. Oncogene. 1994;9(6):1545–1550. [PubMed] [Google Scholar]
- [14].Hadari YR, Kouhara H, Lax I, Schlessinger J. Mol Cell Biol. 1998;18(7):3966–3973. doi: 10.1128/mcb.18.7.3966. [DOI] [PMC free article] [PubMed] [Google Scholar]
- [15].Lechleider RJ, Sugimoto S, Bennett AM, Kashishian AS, Cooper JA, Shoelson SE, Walsh CT, Neel BG. J Biol Chem. 1993;268(29):21478–21481. [PubMed] [Google Scholar]
- [16].Schlessinger J, Mohammadi M, Margolis B, Ullrich A. Cold Spring Harb Symp Quant Biol. 1992;57:67–74. doi: 10.1101/sqb.1992.057.01.009. [DOI] [PubMed] [Google Scholar]
- [17].Baldys A, Gooz M, Morinelli TA, Lee MH, Raymond JR, Jr., Luttrell LM, Raymond JR., Sr. Biochemistry. 2009;48(7):1462–1473. doi: 10.1021/bi801771g. [DOI] [PMC free article] [PubMed] [Google Scholar]
- [18].Jiang X, Sorkin A. Traffic. 2003;4(8):529–543. doi: 10.1034/j.1600-0854.2003.t01-1-00109.x. [DOI] [PubMed] [Google Scholar]
- [19].Umebayashi K, Stenmark H, Yoshimori T. Mol Biol Cell. 2008;19(8):3454–3462. doi: 10.1091/mbc.E07-10-0988. [DOI] [PMC free article] [PubMed] [Google Scholar]
- [20].Agazie YM, Hayman MJ. Mol Cell Biol. 2003;23(21):7875–7886. doi: 10.1128/MCB.23.21.7875-7886.2003. [DOI] [PMC free article] [PubMed] [Google Scholar]
- [21].Bollag G, McCormick F. Nature. 1991;351(6327):576–579. doi: 10.1038/351576a0. [DOI] [PubMed] [Google Scholar]
- [22].Ekman S, Thuresson ER, Heldin CH, Ronnstrand L. Oncogene. 1999;18(15):2481–2488. doi: 10.1038/sj.onc.1202606. [DOI] [PubMed] [Google Scholar]
- [23].Pamonsinlapatham P, Hadj-Slimane R, Lepelletier Y, Allain B, Toccafondi M, Garbay C, Raynaud F. Biochimie. 2009;91(3):320–328. doi: 10.1016/j.biochi.2008.10.010. [DOI] [PubMed] [Google Scholar]
- [24].Scheffzek K, Ahmadian MR, Kabsch W, Wiesmuller L, Lautwein A, Schmitz F, Wittinghofer A. Science. 1997;277(5324):333–338. doi: 10.1126/science.277.5324.333. [DOI] [PubMed] [Google Scholar]
- [25].Debnath J, Muthuswamy SK, Brugge JS. Methods. 2003;30(3):256–268. doi: 10.1016/s1046-2023(03)00032-x. [DOI] [PubMed] [Google Scholar]
- [26].Agazie YM, Movilla N, Ischenko I, Hayman MJ. Oncogene. 2003;22(44):6909–6918. doi: 10.1038/sj.onc.1206798. [DOI] [PubMed] [Google Scholar]
- [27].Yuan YL, Zhou XH, Song J, Qiu XP, Li J, Ye LF. J Laryngol Otol. 2008;122(9):952–960. doi: 10.1017/S0022215107000606. [DOI] [PubMed] [Google Scholar]
- [28].Duan L, Miura Y, Dimri M, Majumder B, Dodge IL, Reddi AL, Ghosh A, Fernandes N, Zhou P, Mullane-Robinson K, Rao N, Donoghue S, Rogers RA, Bowtell D, Naramura M, Gu H, Band V, Band H. J Biol Chem. 2003;278(31):28950–28960. doi: 10.1074/jbc.M304474200. [DOI] [PubMed] [Google Scholar]
- [29].Longva KE, Blystad FD, Stang E, Larsen AM, Johannessen LE, Madshus IH. J Cell Biol. 2002;156(5):843–854. doi: 10.1083/jcb.200106056. [DOI] [PMC free article] [PubMed] [Google Scholar]
- [30].Pasleau F, Grooteclaes M, Gol-Winkler R. Oncogene. 1993;8(4):849–854. [PubMed] [Google Scholar]
- [31].Haslekas C, Breen K, Pedersen KW, Johannessen LE, Stang E, Madshus IH. Mol Biol Cell. 2005;16(12):5832–5842. doi: 10.1091/mbc.E05-05-0456. [DOI] [PMC free article] [PubMed] [Google Scholar]
- [32].Worthylake R, Opresko LK, Wiley HS. J Biol Chem. 1999;274(13):8865–8874. doi: 10.1074/jbc.274.13.8865. [DOI] [PubMed] [Google Scholar]
- [33].Dua R, Zhang J, Nhonthachit P, Penuel E, Petropoulos C, Parry G. Breast Cancer Res Treat. 122(3):685–697. doi: 10.1007/s10549-009-0592-x. [DOI] [PubMed] [Google Scholar]
- [34].Wilken JA, Maihle NJ. Ann N Y Acad Sci. 1210:53–65. doi: 10.1111/j.1749-6632.2010.05782.x. [DOI] [PMC free article] [PubMed] [Google Scholar]
- [35].Narayan M, Wilken JA, Harris LN, Baron AT, Kimbler KD, Maihle NJ. Cancer Res. 2009;69(6):2191–2194. doi: 10.1158/0008-5472.CAN-08-1056. [DOI] [PubMed] [Google Scholar]
- [36].Huang G, Chantry A, Epstein RJ. J Cell Biochem. 1999;74(1):23–30. [PubMed] [Google Scholar]
- [37].Hommelgaard AM, Lerdrup M, van Deurs B. Mol Biol Cell. 2004;15(4):1557–1567. doi: 10.1091/mbc.E03-08-0596. [DOI] [PMC free article] [PubMed] [Google Scholar]
- [38].Offterdinger M, Bastiaens PI. Traffic. 2008;9(1):147–155. doi: 10.1111/j.1600-0854.2007.00665.x. [DOI] [PubMed] [Google Scholar]
- [39].Hendriks BS, Opresko LK, Wiley HS, Lauffenburger D. Cancer Res. 2003;63(5):1130–1137. [PubMed] [Google Scholar]
- [40].Lenferink AE, Pinkas-Kramarski R, van de Poll ML, van Vugt MJ, Klapper LN, Tzahar E, Waterman H, Sela M, van Zoelen EJ, Yarden Y. EMBO J. 1998;17(12):3385–3397. doi: 10.1093/emboj/17.12.3385. [DOI] [PMC free article] [PubMed] [Google Scholar]
- [41].Alwan HA, van Zoelen EJ, van Leeuwen JE. J Biol Chem. 2003;278(37):35781–35790. doi: 10.1074/jbc.M301326200. [DOI] [PubMed] [Google Scholar]
- [42].Sigismund S, Argenzio E, Tosoni D, Cavallaro E, Polo S, Di Fiore PP. Dev Cell. 2008;15(2):209–219. doi: 10.1016/j.devcel.2008.06.012. [DOI] [PubMed] [Google Scholar]
Associated Data
This section collects any data citations, data availability statements, or supplementary materials included in this article.
Supplementary Materials
Figure S1: Band density measurement of pERK1/2 and pAkt in the control and EGFR-shRNA cells derived from the BT20-HER2 (A) and the BT474 (B) cells, corresponding to Fig.2B and 2C, respectively. The bar graphs represent mean ± standard deviation from three independent experiments.
Figure S2: Immunofluorescence microscopy of the control MCF-10A cells with anti-EGFR and anti-HER2 antibodies, corresponding to Fig.4A. Note that HER2 is undetectable, confirming that this cell line has a very low amount of endogenous HER2. As expected, EGF stimulation led to degradation of the EGFR as depicted by gradual decline of the fluorescence signal. Refer to Fig.4B for corresponding fluorescence intensity measurements.
Figure S3: Immunofluorescence microscopy in the MCF-10A-derived control cells, corresponding to Fig.5. A) Co-staining with anti-EGFR and anti-Rab11 antibodies, and B) co-staining with anti-EGFR and anti-LAMP1 antibodies. Notable findings were insignificant co-localization of EGFR with Rab11 (S3A) and enhanced localization of EGFR with LAMP1 (S3B).


