

Abstract
Microglial cells play a dynamic role in the brain beyond their established function of immune surveillance. Activated microglia play key roles in neural development, neuroinflammation, neural repair and neurotoxicity. They are particularly important in several neurodegenerative diseases in which sustained microglial activation contributes to the progression of neurodegenerative processes. Consequently, understanding microglial function in CNS health and disease has become an area of active research in recent years. However, a significant obstacle to progress in this field has been the inherent difficulties in obtaining large amounts of primary microglial cells to routinely perform mechanistic studies and characterize signaling pathways regulating the dynamics of microglial activation. Herein, we describe a novel column-free magnetic separation protocol for high-yield isolation of primary microglia from mouse postnatal mixed glial cultures. The procedure is based on optimized culture conditions that enable high microglial cell densities in confluent mixed glial cultures followed by highly efficient recovery of pure microglia by magnetic separation. The novel column-free magnetic separation system utilizes tetrameric antibody complexes (TAC) with dual specificity for CD11b-PE labeled microglia and dextran magnetic nanoparticles. An FcR blocker (anti-CD16/32) is added to enhance the purity of the microglial separation by preventing non-specific labeling of other cell types. This procedure yields on average >3 × 10⁶ microglial cells per mouse pup, with a remarkable purity of 97% and recovery of around 87% of microglia from the mixed glial population. Importantly, the microglia obtained by this method are fully functional and respond like cells obtained by conventional isolation techniques.
Keywords: Cell culture, Microglia, Microglial isolation, Microglial activation, Magnetic separation, Neuroinflammation, Neurodegeneration, Parkinson’s disease
1. Introduction
The functional responses of microglia in the normal and diseased brain have become intensively investigated since their discovery as key players in the central nervous system (CNS). Besides their established functions of immune surveillance and phagocytic clearance in the brain, activated microglia have been shown to participate in neuronal survival by providing neurotrophic support and in maintaining neuron homeostasis during development (Bessis et al., 2007; Marin-Teva et al., 2004; Streit, 2002). They also have been implicated in facilitating neurogenesis and neural repair by directing the migration of neuronal progenitors to the sites of brain injury (Aarum et al., 2003; Walton et al., 2006). However, in chronic neurodegenerative diseases such as Alzheimer’s or Parkinson’s disease, there is compelling experimental evidence that microglial activation becomes deregulated and that the sustained reactive microgliosis that occurs can be neurotoxic and exacerbate neurodegeneration (Block et al., 2007). Under disease conditions, the persistently activated microglia can augment neurodegenerative processes by promoting oxidative stress, as well as by producing proinflammatory mediators including cytokines and chemokines (Aschner et al., 1999; Glass et al., 2010)
Although much progress has been made at the cellular level in terms of defining the functional role of microglia as active players in CNS development, health and disease, far less is known about the subcellular processes, extracellular interactions and intracellular signaling pathways that regulate the dynamics of microglial activation. Particularly, the process by which microglia become chronically activated in neurodegenerative diseases and evade intrinsic mechanisms of regulatory control is largely unknown (Block et al., 2007; Glass et al., 2010). Understanding these phenomena would have immense therapeutic implications since reactive microgliosis is evident in most neurodegenerative diseases. The study of microglial cell biology, however, has been hindered due to inherent difficulties with obtaining large enough yields of primary microglial cells to routinely perform experimental techniques to elucidate signaling pathways, such as Western blotting, cell fractionation or proteomic studies. Unlike astrocytes, isolated primary microglia do not proliferate well unless specific growth factors are added. Immortalized cell lines, such as the BV-2 and N9 cells, have been widely used to study microglial responses. However, the highly dynamic and intricate process of microglial activation is poorly reproduced by such cell lines as they do not display the quintessential morphology changes seen with activation. Also, these cell lines have a far more limited cytokine and chemokine profile in comparison with primary microglia. In vitro experiments with isolated primary microglia are therefore of immense utility in deciphering the signaling pathways and complex interactions regulating microglial activation and provide the most relevant model system for mechanistic studies.
Various protocols have been developed for microglial isolation. The differential adherence method is one of the most popular protocols. Mixed glial cultures are obtained from newborn rodent brains and allowed to grow to confluency. The microglial cells are then separated from the adherent astrocyte layer by agitation on a rotary shaker (Floden and Combs, 2007). The resulting microglial cell population, though highly pure, is low in number since most of the microglia that grow below the astrocyte layer are not recovered. Mild trypsinization has been reported as an alternative to the differential adherence method, and allows for a higher yield of pure microglial cells (Saura et al., 2003). Again, primary mixed glial cultures are obtained from newborn rodent brains and grown to confluency. An optimal concentration of trypsin, Ca2+, and EDTA has been determined and used to selectively detach the astrocyte layer, leaving the microglial cells attached. Mild trypsinization allows for a higher yield of microglia with purities comparable to the differential adherence method, though the amount of microglial cells obtained is still insufficient when considering possible experimental designs. Column-based magnetic separation is one of the newer techniques for isolation of primary microglia (Marek et al., 2008). Confluent mixed cultures are trypsinized and incubated with CD11b magnetic microbeads that specifically label microglial cells. The labeled cells then are run through a magnetic column where the microglial cells are selectively retained, while unlabeled cells pass through and are removed. After several washes, a purified fraction of microglial cells can be eluted. The microglia yield from column-based magnetic separation, however, is no higher than that obtained with mild trypsinization. With the advent of highly specific monoclonal antibodies that label unique cell populations, magnetic cell separation technology has progressed to become an indispensable tool for cell separation in the field of immunology, and has been widely used to separate and analyze almost every immune cell type (Grutzkau and Radbruch, 2010).
In this study, we report a new column-free magnetic separation method for high-yield isolation of primary microglia from postnatal mixed glial cultures, which is both simple and efficient. This procedure requires no special columns and can be carried out in routinely used round bottom polystyrene tubes. Unlike previously reported magnetic separation methods that utilize CD11b microbeads, our procedure utilizes bispecific tetrameric antibody complexes (TAC) and dextran-coated magnetic nanoparticles to label and purify microglial cells based on their selective expression of the CD11b epitope. Further, an anti-CD16/32 (Fcγ III/II receptor) antibody is added to the labeling reagent as an FcR blocker to enhance the purity of the microglial separation by preventing non-specific labeling of other cell types in the mixed glial population. This system provides a rapid and efficient separation of microglia with extremely high recoveries (87.98 ± 2.6%) and purity levels in excess of 97%, which is sufficient for most types of studies. The magnetically separated microglia show typical morphological and functional responses with various activation stimuli for all aspects of the microglial response that were tested, including nitric oxide production, cytokine release and intracellular ROS generation. Notably, this method affords a yield and recovery of primary microglial cells that is high enough to perform common biochemical experiments involving Western blotting, PCR, and proteomics without sacrificing unreasonable numbers of postnatal mouse pups.
2. Materials and Methods
2.1 Preparation of mixed glia cultures
Primary cultures were prepared from C57bl6 postnatal day P0 to P1 mouse pups. Mouse brains were harvested, meninges removed and then placed in ice-cold Dulbecco’s modified Eagle’s medium/F-12 nutrient mixture (DMEM-F12,GIBCO Cat # 11320) supplemented with 10% heat-inactivated fetal bovine serum (FBS), 50 U/mL penicillin, 50 μg/mL streptomycin, 2 mM L-glutamine, 100 μM non-essential amino acids, and 2 mM sodium pyruvate (Invitrogen). The tissue then was incubated in 0.25% trypsin (Sigma) in a 37°C water bath for 30 min with gentle agitation. Trypsinization was stopped by adding an equal volume of DMEM-F12 complete media, and the brain tissue was washed three times in the same medium. A single cell suspension of the brain tissue was prepared by gentle trituration and passed through a 70 μm nylon mesh cell strainer to remove tissue debris and aggregates. The cell suspension then was made up in DMEM-F12 complete medium and seeded such that one mouse brain was plated into 2 T-75 flasks, each containing a total volume of 12 mL. Cells were placed in a humidified CO2 incubator at 37°C and allowed to attach. The medium was changed after 4 to 5 days and the mixed glial cells were allowed to grow to confluence. Microglial separations were performed on days 14 to 16, at which time the microglial cell density in the mixed glial cultures is high (Saura et al., 2003).
2.2 Differential adherence isolation of microglia from mixed glial cultures
Confluent 14- to 16-day old mixed glial cultures were placed on an orbital shaker (Stovall Belly Dancer) at 120 rpm for 2.5 h to induce the detachment of the microglial cells. Immediately following agitation, the supernatant containing the microglia was collected and centrifuged at 300 × g for 5 min and resuspended in 2 mL of fresh DMEM-F12 complete medium. The primary microglia were counted using a Beckman Coulter Vi-Cell XR automated cell counter and plated according to the cell number required for experiments.
2.3 Column-free magnetic separation for isolating microglia from mixed glia
Column-free magnetic separation was performed on 14- to 16-day old confluent mixed glial cultures using the EasySep mouse CD11b positive selection kit purchased from STEMCELL Technologies (Catalog # 18770). The principle of the column-free magnetic separation method is presented in Fig. 1. Cells were trypsinized with 3 mL of 0.25% trypsin per T-75 flask. The flasks were agitated on a rotary shaker for 20 min and the trypsin reaction was stopped by adding 6 mL of DMEM-F12 complete media. Any remaining adherent cells were scraped off using a cell scraper. The harvested cell suspension was then gently triturated to break down cell aggregates, and then passed through a 70 μm cell strainer to get a uniform single cell suspension. Obtaining a uniform single cell suspension, free from aggregates, is critical to achieve a high yield and purity with magnetic separation. The cells were centrifuged at 200 × g for 6 min and counted on a Beckman Coulter ViCell XR automated cell counter. The mixed glial cells were resuspended at a density of up to 1×10⁸ cells/mL in the recommended separation medium (PBS containing 2% FBS and 1 mM EDTA, with no calcium or magnesium) and transferred to a Falcon 5 mL polystyrene round-bottom tube (BD Biosciences, Catalog #352058). The labeling reagent containing the CD11b-Phycoerythrin (CD11b-PE) monoclonal antibody and the FcR blocker (anti-CD16/32) was added at 50 μL/mL. The cell suspension was mixed gently and incubated at room temperature for 15 min. The PE-Selection Cocktail (containing the bispecific tetrameric antibody complexes directed against phycoerythrin and dextran) was then added at 70 μL/mL. The cell suspension was mixed well and allowed to incubate at room temperature for 15 min. The dextran-coated EasySep Magnetic Nanoparticles were gently mixed to obtain a uniform suspension and added at 50 μL/mL, mixed well, and allowed to incubate at room temperature for 10 min. The cell suspension was then made up to a total volume of 2.5 mL with separation medium. The cells were gently mixed to obtain uniform dispersion and the tube was placed into the EasySep Magnet obtained with the kit and set aside for 7 min. In one continuous motion, the EasySep Magnet was inverted to pour off the unlabeled cells. The magnetically labeled microglial cells remained inside the tube, held by the magnetic field of the magnet. The magnet and tube were left in the inverted position for 2-3 s, and then carefully returned to an upright position. The tube was then removed from the magnet and the magnetically retained cell suspension was made up to a volume of 2.5 mL with separation medium. The cell suspension was mixed by gentle pipetting up and down 2-3 times, and the tube was placed back into the magnet. The wash step was repeated 3 times to obtain purity levels of >97%. After the final wash, the purified microglial cells (positive fraction) were resuspended in DMEM/F12 complete media and counted using the Beckman Coulter Vi-Cell automated cell counter prior to seeding for experiments. The unlabeled cells obtained from the second and third pour-off steps were collected as the negative fraction.
Fig. 1. Principle of column-free magnetic separation.

Schematic illustration of CD11b-PE Tetrameric Antibody Complex (TAC) technology used for column-free immunomagnetic separation of microglia (A). Flow diagram (B) of steps involved in column free magnetic separation of microglia from postnatal mixed glial cultures (Graphics used with permission from STEMCELL Technologies Inc)
2.4 Flow cytometry
The proportion of microglia in different cell populations was estimated by direct labeling with CD11b-PE followed by flow cytometric analysis. Cells were counted using a Vi-Cell XR automated cell counter and 1×10⁶ cells/mL were resuspended in 100 μL of flow cytometry buffer (PBS with calcium and magnesium containing 0.01% sodium azide). Cells were labeled using the mouse CD11b-PE labeling reagent (STEMCELL Technologies) according to the manufacturer’s instructions. After labeling, the cells were washed twice in flow cytometry buffer and resuspended at a final volume of 1 mL and stored on ice until analysis. Flow cytometry was performed on a BD FACSCanto flow cytometer at Iowa State University’s centralized flow cytometry facility, and data analysis was performed using the instrument’s software package.
2.5 Immunofluorescence
Immunofluorescence microscopy also was used to validate the purity levels of the microglial separations determined by flow cytometry. The positive and negative fractions obtained after separation, as well as the total mixed glial cell population obtained prior to magnetic separation, were seeded on poly-D-lysine- coated coverslips in a 24-well plate at a density of 200,000 cells per well. Cells were fixed with 4% paraformaldehyde for 30 min and washed five times with PBS. The cells were blocked and permeabilized for 1 h in blocking buffer (PBS containing 2% BSA, 0.5% TritonX and 0.05% Tween 20) and incubated with primary antibodies at 4°C overnight in PBS with 2% BSA. Primary antibodies used were goat polyclonal to Iba1 (Abcam) for microglia and rabbit polyclonal GFAP (Santa Cruz Biotechnology) for astrocytes, both at a concentration of 1:1000. After 3 washes in PBS, species-specific secondary antibodies (Alexa Fluor, Molecular Probes) were added at room temperature for 1 h. Images were captured using a Nikon Eclipse TE-2000 fluorescence microscope.
2.6 Western blotting
For Western blot analysis, magnetically separated microglia cells were plated at a density of 4 × 10⁶ cells per flask in poly-D-lysine coated T-25 flasks. Cells were stimulated with 100 ng/mL LPS or 200 nM aggregated alpha synuclein (rPeptide Inc.) for 24 h. After treatment, cells were collected by trypsinization and cell scraping. Cell pellets were lysed using RIPA buffer (Pierce Biotechnology) and 30 μg of protein was loaded per sample. Proteins were separated on 12% polyacrylamide gels and transferred to a nitrocellulose membrane (BioRad) overnight. Membranes were incubated in fluorescent Western blocking buffer (Rockland Immunochemicals) for 45 min and then probed with primary antibodies for gp91phox (BD Transduction) at a dilution of 1:1,000, iNOS/NOS2 (Santa Cruz Biotechnology) at a concentration of 1:200, and Iba1 (Abcam) at 1:1000. β-actin (Sigma-Aldrich) at a concentration of 1:10,000 was used as the loading control. Fluorescent infrared dye-tagged secondary antibodies (Molecular Probes) were used to visualize the bands, and the membranes were scanned on an Odyssey Infrared Imaging System (Li-Cor Biosciences).
2.7 Microglial nitric oxide detection
Microglial nitric oxide production was determined indirectly by quantification of nitrite in the supernatant using the Griess reagent (Sigma Aldrich). Magnetically separated microglia were plated in poly-D-lysine coated 96-well plates at 150,000 cells per well. After attachment, cells were treated with 100 ng/mL of LPS for 24 h or pretreated with 100 μM apocynin for 30 min. After treatment, 100 μL of supernatant was collected from each well and an equal volume of the Griess reagent was added. The samples were incubated on a plate shaker at room temperature for 15 min until a stable color was obtained. The absorbance at 540 nm was measured using a Synergy 2 multimode microplate reader (BioTek Instruments) and the nitrite concentration determined using a sodium nitrite standard curve.
2.8 Cytokine assays
Magnetically separated microglia cells were seeded in poly-D-lysine coated 96-well plates at 50,000 cells per well and allowed to attach overnight. Cells were treated for 24 h with 100 ng/mL of LPS or pretreated with 100μM apocynin for 30 min. After treatment, 50 μL of supernatant from each well was collected and frozen at -80°C. Cytokine levels were determined using the Luminex bead-based immunoassay system using recombinant cytokine standards (Vignali, 2000).
2.9 Intracellular reactive oxygen species (iROS) detection
Intracellular reactive oxygen species (ROS) were determined using the fluorescent probe 2’,7’-dichlorodi-hydrofluorescein diacetate (DCFH-DA) (EMD Chemicals), according to previously published protocols (Qian et al., 2007; Zhang et al., 2005). Purified microglia were plated on a 96-well plate at 105 cells per well. Before treatment, cells were washed in HBSS and incubated with 40 μM DCFH-DA in HBSS containing 2% FBS for 30 min. Cells were then treated with 100 ng/mL LPS, 30 ng/mL of recombinant mouse TNF alpha (Sigma-Aldrich) or 200 nM aggregated alpha synuclein (rPeptide Inc.) for 6 h. For iROS inhibition studies with apocynin, cells were pretreated with 100 μM apocynin for 30 min and then treated with LPS for 12 hours. Shorter treatment times were chosen for iROS generation studies based on previously published reports (Zhang et al., 2005) and because maximal iROS generation typically occurs early during microglial activation. After treatment, the plate was covered with foil and placed in a humidified CO2 incubator at 37°C for 1 h and the fluorescence intensity was determined using a Synergy-2 multi-mode microplate reader at an excitation of 485/20 and an emission of 530/25. The fluorescence value from the control cultures was subtracted as background and the increase in fluorescence with treatments was expressed as increased iROS (Qian et al., 2007; Zhang et al., 2005).
2.10 Statistics
The data are expressed as the mean ± SE. Statistical significance was determined by ANOVA, followed by Bonferroni t-test using the GraphPad Prism statistical analysis software package. Values of p < 0.05 were considered statistically significant.
3. Results
3.1 Yield and purity of primary microglia by magnetic separation
Flow cytometry and immunofluorescence studies were performed on parallel cultures to evaluate the purity of the microglia before and after magnetic separation. Confluent 14- to 16-day old mixed glial cultures grown in DMEM-F12 contained 25.55 ± 3.0% CD11b+ microglia. After magnetic separation, the positive fraction contained 97.65 ± 0.83% pure CD11b+ microglia and the negative fraction contained 1.650 ± 0.34% microglial cells (Table 1). Using flow cytometry and automated cell counting of the CD11b+ population in the total mixed glial cells and magnetically enriched microglial fractions, we estimated the percent recovery. With differential adherence it was possible to recover only 25.94 ± 3.9% of the total microglial population from the mixed glial cultures. In comparison, our column-free magnetic separation procedure recovered about 87.98 ± 2.6% (Table 2). As depicted in Figure 2, the quantitative data obtained with flow cytometry were also confirmed by immunofluorescence using a different microglial marker, Iba1, which is commonly used to identify microglia. GFAP was used to label the astrocytes that were typically the most abundant cells in the mixed glial cultures. Mixed cultures before magnetic separation showed distinctive populations of microglia and astrocytes (Fig.2A-B). Immunofluorescence labeling of positive fractions obtained after magnetic separation revealed a co-localization of almost all the Hoechst positive cells with Iba1 staining (Fig.2C-D), indicating that most of the cells are microglia. Conversely, the negative fractions contained mostly GFAP-positive astroglial cells (Fig.2E-F). In terms of purity, both magnetic separation and differential adherence had more than 97% microglial purity, as determined by immunofluorescence (Fig.3A to F) and quantification of the nuclear stain Hoechst co-localized Iba1-positive microglia and GFAP-positive astrocytes (Fig. 3G).
Table 1.
Summary of flow cytometric estimates of CD11b+ microglial population before and after column-free magnetic separation
| Cell Population Analyzed | Percent of CD11b-positive cells determined by flow cytometry |
|---|---|
| Total Mixed Glial Population (Pre-separation) | 25.55 ± 3.2 |
| Positive Fraction (Magnetically Separated Microglia) | 97.65 ± 0.8 |
| Negative Fraction (Microglia Depleted Fraction) | 1.650 ± 0.3 |
Data from 4 representative separations is expressed as the mean ± SE
Table 2.
Comparison of microglial yield and recovery with column-free magnetic separation and differential adherence methods
| Microglia Separation Method | Yield Per Mouse Brain (×106 Cells) | CD11b+ Cell Recovery | Purity |
|---|---|---|---|
| Column-free Magnetic Separation | 3.2 ± 0.38 | 87.98 ± 2.6% | >97% |
| Differential Adherence | 0.6 ± 0.18 | 25.94 ± 3.9% | >97% |
Data from 4 representative separations is expressed as the mean ± SE
Fig. 2. Analysis of microglial population before and after magnetic separation.

The proportion of microglia was determined quantitatively by flow cytometry with direct CD11b-PE labeling and also confirmed by iba1/GFAP/Hoechst immunofluorescence. Before separation, the mixed glial population contained around 26% CD11b+ microglia (B,A). After magnetic separation, the positive fraction contained more than 97% pure microglia (D,C) while the negative fraction had less than 2% microglia with abundant GFAP-positive cells (F,E). Results from one representative separation are shown. Data for multiple separations is summarized in Table1.
Fig. 3. Comparison of microglial cell purity obtained by differential adherence and magnetic separation.

Triple labeling immunofluorescence was with iba1/GFAP/Hoechst was used to compare microglial purity obtained by magnetic separation (A,B,C) and differential adherence (D,E,F). As shown above both methods had comparable purities with greater than 97% iba1-positive microglia. The number of Hoechst co-localized iba1-positive microglia and GFAP-positive astrocytes were also counted to quantitatively estimate the purity levels (G)
3.2 Morphology, nitric oxide generation and cytokine release
Since functional validation of the microglia is critical to establishing the utility of our method, we examined different aspects of the microglial response in the magnetically separated microglia following the activation with known stimuli. Phase contrast microscopy revealed the typical microglial morphology normally seen with activation, including hypertrophy and extensive branched processes, as compared to the unstimulated microglia (Fig. 4B-C). The morphology of the resting microglia showed slight variations depending on the cell density and the number of days in vitro. Next we studied the microglial response to the bacterial endotoxin LPS (Glezer et al., 2007; Lehnardt et al., 2003), and also used the well characterized NADPH oxidase inhibitor apocynin to attenuate LPS-induced activation (Bedard and Krause, 2007; Vejrazka et al., 2005). As shown in Fig. 5, nitrite levels were profoundly increased upon LPS treatment at 24 h and were attenuated with apocynin pretreatment. We also studied the cytokine responses from magnetically separated microglia stimulated with LPS. The levels of two proinflammatory cytokines TNFα and IL-1β, as well as the prototypical anti-inflammatory cytokine IL-10, were measured in cell-free supernatants after 24 h of LPS treatment. As expected, LPS induced a dramatic increase in cytokine levels while apocynin treatment attenuated LPS-induced cytokine production to various extents depending on the specific cytokine (Fig. 6). The suppression of microglial nitric oxide production and cytokine release by apocynin is consistent with the established functions of apocynin as an inhibitor of peroxynitrite formation and cytokine production in microglia and other phagocytic cells (Stefanska and Pawliczak, 2008). These results demonstrate that the magnetically isolated microglia show expected activation profiles for both nitric oxide and cytokine production and have similar responses compared to primary microglia obtained by other methods.
Fig. 4. Morphological assessment of magnetically separated microglia.

Phase contrast microscopy was used to study microglial morphology. In confluent mixed glial cultures (A) abundant microglia are within the astrocyte layer. In magnetically separated microglia dramatic morphology changes, typical of activated microglia were observed with LPS (100ng/ml for 24 h) treatment (C) compared to unstimulated microglia (B).
Fig. 5. Nitrite levels in magnetically separated microglia.
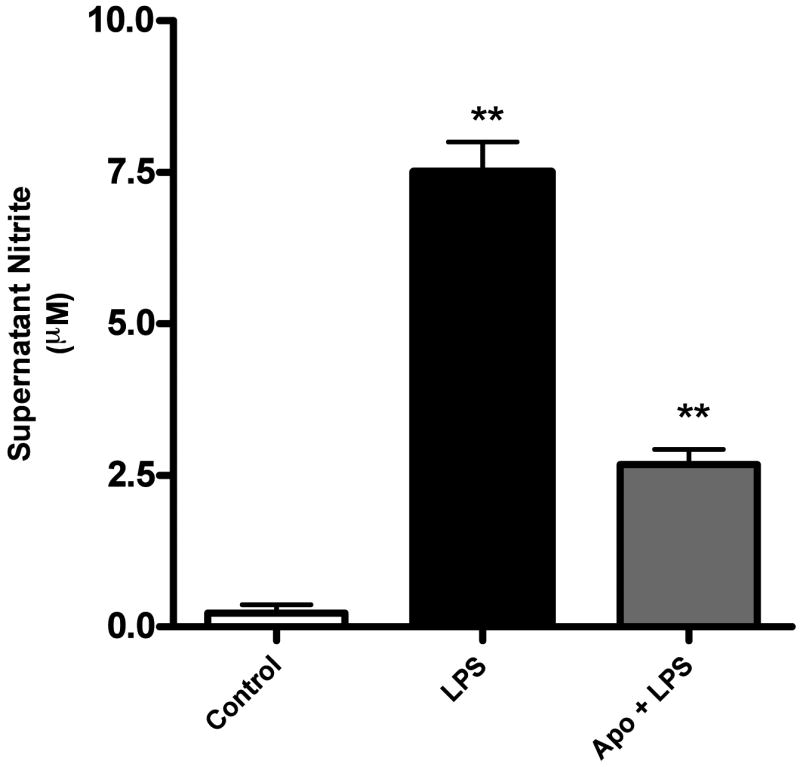
Nitric oxide production was estimated by quantification of nitrite using the Griess reagent. LPS (100ng/ml, 24 h) treatment induced a significant increase in nitrite production (** p<0.01) compared to control, which was attenuated by pretreatment with 100μM apocynin (** p<0.01 compared to LPS).
Fig. 6. Cytokine release in magnetically separated microglia.
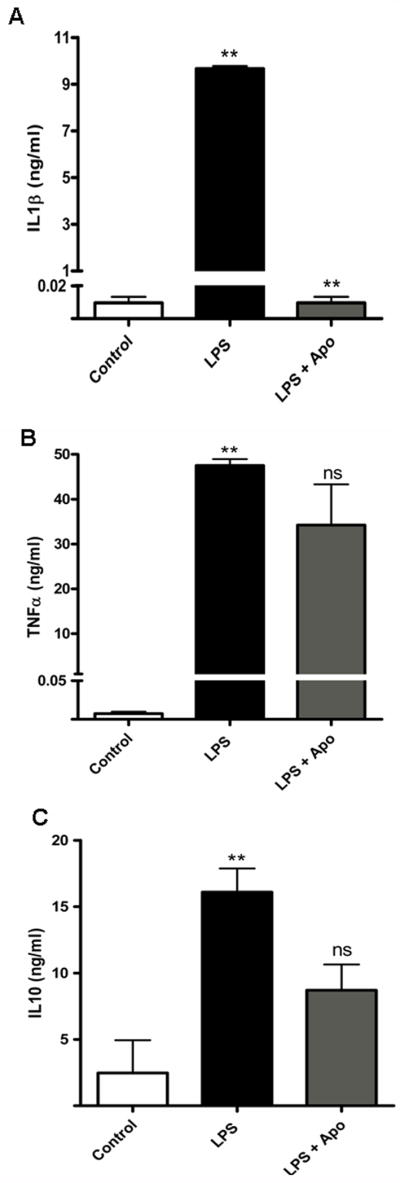
Supernatant cytokine levels were determined using a Luminex immunoassay system. LPS (100ng/ml, 24 h) treatment induced a significant increase in IL1β (A), TNFα (B) and IL-10 (C) production (** p<0.01) compared to control. Pretreatment with 100μM apocynin reduced cytokine release to different extents (** p<0.01, ns - not significant)
3.3 Intracellular ROS generation
Rapid intracellular ROS generation by the NADPH oxidase complex is a critical regulator of microglial activation since it controls other aspects of the microglial response, including proinflammatory gene expression, rapid proliferation and the dynamic morphology changes seen in activated microglia. We used the fluorescent probe DCFH-DA to determine the production of intracellular ROS (iROS) in the magnetically separated microglia in response to alpha synuclein, LPS, and TNFα, which are known to induce iROS generation (Wang et al., 2004; Zhang et al., 2005). We observed significant increases in levels of iROS production with each of the stimuli at 6 h, with TNFα showing the highest levels of iROS (Fig. 7A). Again, apocynin pretreatment significantly attenuated LPS-induced intracellular ROS production (Fig. 7B), which would be expected based on its known function as a NADPH oxidase inhibitor in immune cells including microglia (Peng et al., 2009). These results demonstrate that the magnetically separated microglia show the expected intracellular ROS responses upon activation by various relevant stimuli.
Fig. 7. Intracellular ROS generation in magnetically separated microglia.

iROS was determined using the DCFH-DA probe. Stimulation with aggregated alpha synuclein (200nM), LPS (100ng/ml) and TNFα (30ng/ml) for 6 h induced significant iROS generation (* p<0.05, ** p<0.01) compared to control (A). Pretreatment with 100μM apocynin (B) significantly blocked LPS-induced iROS generation at 12 h (** p<0.01 ).
3.4 Western blot analysis of magnetically separated microglia
One of the current methodological challenges in microglial research is getting an adequate number of cells for biochemical investigations by Western blot. To demonstrate the versatility of the magnetic separation method for biochemical studies, we performed Western blot analysis in the magnetically purified microglia by examining typical signaling events associated with microglial activation. We probed the Western blot for the changes in expression of the gp91phox subunit of the NADPH oxidase complex as well as the inducible nitric oxide synthase (iNOS) and Iba1, which are known to be upregulated upon microglial activation. In concordance with our nitric oxide and iROS data, we observed increased levels of iNOS and gp91phox protein levels in activated microglia as well as a significant induction of Iba1 (Fig. 8A,B). It is important to note that the number of microglial cells required for such an experiment can be obtained from as few as 6 postnatal pups, based on the estimated yields obtained with our column-free magnetic separation protocol.
Fig. 8. Western blot analysis of magnetically separated microglia.
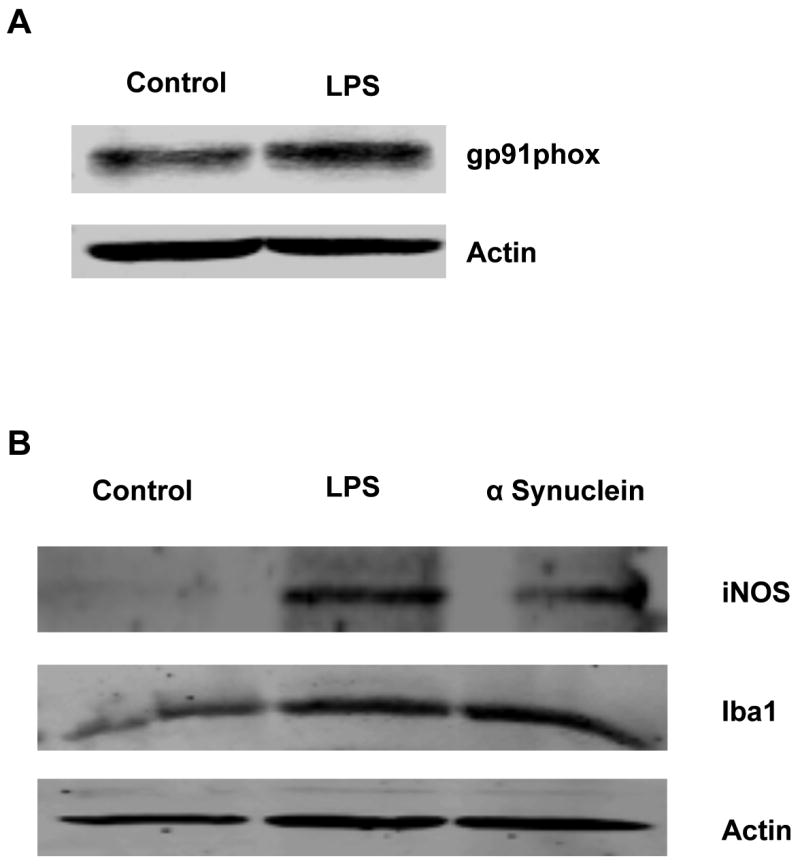
Whole cell lysates from magnetically separated microglia were probed for iNOS, iba1 and gp91 phox protein levels after treatment. LPS (100ng/ml, 24 h) increased gp91 phox protein levels (A). Both LPS and alpha Synuclein (200nM) also upregulated iNOS and iba1 protein levels in magnetically separated microglia stimulated for 24 h.
4. Discussion
We have developed a novel method to isolate primary microglia from postnatal mixed glial cultures by column-free magnetic separation technology based on tertrameric antibody complexes (TACS) and dextran-coated magnetic nanoparticles. The utility of our system lies in the high yield of microglia obtained (>3×10⁶ cells/mouse pup), with purity levels (>97%) comparable to those obtained with current methods. This procedure is simple, quick and reproducible, and requires no special columns or equipment other than the magnet obtained with the isolation kit.
A significant constraint of currently available methods for microglial isolation from postnatal mixed glial cultures has been the low yield obtained, which limits the type and number of studies that can be conducted. Particularly, experiments that require large amounts of cells as starting material such as RNA isolation for quantitative PCR, Western blot analysis, cell fractionation or proteomic studies cannot be routinely performed with primary microglia using current methods because of the unreasonable number of postnatal mouse pups that would be required. Our method can overcome these limitations by providing more microglial cells for various biochemical experiments.
The most commonly used differential adherence or plate shaker method yields, at best, less than 1 × 10⁶ microglia cells per mouse pup (Floden and Combs, 2007; Marek et al., 2008; Saura et al., 2003). The trypsinization method developed by Saura et al. yields on average 1.75 × 10⁶ microglial cells per mouse pup, which is comparable to that obtained recently by Marek et al. (1.6 ×10⁶ cells per neonatal brain) using column-based magnetic separation with CD11b microbeads (Floden and Combs, 2007; Marek et al., 2008; Saura et al., 2003). Our protocol using column-free magnetic separation with tetrameric antibody complexes yielded on average >3 × 10⁶ cells per mouse pup, with more than 85% recovery of the primary microglia from the mixed glial cultures. We believe that the increased yield of microglia obtained with our procedure is the result of optimized conditions that facilitate a high microglial cell density in the mixed glial cultures, as well as the efficient recovery of the microglia by employing tetrameric antibody complexes in the magnetic separation steps. Our pilot studies to optimize our method demonstrated that age of the mouse pups, the medium used for mixed glial cultures and the number of media changes were critical factors influencing the proportion of the microglial cells obtained with 14- to 16-day mixed glial cell cultures. We observed lower numbers of primary microglia and more astrocytes when DMEM was used instead of DMEM-F12, as suggested by other investigators (Saura, 2007). Consequently, lower yields of microglia were obtained with DMEM medium (supplementary figure 1). The precise reason for higher numbers of microglia in mixed glial cultures grown in DMEM-F12 is not known but is likely due to the additional supplements present in the F-12 fortified media being beneficial for microglial proliferation. We changed the mixed glial culture media only once at day 4 to 5 to allow for microglial growth factors produced by astrocytes such as colony stimulating factor-1 (CSF-1) to accumulate and promote microglial proliferation over the remaining culture period (Hao et al., 1990). As with all protocols for isolation of postnatal microglia, the age of the mouse pup is a crucial determinant of the final number of viable microglial cells obtained in mixed glial cultures (Giulian and Baker, 1986). The use of older mouse pups (P2 or later) usually results in significantly lower amounts of microglia in the mixed cultures and subsequently lower yields after magnetic separation. It is likely that the viability and proliferative capacity of microglia or their progenitor cells are considerably reduced in older mouse pups and could be the reason for the lower yields obtained. The yield and purity levels of primary microglia obtained by our method are high enough to provide sufficient numbers of cells for key experiments including qPCR analysis, Western blotting or proteomic studies which are otherwise problematic using conventional isolation protocols because of the inherently low yields obtained.
Functional validation of the microglial cells obtained by magnetic separation is crucial to demonstrate the feasibility of a new isolation technique. Therefore, we extensively tested the microglia obtained by magnetic separation using different functional assays, including cytokine production, nitric oxide release and intracellular ROS generation. The magnetically separated microglia show typical morphology changes associated with LPS stimulation and the expected increases in cytokine release, NO production and iROS generation. More importantly, the NADPH oxidase inhibitor apocynin effectively attenuated the LPS-induced cytokine release and ROS generation, demonstrating the utility of magnetically separated microglial cells for pharmacological studies. Aggregated alpha synuclein and TNFα treatments also increased intracellular ROS generation in these cells. The functional responses associated with microglial activation were also validated by Western blot analysis of the associated signaling proteins iNOS and gp91phox, which were induced during microglial activation along with Iba1. Collectively, these results demonstrate that the microglia obtained by our magnetic separation procedure retain their characteristics and function similarly to those isolated by conventional methods.
Isolation of microglia from adult mouse brain is a more representative model for understanding microglial function, particularly in neurodegenerative diseases where age is a critical factor. Indeed, some researchers have shown that adult brain microglia can react differently from those obtained from postnatal mice (Floden and Combs, 2006), while others have found only subtle differences (Moussaud and Draheim, 2010). However, because of the inherent difficulties in isolating microglia from the adult brain and the more complex protocols involved, adult brain microglia are still not as commonly used for ex vivo studies as postnatal microglial cultures. Given that adult brain microglia express high levels of the CD11b epitope, the column-free magnetic separation procedure outlined here should be adaptable for separating microglia from adult mouse brain cell suspensions, similar to protocols used with CD11b microbeads (de Haas et al., 2007). We are currently optimizing the tissue processing steps in an attempt to develop a method to isolate adult brain microglia with this system.
In summary, we have developed and optimized a simple column-free magnetic cell separation technique for high-yield isolation of primary microglia from postnatal mixed glial cultures. The higher number of microglial cells obtained by this method allows for studies requiring large amounts of microglia to be performed more frequently. It should also reduce the number of animals needed, since more experiments can be done with fewer mouse pups as starting material. Given the increased interest in understanding microglial function in CNS health and disease, this method could be of immense utility for researchers studying microglial cell biology.
Supplementary Material
The yield of primary microglia per mouse brain obtained by magnetic separation from mixed glial cultures grown in DMEM or DMEM-F12 was determined by automated cell counting. Significantly higher yields of microglia (* p<0.05) were obtained with DMEM-F12 medium.
Research highlights.
-
❖
Isolation of microglia with high yield & purity by column-free magnetic separation
-
❖
Optimal growth conditions enable a high microglia cell density in mixed cultures
-
❖
CD11b Tetrameric Antibody Complexes (TAC) provide precise labeling of microglia
-
❖
Dextran magnetic nanoparticles allows rapid separation of labeled microglia
-
❖
Isolated microglial cells are viable and fully functional
Acknowledgments
This study was supported by grants from the National Institutes of Health NS 065167 (AK) and ES 10586 (AGK). The W. Eugene and Linda Lloyd Endowed Chair to AGK is also acknowledged. The authors also acknowledge Ms. Mary Ann deVries for her assistance in the preparation of this manuscript.
Footnotes
Publisher's Disclaimer: This is a PDF file of an unedited manuscript that has been accepted for publication. As a service to our customers we are providing this early version of the manuscript. The manuscript will undergo copyediting, typesetting, and review of the resulting proof before it is published in its final citable form. Please note that during the production process errors may be discovered which could affect the content, and all legal disclaimers that apply to the journal pertain.
References
- Aarum J, Sandberg K, Haeberlein SL, Persson MA. Migration and differentiation of neural precursor cells can be directed by microglia. Proc Natl Acad Sci U S A. 2003;100:15983–8. doi: 10.1073/pnas.2237050100. [DOI] [PMC free article] [PubMed] [Google Scholar]
- Aschner M, Allen JW, Kimelberg HK, LoPachin RM. Glial cells in neurotoxicity development. Annu Rev Pharmacol Toxicol. 1999;39:151–73. doi: 10.1146/annurev.pharmtox.39.1.151. [DOI] [PubMed] [Google Scholar]
- Bedard K, Krause KH. The NOX family of ROS-generating NADPH oxidases: physiology and pathophysiology. Physiol Rev. 2007;87:245–313. doi: 10.1152/physrev.00044.2005. [DOI] [PubMed] [Google Scholar]
- Bessis A, Bechade C, Bernard D, Roumier A. Microglial control of neuronal death and synaptic properties. Glia. 2007;55:233–8. doi: 10.1002/glia.20459. [DOI] [PubMed] [Google Scholar]
- Block ML, Zecca L, Hong JS. Microglia-mediated neurotoxicity: uncovering the molecular mechanisms. Nat Rev Neurosci. 2007;8:57–69. doi: 10.1038/nrn2038. [DOI] [PubMed] [Google Scholar]
- de Haas AH, Boddeke HW, Brouwer N, Biber K. Optimized isolation enables ex vivo analysis of microglia from various central nervous system regions. Glia. 2007;55:1374–84. doi: 10.1002/glia.20554. [DOI] [PubMed] [Google Scholar]
- Floden AM, Combs CK. Beta-amyloid stimulates murine postnatal and adult microglia cultures in a unique manner. J Neurosci. 2006;26:4644–8. doi: 10.1523/JNEUROSCI.4822-05.2006. [DOI] [PMC free article] [PubMed] [Google Scholar]
- Floden AM, Combs CK. Microglia repetitively isolated from in vitro mixed glial cultures retain their initial phenotype. J Neurosci Methods. 2007;164:218–24. doi: 10.1016/j.jneumeth.2007.04.018. [DOI] [PMC free article] [PubMed] [Google Scholar]
- Giulian D, Baker TJ. Characterization of ameboid microglia isolated from developing mammalian brain. J Neurosci. 1986;6:2163–78. doi: 10.1523/JNEUROSCI.06-08-02163.1986. [DOI] [PMC free article] [PubMed] [Google Scholar]
- Glass CK, Saijo K, Winner B, Marchetto MC, Gage FH. Mechanisms underlying inflammation in neurodegeneration. Cell. 2010;140:918–34. doi: 10.1016/j.cell.2010.02.016. [DOI] [PMC free article] [PubMed] [Google Scholar]
- Glezer I, Simard AR, Rivest S. Neuroprotective role of the innate immune system by microglia. Neuroscience. 2007;147:867–83. doi: 10.1016/j.neuroscience.2007.02.055. [DOI] [PubMed] [Google Scholar]
- Grutzkau A, Radbruch A. Small but mighty: how the MACS-technology based on nanosized superparamagnetic particles has helped to analyze the immune system within the last 20 years. Cytometry A. 2010;77:643–7. doi: 10.1002/cyto.a.20918. [DOI] [PubMed] [Google Scholar]
- Hao C, Guilbert LJ, Fedoroff S. Production of colony-stimulating factor-1 (CSF-1) by mouse astroglia in vitro. Journal of neuroscience research. 1990;27:314–23. doi: 10.1002/jnr.490270310. [DOI] [PubMed] [Google Scholar]
- Lehnardt S, Massillon L, Follett P, Jensen FE, Ratan R, Rosenberg PA, Volpe JJ, Vartanian T. Activation of innate immunity in the CNS triggers neurodegeneration through a Toll-like receptor 4-dependent pathway. Proc Natl Acad Sci U S A. 2003;100:8514–9. doi: 10.1073/pnas.1432609100. [DOI] [PMC free article] [PubMed] [Google Scholar]
- Marek R, Caruso M, Rostami A, Grinspan JB, Das Sarma J. Magnetic cell sorting: a fast and effective method of concurrent isolation of high purity viable astrocytes and microglia from neonatal mouse brain tissue. J Neurosci Methods. 2008;175:108–18. doi: 10.1016/j.jneumeth.2008.08.016. [DOI] [PubMed] [Google Scholar]
- Marin-Teva JL, Dusart I, Colin C, Gervais A, van Rooijen N, Mallat M. Microglia promote the death of developing Purkinje cells. Neuron. 2004;41:535–47. doi: 10.1016/s0896-6273(04)00069-8. [DOI] [PubMed] [Google Scholar]
- Moussaud S, Draheim HJ. A new method to isolate microglia from adult mice and culture them for an extended period of time. J Neurosci Methods. 2010;187:243–53. doi: 10.1016/j.jneumeth.2010.01.017. [DOI] [PubMed] [Google Scholar]
- Peng J, Stevenson FF, Oo ML, Andersen JK. Iron-enhanced paraquat-mediated dopaminergic cell death due to increased oxidative stress as a consequence of microglial activation. Free Radic Biol Med. 2009;46:312–20. doi: 10.1016/j.freeradbiomed.2008.10.045. [DOI] [PMC free article] [PubMed] [Google Scholar]
- Qian L, Tan KS, Wei SJ, Wu HM, Xu Z, Wilson B, Lu RB, Hong JS, Flood PM. Microglia-mediated neurotoxicity is inhibited by morphine through an opioid receptor-independent reduction of NADPH oxidase activity. J Immunol. 2007;179:1198–209. doi: 10.4049/jimmunol.179.2.1198. [DOI] [PubMed] [Google Scholar]
- Saura J. Microglial cells in astroglial cultures: a cautionary note. J Neuroinflammation. 2007;4:26. doi: 10.1186/1742-2094-4-26. [DOI] [PMC free article] [PubMed] [Google Scholar]
- Saura J, Tusell JM, Serratosa J. High-yield isolation of murine microglia by mild trypsinization. Glia. 2003;44:183–9. doi: 10.1002/glia.10274. [DOI] [PubMed] [Google Scholar]
- Stefanska J, Pawliczak R. Apocynin: molecular aptitudes. Mediators Inflamm. 2008;2008:106507. doi: 10.1155/2008/106507. [DOI] [PMC free article] [PubMed] [Google Scholar]
- Streit WJ. Microglia as neuroprotective, immunocompetent cells of the CNS. Glia. 2002;40:133–9. doi: 10.1002/glia.10154. [DOI] [PubMed] [Google Scholar]
- Vejrazka M, Micek R, Stipek S. Apocynin inhibits NADPH oxidase in phagocytes but stimulates ROS production in non-phagocytic cells. Biochim Biophys Acta. 2005;1722:143–7. doi: 10.1016/j.bbagen.2004.12.008. [DOI] [PubMed] [Google Scholar]
- Vignali DA. Multiplexed particle-based flow cytometric assays. J Immunol Methods. 2000;243:243–55. doi: 10.1016/s0022-1759(00)00238-6. [DOI] [PubMed] [Google Scholar]
- Walton NM, Sutter BM, Laywell ED, Levkoff LH, Kearns SM, Marshall GP, 2nd, Scheffler B, Steindler DA. Microglia instruct subventricular zone neurogenesis. Glia. 2006;54:815–25. doi: 10.1002/glia.20419. [DOI] [PubMed] [Google Scholar]
- Wang T, Qin L, Liu B, Liu Y, Wilson B, Eling TE, Langenbach R, Taniura S, Hong JS. Role of reactive oxygen species in LPS-induced production of prostaglandin E2 in microglia. J Neurochem. 2004;88:939–47. doi: 10.1046/j.1471-4159.2003.02242.x. [DOI] [PubMed] [Google Scholar]
- Zhang W, Wang T, Pei Z, Miller DS, Wu X, Block ML, Wilson B, Zhang W, Zhou Y, Hong JS, Zhang J. Aggregated alpha-synuclein activates microglia: a process leading to disease progression in Parkinson’s disease. Faseb J. 2005;19:533–42. doi: 10.1096/fj.04-2751com. [DOI] [PubMed] [Google Scholar]
Associated Data
This section collects any data citations, data availability statements, or supplementary materials included in this article.
Supplementary Materials
The yield of primary microglia per mouse brain obtained by magnetic separation from mixed glial cultures grown in DMEM or DMEM-F12 was determined by automated cell counting. Significantly higher yields of microglia (* p<0.05) were obtained with DMEM-F12 medium.