Abstract
Accurate focusing is a critical challenge of whole slide imaging, primarily due to inherent tissue topography variability. Traditional line scanning and tile-based scanning systems are limited in their ability to acquire a high degree of focus points while still maintaining high throughput. This review examines limitations with first-generation whole slide scanning systems and explores a novel approach that employs continuous autofocus, referred to as independent dual sensor scanning. This “second-generation” concept decouples image acquisition from focusing, allowing for rapid scanning while maintaining continuous accurate focus. The technical concepts, merits, and limitations of this method are explained and compared to that of a traditional whole slide scanning system.
Keywords: Autofocus, digital pathology, whole slide imaging
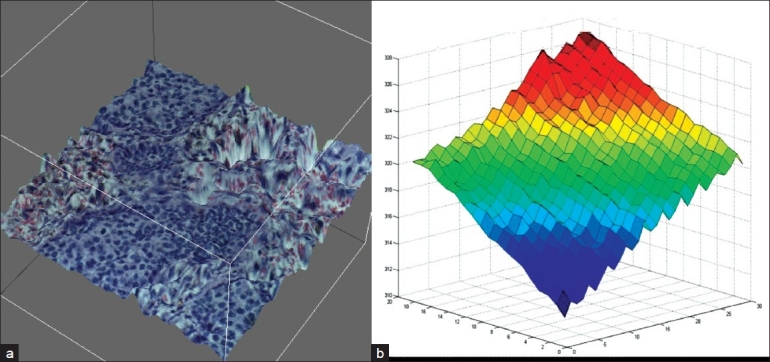
Whole slide imaging requires the acquisition of multiple high resolution images that are subsequently aligned or stitched together to create a complete and seamless representation of the original whole tissue section. A fundamental challenge with whole slide imaging has been the ability to produce a high quality, in focus image at fast speeds. To produce an in focus image it is necessary to “track” the topography variations (z-dimension variation) that inherently exist in solid tissue samples. Topography variation can range from nanometers to several microns over a single millimeter (approximately a single field of view, or FoV) in the x or y direction. Figure 1 illustrates the variation of tissue topography in the z-dimension that exists in a typical 5-μm thick tissue section. Standard microscopes allow the user to compensate for these variations by using the fine focus knobs in real time during viewing. However, such variation in topography can present dramatic challenges for whole slide imaging systems which attempt to frequently adjust focus automatically to compensate.
Figure 1.

Tissue topography. (a) Topographical map of a typical FoV from a 5 μm thick tissue section illustrating variations in the z-plane of best focus. Multiple z-planes were acquired and composited to reconstruct the topography. (b) Graphical representation of z-dimension variations per FoV across a whole slide image. Each acquired FoV was stitched together to show the variation that occurs from tile to tile in the z-dimension. A single tile can vary over 1μm in the z-dimension from a neighboring tile. Stage tilt is easily observed (red to blue) which further contributes to variations in the z-dimension across a whole tissue section.
AUTOFOCUS METHODS
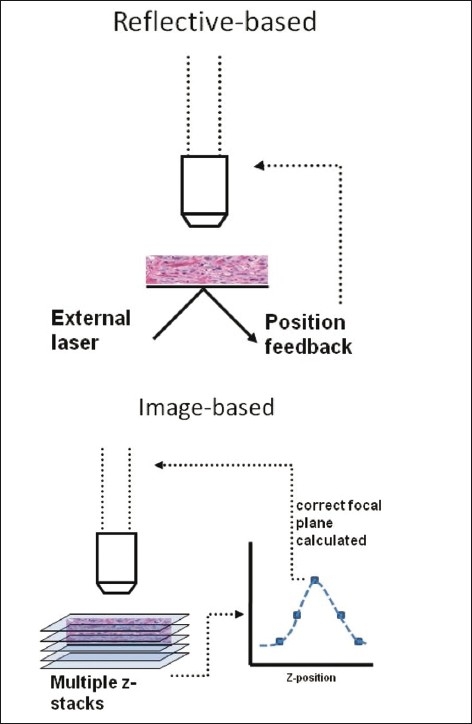
There are two main types of autofocus methods: (1) reflective based and (2) image based [Figure 2].[1] The most common form of reflective-based autofocus is a laser-based method based on tracking the angle of reflectance of a laser over a surface. This creates a single reference point to keep the objective at a constant distance from the sample. Although this can work for biological samples that are a fixed distance off the surface, it does not work well when a sample varies its location from the surface. This is because focus is maintained at a constant distance above the reference surface (i.e., glass slide) and therefore, cannot track the tissue topography variations above the glass.
Figure 2.

Reflective vs. image-based autofocus schemes. Reflective-based approaches set focus a fixed distance above the reference surface (glass slide surface). Image-based approaches sample images at several different z-planes and apply a figure of merit calculation to determine the optimal focal plane
In contrast to laser autofocusing, image-based autofocusing tracks the topography of tissue directly and not the surface of a glass slide, creating a more accurately focused image. This method requires multiple image stacks or planes be acquired in the z-dimension to calculate which focal distance is ideal.[2] A calculation based on the best z-dimension location, otherwise known as a figure of merit, is generated to select the ideal plane. Although this method is accurate, it has traditionally been slow and requires more time to acquire multiple images at each tile or frame.
DEPTH OF FIELD IMPACTS FOCUS
High numerical aperture (NA) objectives are typically used for standard microscopes and whole slide imaging systems because they allow for the highest resolving power. However, high NA lenses can exacerbate topography issues because they necessarily have a low depth of field (the z-range in which the focal plane exists). Although moving to lower NA objectives may help with topography issues by increasing the depth of field, this fix comes with a trade-off of lower resolution. Thus, automated microscopes are forced to compensate for focus variations in other ways.
AUTOFOCUS: THE SPEED VS. QUALITY TRADE-OFFS
The image quality of a whole slide image is dictated by several contributing factors including the quality of optics and illumination uniformity, camera/sensor specifications, and methods for autofocusing. Of these factors, autofocusing issues are the most challenging to overcome and have been cited as the culprit for poor image quality.[3] This is not because autofocusing per se is complex, but rather because of the desire to perform autofocus in as short a period of time as possible.
TILING AND LINE SCANNING
There are two main types of image sensors which dictate the two main acquisition methods to generate whole slide images of anatomic pathology samples, namely (a) line scanners and (b) traditional tile scanning systems.[4] Both methods are capable of adjusting focal planes on each acquired tile or line. This is done by moving the objective lens into correct position or moving the stage in the z-direction. Ideally, any imaging system will perform image-based auto focusing on every tile in a whole slide image. If this could be done, the focus quality of the image will be high. However, as indicated above, this can take a significant amount of time. The time penalty is a result of the time required for deceleration, acceleration, settling, and acquisition times at each tile. Further, acquisition time can vary based on the camera sensor size, stage speeds, light pulse speed, frame read out, etc. Assuming a rate of 100 ms (10 frames per second) to acquire a single frame, surveying focus for each tile at five different focal distances per tile would add an additional 0.5 s per tile. Thus, an image with 500 tiles (approximate for 20×) can take as much as 300 hundred seconds to acquire, not including overhead for moving the slide into position and acquiring bar codes. This summarizes the historical challenges in generating high-quality images in 1 min.
FOCUS MAPS AND SKIPPING TILES FOR SPEED
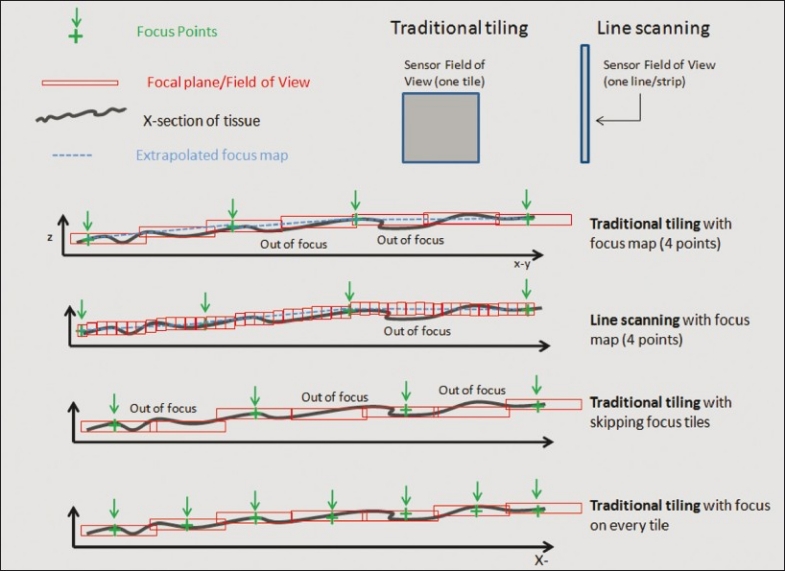
Clearly, focusing on every tile is time consuming. Thus, to alleviate the time burden, line scanners and traditional tiling systems will either create a “focus map” prior to scanning, or survey focus points every n tiles or lines, in effect skipping areas to save time. Focus maps require a detailed survey of focus at different points on the tissue. Then each ideal focus point is triangulated to re-create a theoretical map of the surface of the tissue, in effect filling in the blanks. Delaunay triangulation is a typical method for focus mapping and has also been used for other medical imaging applications. Line scanners perform better than traditional tiling approaches using focus maps because line scanners can change focus throughout their field of view (i.e., at shorter intervals) [Figure 3].[5] An alternative approach for tiling systems is to skip every three or four tiles in which to focus in order to preserve speed. The assumption with skipping tiles is that a neighboring FoV will have nearly the same z-position as its other neighbors. However, this is not true and two adjacent tiles can vary by more than 1 μm in the z-plane [Figure 1]. Nonetheless, a focus map or skipping tiles allows the system to be in continuous motion while scanning, at the expense of not surveying each and every tile/line during scanning for the perfect focal point. Many scanning systems will let the user select the number of focus points used to create a map. More focus points will naturally increase the accuracy of the overall focus quality. Yet more focus comes only at the expense of decreasing speed, since it necessarily takes time to survey more focus points.
Figure 3.

Image-based auto-focusing approaches. A section of tissue with green cross hairs representing the focus points used to calculate a focus map. The blue dotted line (focus map) is the calculated focal plane interpolated between focus points. Red boxes are the focal plane for each field of view and each one can be adjusted in the z-position during a scan. Line scanners have more ability to adjust the z-depth during scanning. Both line and tile scanners can incorrectly predict focus between focus points. Focusing on every tile increases chances of having correct focus throughout the scan
A NEW CONCEPT: INDEPENDENT DUAL SENSOR SCANNING
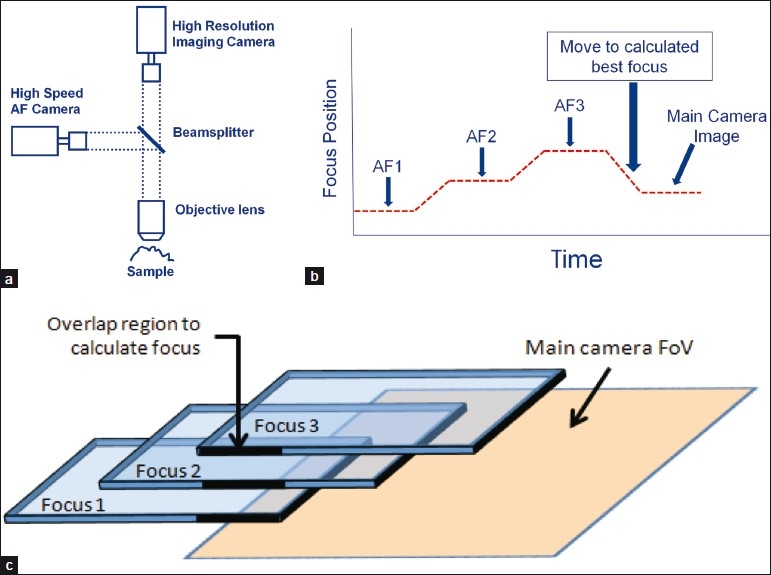
Line scanning and traditional tiling systems use a single sensor (or a combined three sensors for 3CCD devices) to both survey focus and acquire the image. It is important to realize that during acquisition there is a certain amount of “dead time” while the camera is reading out an image to memory. During this time, the acquisition camera cannot be used to survey focus. In a continuous scanning system, this leads to gaps in focus sampling or it necessitates a slower speed to literally stop during read out. A better approach that provides a quality and speed advantage is to use an additional sensor that is independent of the first which can survey focus in parallel [Figure 4a]. In this concept, one camera acquires the high resolution image and the other simultaneously surveys focus. It is also important to try to minimize the number of focus points surveyed while still generating enough data to calculate an accurate focal plane. It has been demonstrated that as few as three focal planes can yield a highly accurate focus measurement.[5] In this system, the stage is in continuous motion. Motion blur is eliminated by using very short pulses of light during imaging. Three autofocus images are acquired by the focus camera, each at a slightly different focal plane. Using this information, the system calculates an optimal focus position and moves to that focal plane, where the main camera takes its high resolution image. While the main camera is reading out, the process is repeated, with autofocus images being acquired ahead of the next tile to predict its optimal focal plane [Figure 4b]. In this concept, the focus camera operates independently, in parallel, and at a much faster frame rate than the acquisition camera to ensure a survey of multiple image planes during the same time that the main camera is reading out. As the stage is in continuous motion throughout this process, the three focus images only share a small region of overlap. Only this region is used to calculate the correct focal plane [Figure 4c].
Figure 4.

Predictive auto-focusing in IDS scanning. (a) An IDS scanning system consists of a two cameras, one of which is a high speed autofocus (AF) camera and the other of which is a high resolution imaging camera. A single optical path from the sample is split into two cameras by a beam splitter. (b) The focus sensor acquires three images in different z-planes. The system calculates the optimal focus position. Once positioned there, the main imaging camera takes a high resolution image of the sample. While the main imaging camera is reading out, the process is repeated. (c) Because the system is in continuous motion, the three AF images only have a small region of overlap. The system uses the overlapping region to calculate the best focal plane
Unlike traditional tiling or line scanning, IDS scanning technology is capable of surveying focus on every field of view, or tile. This equates to thousands of survey focus points as opposed to 10 or 20 for other systems that do focus mapping. IDS scanning technology is similar to a pathologist surveying the entire tissue under the microscope in focus at 20× or 40×. The clear advantage to surveying such a large number of focus points is the ability to track the true nature of tissue topography more accurately and select an optimal z-position [Figure 3].
In theory, this method is likely to result in fewer focus faults and thus better image quality. However, such a method requires precise timing and a highly accurate mechanical system. A recent study demonstrates that this method is feasible and can generate high quality images.[6] The study compared the gold standard “stop motion” imaging (which stops at each tile and performs a 50 z-plane focus calculation), to continuous IDS scanning. The two methods showed little variance in the z-position at each tile, indicting IDS imaging is highly accurate compared to the ground truth.
Another major advantage to IDS scanning is speed of acquisition. Since the acquisition camera does not need to wait at any time for focusing, the whole scan can occur more quickly. Although saving tens or hundreds of milliseconds from a single tile may seem to be a small advantage, it adds up to significant time when one considers that a standard 15 × 15 mm image at 20× contains 600 tiles and at 40× contains 2400 tiles. Thus, it is possible to perform rapid scanning while still taking orders of magnitude more focus points.
It is also important to realize that the IDS scanning does not require user intervention to set focus points for pre-focus mapping. This eliminates a labor intensive step during scanning and allows for scans to be more standardized by eliminating variability in focus point selections.
TIME IS MONEY: TIME TO FIRST IMAGE VERSUS TOTAL THROUGHPUT
“Scan speed” is a term that has different meanings to different users and it is important to define this term. The industry has unofficially settled on a 15 mm × 15 mm area and a 20× magnification as the standard size and magnification to measure speed. Time to first image is the total time between loading a single slide and when that slide is available for viewing by the pathologist at high resolution. Time to first image includes any post-acquisition steps (color balance, sharpening, compression, transmission, etc.) that need to occur prior to image viewing. The time to first image value does not have huge significance for routine anatomic pathology, save for the single slide frozen section where seconds indeed count. If digital pathology is thought of as a general laboratory device for routine samples, then the time to first image is less relevant. However, the over-all throughput speed is very relevant.
When imaging a multiplicity of slides, the steps involved in post-acquisition of one slide can occur in parallel to acquiring the image from subsequent slides. Thus, the total throughput should be faster than the time to first image. As an example, if 10 slides are imaged and it takes 60 s to acquire an image and 30 s to compress and transmit, the total time to first image is 90 s. However, all 10 slides should take approximately 11 min (first slide is 90 s; the next nine are run through at 60 s with parallel computing). Thus, the overall throughput for 10 slides is close to 60 s per slide.
The difference between 90 and 60 s may seem like splitting hairs, but it is the throughput value that can have significant cost impact on a laboratory that is implementing digital imaging solutions. For example, a laboratory that plans to run 1000 slides per day (equates to nearly 500,000 slides per year) will require two scanners at 60 s per slide throughput. For every 30 s more per slide, the lab will require an additional scanner. Thus, at a 90 s throughput, that lab needs three scanners, and at 120 s per slide the lab needs four scanners…and so on.
CONCLUSION
In summary, accurate focusing is a critical challenge of whole slide imaging, primarily due to inherent tissue topography variability. Traditional line scanning and tiling scanning systems are limited in their ability to acquire a high degree of focus points continuously while still maintaining high throughput. A novel approach, referred to as independent dual sensor scanning, decouples image acquisition from focusing and allows for parallel processing resulting in rapid scanning while focusing within each tile of the whole slide image and generating higher quality images. Continuous real-time autofocusing is likely to be an important step forward in digital pathology.
Footnotes
Available FREE in open access from: http://www.jpathinformatics.org/text.asp?2011/2/1/44/86282
REFERENCES
- 1.Firestone L, Cook K, Culp K, Talsania N, Preston K., Jr Comparison of autofocus methods for automated microscopy. Cytometry. 2004;12:195–206. doi: 10.1002/cyto.990120302. [DOI] [PubMed] [Google Scholar]
- 2.Sun Y, Duthaler S, Nelson BJ. Autofocusing in computer microscopy: Selecting the optimal focus algorithm. Micros Res Tech. 2004;65:139–49. doi: 10.1002/jemt.20118. [DOI] [PubMed] [Google Scholar]
- 3.Gilbertson JR, Ho J, Anthony L, Jukic DM, Yagi Y, Parwani AV. Primary histologic diagnosis using automated whole slide imaging: A validation study. BMC Clin Pathol. 2006;6:1–19. doi: 10.1186/1472-6890-6-4. [DOI] [PMC free article] [PubMed] [Google Scholar]
- 4.Rojo MG, García GB, Mateos CP, García JG, Vicente MC. Critical comparison of 31 commercially available digital slide systems in pathology. Int J Surg Pathol. 2006;14:285–305. doi: 10.1177/1066896906292274. [DOI] [PubMed] [Google Scholar]
- 5.Yazdanfar S, Kenny KB, Tasimi K, Corwin AD, Dixon EL, Filkins RJ. Simple and robust image-based autofocusing for digital microscopy. Opt Express. 2008;16:8670–7. doi: 10.1364/oe.16.008670. [DOI] [PubMed] [Google Scholar]
- 6.McKay RR, Baxi VA, Montalto MC. The accuracy of dynamic predictive autofocusing for whole slide imaging. J Pathol Inform. 2011;2:38–42. doi: 10.4103/2153-3539.84231. [DOI] [PMC free article] [PubMed] [Google Scholar]


