

Abstract
The incompleteness of proteome structure and function annotation is a critical problem for biologists and, in particular, severely limits interpretation of high-throughput and next-generation experiments. We have developed a proteome annotation pipeline based on structure prediction, where function and structure annotations are generated using an integration of sequence comparison, fold recognition, and grid-computing-enabled de novo structure prediction. We predict protein domain boundaries and three-dimensional (3D) structures for protein domains from 94 genomes (including human, Arabidopsis, rice, mouse, fly, yeast, Escherichia coli, and worm). De novo structure predictions were distributed on a grid of more than 1.5 million CPUs worldwide (World Community Grid). We generated significant numbers of new confident fold annotations (9% of domains that are otherwise unannotated in these genomes). We demonstrate that predicted structures can be combined with annotations from the Gene Ontology database to predict new and more specific molecular functions.
Annotation of protein structure and function is a fundamental challenge in biology. Accurate structure annotations give researchers a three-dimensional (3D) view of protein function at the molecular level that enables specific point-mutation analysis or the design of custom inhibitors to disrupt function. Accurate function annotations give researchers specific testable hypotheses about the role a protein plays in the cell and also allow biologists to better interpret the role of uncharacterized genes from high-throughput experiments (e.g., mass spectrometry co-IP, yeast two-hybrid screens, microarray, RNAi screens, or forward-genetic screens). Unfortunately, experimental annotation efforts fail to cover large portions of all proteomes and are often focused on model organisms. Current computational function prediction methods can extend coverage to any sequenced genome (i.e., non-model organisms) but can only annotate proteins that have high sequence similarity to well-characterized proteins. Motivated by the observation that structure is more conserved than sequence (Chothia and Lesk 1986), our method extends function annotation coverage to many unannotated protein domains by comparing computationally predicted structures to well-characterized proteins with known structures.
Current computational protein annotation methods can be broadly grouped into four categories: (1) Primary sequence-feature annotation methods predict general features of a protein such as disorder content (DISOPRED) (Jones and Ward 2003), secondary structure (PSIPRED) (Jones 1999), transmembrane helices (TMHMM) (Krogh et al. 2001), coiled-coils (COILS) (Lupas et al. 1991), or signal peptides (SignalP) (Bendtsen et al. 2004) and can be efficiently applied to full proteomes but have limited ability to describe the specific function of individual proteins in a cellular context. (2) Sequence comparison methods (e.g., BLAST) (Altschul et al. 1997) including methods and databases that organize proteins into families (CATH [Orengo et al. 1997], SCOP [Murzin et al. 1995], Pfam [Finn et al. 2008]) and fold recognition methods (FFAS) (Jaroszewski et al. 2005), can generate putative function annotations (for a complete review, see Lee et al. 2007) but are limited in their application to the set of proteins with sequence detectable homologs or significant sequence matches. (3) Several groups have used machine learning techniques to integrate high-throughput experimental data, such as gene expression and protein–protein interactions, to predict protein function (Marcotte et al. 1999; Bader and Hogue 2002; Hazbun et al. 2003; Troyanskaya et al. 2003; Lee et al. 2004; Pena-Castillo et al. 2008), but these data sets are not generally available for all organisms and therefore limit these methods' coverage. (4) Several studies have shown that protein structures derived from either large-scale protein experimental determination (Matthews 2007; Dessailly et al. 2009) or large-scale protein prediction (homology modeling, fold recognition, and de novo) significantly increased the annotation coverage of proteomes and often provided site-specific information such as probable functional sites and surfaces (Bonneau et al. 2004; Ginalski et al. 2004; Malmström et al. 2007; Pieper et al. 2009; Zhang et al. 2009). Homology modeling is increasingly productive as more structures are solved, however, many proteins and protein domains lack detectable homologous proteins in the Protein Data Bank (PDB) (Marsden et al. 2007). De novo structure prediction methods do not require sequence homology with known structures and can, in principle, provide annotation coverage to proteins unreachable by homology modeling. Unfortunately, de novo prediction methods require vast computational resources, and because of this, published pipelines that include de novo structure prediction are incapable of keeping pace with incoming genomic data.
This study focuses on this fourth type of annotation method via structure prediction. Here we describe the proteome folding pipeline (PFP), a protein-domain-level fold and function annotation method that combines de novo (Rosetta) (Rohl et al. 2004), fold recognition, and sequence-based structure assignment methods into a single pipeline that significantly extends functional and structural proteome annotation coverage for 94 complete genomes (as well as several new protein families from recent metagenomics studies). The computational cost of performing de novo structure prediction was distributed on a grid of more than 1.5 million CPUs worldwide (World Community Grid; http://www.wcgrid.org). De novo structures and sequence-based comparisons were used to assign predicted protein domains into the Structural Classification of Proteins (SCOP), a hierarchical classification of protein 3D structure (Murzin et al. 1995). We demonstrate our ability to integrate these predicted SCOP classifications with information from the Gene Ontology (GO) database (Ashburner et al. 2000) to predict molecular functions, which increases the completeness, accuracy, and specificity of protein domain annotations. We developed confidence levels and error models for de novo and SCOP classification methods based on a double-blind benchmark of our own construction containing 875 recently solved proteins and characterized the error and yield associated with each product of our pipeline (domains, structure, and function). We provide three interfaces to our database: a Cytoscape (Shannon et al. 2003) network interface that highlights novel structure and function predictions in the context of protein interaction networks (Avila-Campillo et al. 2007); a web interface that allows users to search for specific genes of interest, http://www.yeastrc.org/pdr/ (Riffle et al. 2005); and a BLAST interface that allows searches using individual sequences (http://pfp.bio.nyu.edu/blast/index).
Results
Proteome folding pipeline applied to 94 genomes
We have applied our pipeline to more than 389,000 proteins from 94 genomes (Fig. 1 describes the full pipeline using a hypothetical protein from Lactobacillus prophage; Supplemental Table S1 details the full set of genomes analyzed). First, the domain prediction protocol Ginzu (Chivian et al. 2003, 2005) uses primary sequence-based annotation methods to predict secondary structure (PSIPRED) (Jones 1999), disordered regions (DISOPRED) (Jones and Ward 2003), signal sequences (SignalP) (Bendtsen et al. 2004), coiled-coils (COILS) (Lupas et al. 1991), and transmembrane regions (TMHMM) (Krogh et al. 2001). PSI-BLAST (Altschul et al. 1997) is then used to identify structures in the PDB with high sequence similarity to regions of the query protein, referred to as “PDB-BLAST hits.” At this stage, more than 314,000 domains from the set of input proteins were identified.
Figure 1.

Flow diagram of the proteome folding pipeline using Lactobacillus prophage hypothetical protein Ljo_0324 as an example. (A) The Ljo_0324 sequence is first annotated with primary and secondary structure (PSIPRED, DISOPRED, and [not shown] TMHMM, COILS, and SignalP). (B) PDB-BLAST (PSI-BLAST) and fold recognition (FFAS03) are then used to compare the input sequence to the PDB database to identify a similar sequence/structure. (C) Regions of the protein sequence still unannotated are processed by Pfam, multiple sequence alignments (MSA), and a heuristic method for domain identification. (D) Domains <150 amino acids are then sent to the computational grid, where the three-dimensional structure is predicted by Rosetta. (E) Finally, domains with structural annotations (de novo, BLAST, or fold recognition) are classified into SCOP superfamilies. Regions annotated in each level of the figure are outlined in black, and regions annotated in previous levels are outlined in dotted lines. This example can be found online at http://www.yeastrc.org/pdr/viewProtein.do?id=2155068.
Next, we use the fold recognition algorithm FFAS03 (Jaroszewski et al. 2005) to match more evolutionarily distant sequences in the PDB, producing an additional 58,000 domains with significant matches to domains in the PDB. We then use additional methods, including identifying Pfam domains (Finn et al. 2008), an algorithm for predicting domains from multiple sequence alignments (MSA), and a heuristic-based algorithm for delineating domain boundaries to identify additional putative domains (Chivian et al. 2003, 2005). These methods combined to identify an additional 325,000 domains. In total, our domain prediction produced nearly 700,000 domains for the 389,000 query proteins, which serve as the basis for our domain centric annotation of these proteins. We then used the Rosetta de novo protocol (Rohl et al. 2004) to predict the 3D structure of those domains lacking structure annotation (i.e., Pfam, MSA, and heuristic domains) and that are less than 150 residues in length. We predicted de novo folds for 57,000 domains on IBM's World Community Grid (requiring more than 100,000 yr of CPU time, resulting in one of the largest repository of protein structure predictions publicly available). The final step in the pipeline classifies predicted protein domains into structural superfamilies (SCOP). PDB-BLAST and FFAS03 domains are assigned the superfamily of the PDB structure to which they matched, while a logistic regression model is used to classify de novo structures into SCOP superfamilies based on the Rosetta predictions and estimated error associated with these structure predictions (Malmström et al. 2007). In all, our pipeline classified more than 250,000 domains into SCOP superfamilies of which nearly 43,000 are considered both confident (based on our benchmarks) and novel (FFAS03 and de novo).
Domain prediction
As described above, we first produced protein domain predictions for each protein in the 94 genomes processed. The domain prediction program Ginzu allows us to hierarchically organize all structure prediction methods, ensuring that each domain has a structure annotation or prediction derived from the most accurate and most computationally efficient method possible. Supplemental Figure S1 shows the domain types assigned by our pipeline for several representative organisms. PDB-BLAST and FFAS03 annotate an average of 47% and 9%, respectively, of all proteomes (Supplemental Fig. S1) and together assign a structure to 51% of eukaryotic domain sequences, agreeing very closely with previous efforts (Marsden et al. 2007). Our predictions for the human proteome have a slightly higher coverage of domain sequences, by these two methods (62%), while many pathogenic eukaryotic organisms are sparsely annotated and are observed to have lower PDB-BLAST and FFAS03 coverage, for example, Trypanosoma cruzi (41%) and Plasmodium vivax (37%). Domain coverage across all 94 genomes (Supplemental Fig. S1; Supplemental Table S1) confirms that our analysis provides broad coverage of structure annotations even before de novo methods are applied and that our strategy for predicting domain boundaries is extensible to a wide variety of organisms. Additionally, our pipeline produced 29,000 Pfam, 105,000 MSA, and 190,000 heuristic domains totaling 324,000 predicted protein domains annotated by these three methods (which do not assign structures to domains). It is important to note that in our pipeline, Pfam annotates a smaller-than-expected number of domains because a large number of domains are removed from consideration by PDB-BLAST and FFAS before Pfam is applied. This is consistent with our effort throughout the pipeline to first assign a high-confident structure to individual domains before proceeding to lower-confidence structure methods (i.e., de novo).
De novo structure prediction and SCOP superfamily classification of structure predictions
We used the Rosetta de novo protocol to predict 3D models for domains not annotated by PDB-BLAST and FFAS. Resulting structure predictions were then used to predict SCOP superfamilies for each domain. Rosetta is a de novo protein structure prediction algorithm that uses fragments of proteins from the PDB to generate local structure during a Monte Carlo optimization that then produces ensembles of low-energy protein conformations. The Rosetta de novo protocol does not require homology with a solved structure in the PDB and is thus theoretically applicable to all protein domains. In practice, however, the algorithm does not scale to protein domains larger than 150 residues (roughly half of protein domains are too large for Rosetta). Rosetta de novo has been very successful in CASP competitions and often predicts structures for protein domains lacking detectable homology with known structures to within 5 Å RMSD of the native structure or better (Bradley et al. 2005). Structure fragment libraries are produced by comparing the sequence and secondary structure (predicted using PSIPRED) of three- and nine-amino-acid windows of query sequences to a non-redundant set of PDB entries. Because of the computational cost of running Rosetta on the genome-wide scale, we initiated the Human Proteome Folding Project in collaboration with IBM's World Community Grid (WCGrid). WCGrid makes use of idle CPU time on volunteered personal computers around the world to form a very large virtual supercomputer. As of September 25, 2010, there are more than a half million volunteers and nearly 1.6 million devices capable of running Rosetta on WCGrid. Fragment libraries and query sequences were submitted to WCGrid where the Rosetta de novo protocol was executed resulting in structure predictions for 57,000 domains between 40 and 150 residues in length (see Methods). The resulting ensemble of structures predicted for each domain was clustered using root mean squared distance (RMSD), and five of the top de novo predictions (cluster centers) are publicly provided through our web interface, where they can be viewed directly in a web browser or downloaded for further analysis.
We have used our de novo structure predictions to predict the SCOP superfamily for each predicted domain generated as described above. The SCOP database describes structural and evolutionary relationships of proteins with known structure (the CATH database would also have functioned as an appropriate fold ontology for this study). SCOP organizes protein structure by a set of hierarchical classes, folds, superfamilies, and families. We make predictions at the SCOP superfamily level (e.g., a.4.5, “winged helix” DNA-binding domain) because proteins within the same superfamily have high structural similarity and often share functional features.
For each protein domain, top-ranked Rosetta predictions were compared to a representative set of known structures, which are classified in SCOP. Structure comparisons were made with MAMMOTH (Ortiz et al. 2002), which returns the statistical significance (Z-score) of the best gapped alignment between two protein structures. A logistic regression model was then used to estimate the probability (MAMMOTH confidence metric, MCM score) (Malmström et al. 2007) of each protein domain belonging to a SCOP superfamily. The regression model's parameters consist of MAMMOTH Z-score, Rosetta convergence score, contact order of the predicted structure, and a sequence length ratio between the SCOP superfamily representative and the protein domain sequence. We demonstrate, below and in previous work (Malmström et al. 2007), that our MCM score separates true predictions from incorrect conformations and allows us to classify proteins for which no valid predictions were generated by other methods.
Table 1 shows the number of SCOP classifications that were made for all protein domains processed by our pipeline. More than 57,000 domains were de novo folded and classified into a SCOP superfamily, of which 12,500 (21.8%) are considered medium confident (MCM score ≥ 0.8, about two out of three correct; see the next section) and 4500 (7.9%) are considered high confidence (MCM score ≥ 0.9, about four out of five correct; see the next section). In addition, we also assigned SCOP superfamilies based on sequence similarity for domains identified by PDB-BLAST and FFAS03, which were annotated using the alignment to the matching PDB entry's SCOP classification (if classified). Using these methods to assign SCOP superfamilies has been shown to be successful while introducing very few false positives (Rychlewski et al. 2000). Table 1 shows the number of PDB-BLAST and FFAS03 domains classified by the PFP with SCOP superfamilies. Of the 314,000 PDB-BLAST domains, 207,700 (66%) were annotated with a SCOP superfamily, and of the 58,000 FFAS03 domains, 30,000 (52%) were annotated with a SCOP superfamily. In total, our pipeline assigned or predicted SCOP superfamilies for more than 295,000 domains out of the nearly 700,000 predicted domains.
Table 1.
Superfamily classifications for domains processed by the PFP

Validation of de novo superfamily predictions
In this section, we assess the accuracy of our SCOP superfamily classifier using a benchmark of 875 proteins solved after our Rosetta predictions were made (Supplemental Table S5). Previous test sets used for determining accuracy of the MCM score function were composed of predictions made on proteins with structures already in the PDB (Malmström et al. 2007). The use of a test set based only on the PDB is not ideal because it does not reflect the error associated with domain prediction, can overestimate the performance (as the PDB is used to create fragment library), and can only account for folds currently present in the SCOP database. To address these issues, we compiled a set of 875 de novo structure predictions, from the full set of 57,000 de novo predictions, whose structures (or highly similar protein, BLAST e-value of 10−5 or less; see Methods) were experimentally solved after Rosetta fragment library selection; we refer to this set of 875 proteins as the “Solved after Predicted” (SAP) set (Supplemental Table S5). The top 25 cluster centers for each sequence in the SAP set were first classified into SCOP superfamilies (described above), and then the superfamily with the highest MCM score was compared to the true superfamily of the native structure. We correctly classified 47% (407) of the domain structures out of the 875 in the SAP set (Table 2) with our top-ranked prediction. Figure 2 (top and middle) shows correct versus incorrect predictions broken down by SCOP class. Figure 2 (bottom left) shows a precision/yield curve for the SAP set, where predictions are ordered by their MCM score and plotted according to their precision. An MCM score threshold of 0.9 yields 38% (333) of all predictions made in the SAP set and is 78% accurate (Fig. 2, bottom left; Table 2). Our overall performance on the SAP set demonstrates our ability to accurately classify structure predictions into superfamilies. Additional analysis of the validation of this benchmark can be found in Supplemental Material S2.2.
Table 2.
Superfamily classifications for SAP structures

Figure 2.

Distribution of SCOP superfamily classifications. (Top and middle) A set of 875 protein domains (SAP set) folded by Rosetta and whose structure (or protein with strong sequence similarity) has been solved after our prediction was used to determine the accuracy of our method's ability to correctly classify SCOP superfamilies. Plotted in solid lines and dotted lines are the number of correct and incorrect classifications, respectively. Classifications are broken down by SCOP class A (α; blue), B (β; yellow), C (β–α–β; red), and D (segregated α and β; green). This graph demonstrates that classifications with high MCM scores are the most accurate in classifying the SCOP superfamily. (Bottom left) The precision/yield plot shows the percentage of protein domains in the SAP set classified using SCOP v1.75 for varying precisions. The line is colored relative to MCM score (right axis). (Bottom right) The histogram of superfamily classification error types represents the total number of incorrectly classified models in the SAP set for different MCM score ranges using a previous version of SCOP (v1.67). “New SF error” is the error due to a new superfamily (i.e., the true superfamily was not represented in the structure comparison set), 62% of total error. “Decoy error” is the error due to insufficient de novo model quality, 28% of total error. “Classifier error” is the error due to the superfamily classifier being inaccurate, 10% of total error.
Quality of superfamily predictions and underlying structure predictions
In several cases, Rosetta produced relatively accurate structure models, but we failed to assign the correct SCOP superfamily because the protein fold was not yet annotated in SCOP or was sparsely sampled. In this section, we characterize sources of error that affect our ability to accurately classify proteins into SCOP superfamilies. To properly account for a correct superfamily not being classified in the SCOP database, we ran our SAP set on an earlier version of SCOP (v1.67), which was released prior to our de novo predictions. Our analysis of incorrectly classified SCOP superfamilies in the SAP set revealed three main distinct sources of error: (1) errors due to the absence of the target fold in SCOP; (2) errors due to inaccuracy of predicted structures; and (3) errors due to incorrect classification of an accurate structure.
The first type of error is due to the true fold/superfamily not being represented in our structure comparison set. There are 554 new superfamilies in the current version of SCOP (v1.75) that were absent in the previous version (1.67). Figure 2 (bottom right) shows a histogram of the incorrectly classified models in the SAP set. Shaded in yellow is the portion of incorrect classifications where the true superfamily is a new superfamily. New superfamilies are the major source of error in our classification method and account for ∼62% of the total error in the SAP set. We believe this error type will become less significant as the protein fold space is more thoroughly sampled and more superfamily representatives are included in our structure comparison set. It should be noted that this type of error is absent from previously reported benchmarks based solely on the PDB because the test structures are already classified in the SCOP database.
The next source of error stems from error in the de novo predicted model. We estimate this by determining if the predicted structure is more similar (by MAMMOTH structure alignment) to the incorrect superfamily than the true superfamily (Fig. 2, bottom right panel, shaded gray) (see Methods). Structures that are more similar to the incorrect superfamily are classified incorrectly due to insufficient quality of 3D Rosetta models, and this error is estimated to constitute ∼28% of the total error. Further developments to the Rosetta de novo protocol and increased sampling may alleviate this error in the future.
The final source of error stems from error in our superfamily classifier method. This error arises when Rosetta produces an accurate model but our classifier method chooses an incorrect superfamily in spite of the fact that a structure with the correct superfamily exists in our database (Fig. 2, bottom right panel, shaded green) (see Methods). Error attributed to the classifier method is minimal compared to other error types, ∼10% of total error. Interestingly, several of the models in this error class have the true superfamily “alpha–beta sandwich, ACT-like” (d.58.18). A recent study describing the CATH hierarchy of structural classification (a classification of 3D protein structures similar to SCOP) describes this fold (CATH Architecture 3.30) to be in a continuous, densely populated region of protein fold space where several independent folds have similar features (Cuff et al. 2009). Our superfamily classifier depends on structural differences, so distinguishing between two closely related folds is more difficult and, therefore, requires the highest level of structural accuracy and increased sampling of fold space. We believe that continuous regions of fold space will be a persistent, albeit small, source of error for our method and similar structure-based methods.
In line with our estimates of the relative importance of these three main sources of error, we find that our fold-prediction yield on the SAP set more than doubles when we update our fold database from SCOP release 1.67 to 1.75 (Supplemental Fig. S2).
We next asked if the de novo structure models are valuable alone, independent of SCOP superfamily classification. We used MAMMOTH to compare each of the 875 de novo predictions in the SAP set to their experimental structure. Supplemental Figure S3 shows that our superfamily classifier scores are well correlated with model similarity via the MAMMOTH Z-score, which accounts for length and RMSD of structure similarity to the true structure. This shows that the superfamily classifier score is predictive of not only superfamily classification accuracy but also model accuracy, allowing de novo models to be used in other applications that do not require superfamily classification such as active-site localization or prediction of residue surface accessibility (see Supplemental Fig. S4).
Molecular function prediction
We next demonstrate that SCOP superfamily predictions can be integrated with additional information annotated to a protein to predict gene ontology (GO) molecular functions in an automated way. GO is a controlled vocabulary of molecular function (GO-MF), biological process (GO-P), and cellular component (GO-C) terms suitable for automated transfer among proteins. We focus on the integration of structural information with GO-P and GO-C due to the wide availability of these predictors across many of the genomes analyzed. Many structural superfamilies exhibit a diverse set of compatible GO-MF annotations, and additional evidence is needed to determine a specific function for an individual protein domain. For example, the SCOP immunoglobulin superfamily (sccs: b.1.1) is annotated with several function terms including protein binding (PDB ID: 3D2U), transporter activity (PDB ID: 2ZJS), and structural molecule activity (PDB ID: 1ACY), among others. The function of an immunoglobulin protein can only be understood in the context of its localization and interaction partners in the cell (information that can be found in databases or extracted from high-throughput experiments for several organisms and described by GO-P or GO-C). Conversely, structural evidence may allow for the refinement of a general function annotation (e.g., binding) inferred by localization or process evidence to a more specific function annotation (e.g., miRNA binding). To this end, we have developed a naive Bayes classifier that integrates GO-P and GO-C annotations with predicted SCOP superfamily classifications to predict GO-MF terms.
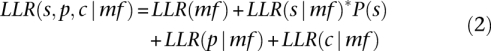
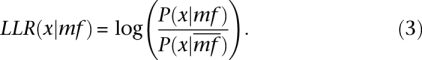
For each GO-MF term in the GO database, our method first calculates the likelihood the MF term is true (LT) and the likelihood the term is false (LF) for an individual predictor (i.e., GO-P, GO-C, superfamily classifications). A ratio of LT over LF is then calculated and the log of the ratio is taken, producing an individual log likelihood ratio (LLR) score. The individual LLR is calculated for each independent predictor classified to the query protein. The individual LLR score for the structure (S) predictor is scaled to reflect the confidence we have in the structure assignment (e.g., de novo LLR is scaled by MCM score). Individual likelihoods are calculated using frequency counts of training sequences annotated with GO-MF and that have GO-P annotations, GO-C annotations, or high-quality BLAST matches to SCOP superfamily representatives. Due to the conditional dependence of GO-P and GO-C terms within their respective branches of the GO tree, a feature selection method was implemented to restrict GO-P and GO-C to a focused conditionally independent set. We selected one GO-P and one GO-C (when available) with the highest mutual information with each potential GO-MF term for the calculation of an individual LLR score. Finally, all individual LLR scores for the GO-MF term were summed to produce an overall LLR score. See the Methods section for a complete description. An overall LLR score greater than zero can be interpreted as being more likely to be true than false, and we therefore consider an LLR >0 to be confident.
Yield of function predictions using superfamily classifications
We applied our function prediction method to 295,000 domains with PDB-BLAST, FFAS03, and de novo superfamily classifications. We confidently predict specific GO-MF for 44% (129,000) (Supplemental Table S4) of domains (LLR >0: prediction is more likely true than false and GO-MF is annotated to <2% of proteins in our training set). We confidently predicted novel GO-MF annotations for 15% (22,000) of the 147,000 domains that lack any GO-MF (Supplemental Table S4), and therefore the addition of structural evidence derived from our predictions significantly increases the coverage of function annotation to unannotated proteins and protein domains. In addition, our function predictions are applied directly to domains, which begins to address the need for site-specific annotation in multidomain proteins.
The value of function predictions is seen not only for unannotated domains but also for “underannotated” domains, which are domains that have either a general function (but not one specific enough to fully characterize the domain) or multiple functions (but are currently only annotated with one). We confidently predicted specific functions for 87,000 domains for which we either extended a generic annotation or predicted a new function altogether. In all, we provided confident function predictions for 109,000 under- and unannotated domains, which makes up a significant fraction (37%) of domains for which structure predictions were generated.
Accuracy of function prediction method
To determine the accuracy of our function prediction method, we created a benchmark using sequences processed with our pipeline that are currently annotated with one or more specific GO-MF term (see Methods). We first examined the accuracy of our function predictions made using PDB-BLAST structure evidence. PDB-BLAST is the highest-confidence structure assignment method and provides an upper bound on the confidence and expected yield of function predictions. Figure 3 (upper left) shows that integrating PDB-BLAST structural evidence with GO Process (GO-P) and Component (GO-C) (PCS, green) improves prediction accuracy over only using GO-P and GO-C (PC, red) for a random sampling of 5000 GO-MF annotated eukaryotic proteins. All combinations of predictors involving structural evidence show improved performance, and the combination of PCS performs best with >20% recall of known molecular functions at 50% precision. This result confirms that molecular function predictions are more accurate using structural evidence at the level of the SCOP superfamily.
Figure 3.

Function prediction method with structure information outperforms method without structure information. (Upper panel) Precision versus recall for eukaryotic function predictions separated by the type of structure evidence. The graph shows the precision of function predictions versus recall (fraction of all true annotations) for sequences that were structurally classified by PDB-BLAST (left) and FFAS03 (right). (Red lines) The prediction method using GO process and component (PC). (Green lines) The prediction method using GO process, component and structure (PCS). The graph shows adding structure information from PDB-BLAST and FFAS03 improves precision for function prediction. (Lower panel) Function prediction methods using structure information produce novel function predictions for a unique set of proteins. Functions were predicted for FFAS03 domains with SCOP classifications from a random sampling of 5000 proteins with known molecular function. (Black lines) Functions (lower left) and proteins (lower right) predicted by both predictor methods. (Red lines) Functions (or proteins) predicted only by PC. (Blue lines) Functions (or proteins) predicted only by PCS. The predictions made with the integration of structure with process and localization terms annotate a unique range of molecular functions and proteins that would be otherwise unreachable.
Performance of function predictions using FFAS03 structure evidence were also evaluated using a random sampling of 5000 eukaryotic proteins. Figure 3 (upper right) highlights the integrative performance of FFAS03 structural evidence with other GO information. This shows that the inclusion of fold recognition structural evidence with GO-P and GO-C (green) mostly outperforms GO-P and GO-C alone (red). The decrease in performance of fold recognition evidence in comparison to PDB-BLAST (7.5% recall at 50% precision) can be attributed to the error associated with the longer evolutionary distance between query and matched proteins, causing greater functional divergence and a result of incomplete annotation of benchmark domains. The increase in accuracy when integrating fold recognition structure evidence in comparison to GO-P and GO-C evidence alone shows that structure evidence at multiple levels of confidence can be used to predict molecular function.
Creating a proper benchmark to address the accuracy of function predictions based on de novo structure evidence is generally a more difficult task than creating a benchmark to judge structural accuracy of predictions. Because our pipeline annotates domains with the highest confidence method first, domains with de novo structure predictions are less likely to be annotated with GO functions shrinking the pool of domains from which we can draw our benchmark. Therefore, benchmarking de novo function predictions is complicated by the limited ability to distinguish between a false prediction and a true prediction that is not currently annotated. In this study, de novo function predictions from a subset of the SAP set with known GO-MF annotations were used as a blind benchmark and show that de novo structure evidence can be used in combination with GO-P and GO-C to predict molecular function (Supplemental Fig. S7). It is important to keep in mind, however, that the SAP set is an imperfect benchmark because of its relatively small size with respect to fold recognition-based function predictions. Nevertheless, we are encouraged by this result. We anticipate that as additional function and structure annotations are deposited in GO and the PDB, respectively, we will be able to expand our SAP set and better calibrate our error estimates for de novo–based function prediction.
Structural information produces unique function predictions and increases the specificity of function predictions derived from other methods
An examination of the molecular function predictions made by our pipeline shows that structural evidence not only improves our predictive accuracy (see section above) but also allows us to make predictions for a novel set of function terms and a novel set of proteins that are not made using the GO-P and GO-C evidence alone. We first made predictions for a random sampling of FFAS03 annotated eukaryotic domains using two evidence sets, one with structure information, PCS (GO-P, GO-C, and SCOP superfamily), and one without structure information, PC (GO-P, GO-C). We then determined all of the unique MF terms predicted by both evidence sets and divided them into sets of functions that were predicted (1) only by PCS, (2) only by PC, and (3) by both, which resulted in 636 unique function terms (precision > 50%) (Fig. 3, lower left). Of these 636 function terms, the PCS evidence set (includes structure) predicted 306 unique function terms. This is in comparison to only 29 function terms that were uniquely predicted by the PC evidence set (the remaining 301 unique function terms were predicted by both), which suggests that the addition of structural information as a function predictor allows for the prediction of a greater number of function terms.
We also asked what set of proteins required structure evidence for confident function annotation. Figure 3 (lower right) shows that 21% (359) of the sample set of proteins are confidently annotated by PCS compared to 10% (183) only annotated by PC (a remaining 1201 proteins were annotated by both evidence sets). These results demonstrate that function predictions incorporating structural evidence aid in annotating both an expanded set of function terms and protein domains. This, taken with the above results, shows that our function predictions accurately annotate substantial portions of proteomes that are unreachable by other methods.
Example predictions
Expansion of the transglutaminse fold family in Deinococcus radiodurans represents a key adaptation to ionizing radiation
Deinococcus radiodurans can withstand extremely large doses of ionizing irradiation (Cox and Battista 2005). A previous study of the D. radiodurans genome has shown enrichment of specific protein families related to stress response and damage control based on sequence comparisons to other bacterial organisms (Makarova et al. 2001). We performed fold superfamily enrichment analysis based on our proteome-wide predicted superfamilies for D. radiodurans (4864 protein domains from the PFP pipeline) (Table 3A). Our analysis recovered many of the previous study's enriched protein families including PR-1-like, Subtilisin-like, Nudix hydrolases, and DinB/YfiT-like folds. Our work expands structure prediction coverage and reveals several enriched protein folds not reported in these prior comparisons; in particular, we predict that the D. radiodurans proteome contains 10 or more protein domains with the transglutaminase fold. The transglutaminase fold has been shown to participate in the nucleotide excision repair (NER) pathway (the yeast protein RAD4 is homologous to the several members of the transglutaminase family) (Anantharaman et al. 2001). The uncharacterized D. radiodurans gene, DR1901, predicted by this study to have a transglutaminase fold, exhibits a 10-fold induction in gene expression in response to radiation (Liu et al. 2003), supporting the hypothesis that several of the unannotated proteins we predict to have a transglutaminase fold are directly involved in D. radiodurans's response to ionizing radiation, likely by participating in the NER pathway in a manner similar to RAD4.
Table 3.
Top enriched folds of D. radiodurans and P. vivax

Novel structure predictions reveal an enrichment of several new signaling and virulence related fold families in the P. vivax proteome
P. vivax is a human malaria parasite that has recently shown resistance to common drug treatments (Rieckmann et al. 1989). We used our structure predictions to uncover specific folds that are significantly expanded in this pathogen (Table 3B). Two protein families commonly found in Plasmodium genomes, and already known to play a key role in pathogenesis, were recovered: major surface antigen and Duffy binding domain-like. Newly detected enriched folds include FKBP12-rapamycin binding (five instances of this fold were predicted by the Rosetta de novo protocol). Rapamycin is an immunosuppressant known to interact with several proteins including mTOR and FKBP12 (Zhou et al. 2010); these domains may be involved in the parasite's interactions with the host immune system during initial stages of infection. Other enriched folds include virulence factors such as the Adhesin YadA fold and the protease cathepsin, which make potential drug targets for further study. Our predictions represent interesting candidate members of the already complex host–pathogen interaction network currently characterized for P. vivax.
CC_3056 (Caulobacter crescentus) is a truncated hemoglobin fold
The truncated hemoglobin family is a 2/2 α-helical fold present in bacteria with functions including NO dioxygenation, oxidation/reduction, and respiration (Vinogradov and Moens 2008). The Caulobacter crescentus hypothetical protein CC_3056 was folded using Rosetta (Fig. 4A) and confidently classified in the “Globin-like” superfamily (sccs:a.1.1, MCM = 0.98); our prediction matched a truncated hemoglobin (1DLW chain A, 1DLWa), producing a structure-structure alignment with 4.97 Å RMSD (Fig. 4B). CC_3056 and the truncated hemoglobin 1DLWa have only 23% sequence identity but share a semiconserved heme binding pocket (Fig. 4C), where 16 out of 26 ligand binding residues are similar (Blossum62 values > 0), including nine identical residues key to the function of 1DLWa (Lopez et al. 2007). Finally, a close homolog of CC_3056, Campylobacter jejuni trHbP, was recently crystallized (after our initial prediction was made, 2IG3), confirming the truncated hemoglobin fold prediction (Nardini et al. 2006) (http://www.yeastrc.org/pdr/viewProtein.do?id=2823436, the PDB-BLAST hit to 2IG3, is now reported in the updated database).
Figure 4.

C. crescentus hypothetical protein CC_3056 is a truncated hemoglobin fold, and marine metagenome hypothetical protein GOS_6366033 is predicted to be a chorismate mutase. (A) Rosetta model of CC_3056. (B) Structural alignment of Rosetta model and 1DLWa, a truncated hemoglobin with MAMMOTH alignment Z-score of 14.39. (C) Rosetta model viewed with superimposed 1DLW heme ligand. (D) Rosetta model of GOS_6366033. (E) Structure alignment of Rosetta model and 1ECMa, a chorismate mutase with structural alignment Z-score of 9.71. (F) Rosetta model viewed with 1ECM transition state analog of chorismate. Ligand-contacting residues that are identical (blue) and similar (red) in the matched PDB structures are shown in C and F.
GOS_6366033 (a new and unannotated protein family from ocean metagenomics) is predicted to be a chorismate mutase
The recent metagenomics Global Ocean Sampling (GOS) expedition (Yooseph et al. 2007) provided more than 1700 new protein families with no detectable homology with known protein families. We folded two members for each of these novel families containing fewer than 150 residues with Rosetta (877 families). The predicted fold of GOS_6366033 (Fig. 4D) confidently matched a chorismate mutase structure (1ECM, sccs:a.130.1, Chorismate mutase II, MCM = 0.93) (Fig. 4E; Lee et al. 1995). Chorismate mutase catalyzes chorismate to prephenate in the bacterial biosynthesis pathway of tyrosine and phenylalanine. 1ECM and GOS_6366033 share only 11% sequence identity (based on structural alignment, as sequence-based methods detect no alignment), but a structure–structure alignment of our model to 1ECM predicts that five GOS_6366033 residues are conserved in the chorismate binding pocket of 1ECM (Fig. 4F). Two of the conserved residues, Arg51 (Arg44 in GOS_6366033) and Glu52 (Glu45), are identical and participate in hydrogen bonds with the transition-state analog of chorismate in 1ECM, which possibly stabilize the ligand. Two other conserved residues, Leu55 (Met48) and Ile81 (Leu74), are thought to aid binding through hydrophobic contacts with the ligand. A fifth conserved residue, Arg47 (Lys39), stabilizes the Glu52 side chain through electrostatic interactions in the 1ECM structure, leading us to believe that the Lys39 in GOS_6366033 protein serves a similar role.
Rumi (Drosophila melanogaster)
Rumi is an endoplasmic reticulum protein and an important regulator of the Notch-signaling pathway, which, in turn, regulates cell fate decisions. Our pipeline predicted Rumi to be a member of the glycosyltransferase SCOP superfamily (sccs: c.87.1) based on fold recognition analysis (FFAS03). Integrating this superfamily prediction with the GO-P term “carbohydrate metabolic process” (GO:0005975), we predicted the GO-MF term “transferase activity, transferring glycosyl groups” (GO:0016757). Subsequent to this prediction, Rumi was shown to display O-glucosyltransferase activity by Acar et al. (2008), who observed lower amounts of O-glucosylated peptides in Rumi knockdown samples compared to controls, confirming our function prediction for Rumi (http://www.yeastrc.org/pdr/viewPSPOverview.do?id=673166).
OOEP (Mus musculus)
Transfer of genetic material from maternal cells to precise locations in oocytes is important for proper mouse embryogenesis and development. The previously unannotated mouse gene, Ooep, was predicted by FFAS03 to be a member of the Eukaryotic type KH-domain SCOP superfamily (sccs: d.51.1). The KH-domain is a diverse RNA-binding domain superfamily. Our function prediction method using the assigned superfamily, GO-P “cellular macromolecule metabolic process” (GO:0034960) and GO-C “intracellular part” (GO:0044424), confidently predicted OOEP to have a “nucleic acid binding” GO-MF annotation (GO:0003676). It was later shown experimentally by Herr et al. (2008) that OOEP binds ribonucleotide homopolymers using an RNA binding assay. The study also showed that Ooep is a maternal effect gene involved in blastomere polarity, suggesting its involvement in patterning RNA in the developing oocyte (http://www.yeastrc.org/pdr/viewPSPOverview.do?id=614967).
Interfaces to our proteome-wide structure and function predictions
Biologists can obtain structure, superfamily, and molecular function predictions along with other predictions (such as secondary structure, disordered regions, and multiple sequence alignments) via a standard web interface, http://www.yeastrc.org/pdr/ (Supplemental Fig. S5; Riffle et al. 2005). A BLAST interface (http://pfp.bio.nyu.edu/blast/index) is available for searching our database using sequences not in the 94 genomes processed (as well as variants of the sequences processed). Additionally, we have integrated our database with the Cytoscape protein–protein interaction plug-in BioNetBuilder (Avila-Campillo et al. 2007) so that our predictions can be explored in a network context. BioNetBuilder automatically builds gene association networks for any organism in the NCBI taxonomy based on nine publicly available interaction databases (http://err.bio.nyu.edu/cytoscape/bionetbuilder/). Nodes in BioNetBuilder display visual cues (e.g., size, shape) indicating the confidence or relevance of our predictions for each gene in the network. Links to the web database are provided as attributes for each node in the Cytoscape network. Raw data are available upon request.
Discussion
We now discuss how the PFP pipeline relates to complementary methods, and the need for improved gene prediction and domain boundary prediction, as well as the importance of domain-centric function annotation.
Comparison of PFP to complementary methods and complementary experimental efforts
The Robetta server (Chivian et al. 2005) is a domain-centric structure prediction pipeline and, like the PFP, attempts to run the most accurate applicable structure prediction method on each predicted domain (PDB-BLAST → Fold recognition → Rosetta). The main disadvantages of this server are extremely long wait times (in many cases >6 mo), the inability to upload whole genomes, the lack of integrated function prediction, and the much smaller amount of sampling used for the de novo portion of the structure prediction. In the case of genome annotation, the most critical of these limitations is the long wait times (due to the computational cost of Rosetta modeling), which makes full-proteome analysis impossible, given the current architecture. Our pipeline solves this problem by pre-computing and archiving de novo structure predictions run on WCGrid, allowing immediate access to results and full proteome database queries. For example, a list of all putative transcription factors in a genome is a required input into regulatory network inference algorithms. This and previous work (Bonneau et al. 2004, 2007) show that proteome-wide structure prediction significantly expands the list of putative regulators and signaling proteins. Other key advantages to the PFP as a full proteome annotation tool include SCOP superfamily classification of structures and GO function predictions based on those structure annotations. Integrating the Robetta server with the PFP database (such that queries to the Robetta server already contained in our database can be resolved without repeating costly structure prediction calculations) is an attractive area for future work.
The Protein Structure Initiative (PSI) is a multigroup effort to increase the coverage of structure annotations across protein sequence space using both experimental and computational approaches (Dessailly et al. 2009). The computational effort we describe here and the PSI are extremely complementary in both methodology and coverage of protein sequence space. The PSI has greatly increased the number of structures in the Protein Data Bank and thus expanded the mapping of sequence space to structures. This improves the coverage of PFP sequence and fold recognition-based methods (PDB-BLAST, FFAS03) and indirectly improves the accuracy and yield of our de novo procedure by adding to the set of structures from which to classify de novo predictions (SCOP superfamily classification). The PSI has increased the fraction of protein sequences that can be assigned a structure by 2.0% over a 3-yr period (based on the UniProt protein set) (Dessailly et al. 2009). In comparison, we report an increase of 1.8% in structural coverage of 94 genomes based on confident de novo structure predictions over all domains predicted (Table 1). Although computationally predicted structures are less valuable for many tasks, the additional coverage afforded by our pipeline is mostly orthogonal to the PSI coverage. The PSI and PFP also differ in focus: Eukaryotic organisms are not the primary focus of the PSI, whereas the PFP has been applied to a balanced distribution of eukaryotic and prokaryotic organisms (Supplemental Table S1). Finally, de novo structure predictions from the PFP could be used to aid in target selection by the PSI. A current problem in selecting sequences for experimental structure determination by the PSI is discriminating sequences with novel folds from evolutionarily divergent sequences of known folds. Our pipeline reports SCOP superfamily classifications for de novo structures, which are potential evolutionary divergent members of the matched superfamily. Sequences without quality SCOP superfamily classifications are possible members of novel folds and thus could be assigned a higher priority for experimental structure determination with respect to increasing structural coverage of protein space.
Need for improved gene prediction and domain boundary prediction
Our ability to use structure-based methods to improve proteome annotation is sensitive to the accuracy of gene prediction and domain prediction methods. It has been reported that large numbers of genes have incorrectly assigned start sites (Nielsen and Krogh 2005) and splice sites (Guigó et al. 2006). We believe that as gene prediction techniques continue to improve the identification of protein boundaries, the PFP will show increased accuracy in predicting protein structure annotations for a greater number of proteins. An analysis of the performance of Ginzu (Kim et al. 2005) showed that errors in domain boundary prediction are major sources of error in all downstream predictions. Other domain parsing programs such as CHOP (Liu and Rost 2004) could also be used in conjunction with Ginzu to predict domain boundaries. Encouragingly, there are several promising recent high-throughput experimental approaches to determining protein domains, which could feasibly alleviate significant portions of domain prediction error. For example, Boxem et al. (2008) used a modular domain view of protein–protein interactions to determine the minimal region of the protein necessary to maintain a protein–protein interaction, thus elucidating individual domains. In many cases, the minimal interacting domains detected by Boxem et al. corresponded well to known or predicted structural domains. Similar approaches may be developed in the future to probe domain boundaries in a scalable genome-wide fashion.
Domain-centric annotation
In general, different domains within the same protein perform different functions. Unfortunately, many of the function annotations in the Gene Ontology database are not mapped to a specific domain in a multidomain protein. Applications such as genome-wide protein evolution and coevolution studies are hampered by the lack of domain-specific annotations. Chothia et al. (2003) have used domain structures of proteins to study gene duplication, recombination, and divergence, and they quantitate these processes in terms of their evolutionary impact. Vogel et al. (2004) describe the coevolution of domain combinations, called “supra-domains,” that continually recur in proteins. They note that more than one-third of structurally characterized proteins contain a supra-domain and therefore are particularly useful for genome evolution and annotation efforts. Such evolutionary studies require domain-level annotation and could be expanded if improved domain predictions were available.
We have demonstrated the ability to accurately and efficiently predict protein domains and their 3D structures on a proteome scale, classify unknown proteins into structural superfamilies, and predict functions based on this structural information. We have provided annotations for 94 proteomes, including medically relevant genomes, model organisms, and the human proteome, all of which will be valuable to the computational biology, biology, and clinical communities.
Methods
Previously published methods used in this study are described fully in the Supplemental Methods section, specifically domain prediction, domain selection for de novo prediction, de novo structure prediction, and SCOP classification of structure predictions. Below are new methods specific to this study.
Genome selection
Genomes were chosen to be representative of genomes across the tree of life as well as their value to the broader biological community (for a complete list, see Supplemental Table S1). Most major model organisms are covered, as well as a broad sampling of bacteria and archaea. Protein FASTA formatted files were downloaded from NCBI or the organism's genome web database circa December 2004 (HPF1 protocol) or November 2007/Feburary 2008 (HPF2 protocol). For the GOS data set, representatives from only novel protein families as described by Yooseph et al. (2007) were analyzed with the PFP.
World Community Grid
Rosetta was run on IBM's World Community Grid (WCGrid) using the Boinc framework (Anderson 2004). Owners of PCs running Windows, MAC OS/X, or Linux participate in WCGrid by installing a secure grid client program available from http://www.worldcommunitygrid.org. The grid client program requests work units from WCGrid servers and runs Rosetta in the background at the lowest possible priority. The state of the computation is check-pointed every few minutes to allow for efficient recovery of calculations in the event of machine failure. The Rosetta program was modified for use in the grid environment, which included adding checkpointing and modifications to remove security vulnerabilities.
Enrichment analysis
Enrichment scores were determined using the following equation:
where n is the number of domains with superfamily sf, N is the total number of domains in the organism, b is the number of domains with superfamily sf in background organisms, and B is the total number of domains in all background organisms. The background organisms used for D. radiodurans analysis were E. coli, Mycobacterium tuberculosis, C. crescentus, and Bacillus subtilis. The background organisms used for P. vivax analysis were Homo sapiens, Drosophila melanogaster, Caenorhabditis elegans, M. musculus, Saccharomyces cerevisiae, and Arabidopsis thaliana.
Binding pocket conservation analysis
Example predictions CC_3056 (C. crescentus) and GOS_6366033 (Ocean Metagenomics) were produced as described above using the PFP protocol. Known ligand binding and catalytic residues of the matched superfamily were determined from the FireDB database (Lopez et al. 2007). A structural alignment between the predicted structure and the superfamily representative structure was then obtained using Mammoth. This alignment was used to calculate the Blossum62 conservation score for the ligand binding residues.
Molecular function prediction
Molecular function predictions were made using a naive Bayes method that estimates a log-likelihood ratio (LLR) based on available evidence for each molecular function term, mf, in the GO ontology. Given the naive Bayes assumption that available predictors, GO-P (p), GO-C (c), or SCOP classification (s) are conditionally independent, an individual LLR score is calculated for each predictor and summed along with a prior to produce an overall LLR score (Eq. 2).
 |
Individual log-likelihood ratios are calculated as the ratio of the likelihood that the mf term is true over the likelihood that the term is false for an individual predictor x (where x is p, c, or s) and is formally defined by the equation:
 |
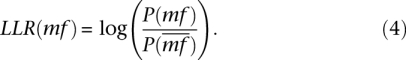
The mf prior LLR is calculated as the ratio of the probability that the mf term is true over the probability that the term is false and is given by the equation:
 |
To account for the error in our structure evidence, the LLR of the structure predictor was scaled by the confidence of the classification. Superfamily classifications based on structural evidence [P(s)] are fixed for PDB-BLAST and FFAS alignments at 1.0 and 0.9, respectively, to reflect the expected error of these methods. De novo–based LLR scores are scaled to 0.8 of the MCM score to represent the estimated uncertainty of our predictions:
The method was applied to predict functions for all protein domains predicted by Ginzu and had a predicted SCOP superfamily classification. All molecular functions predicted above a cutoff of LLR ≥ −3 are saved, but only LLR > 0 are considered confident (i.e., more likely correct than incorrect).
Training data and calculation of function probability tables
A set of sequences annotated with GO terms and structure was created for the purpose of building probability tables required for our function prediction method. We first compared sequences with known GO annotations from the June 2009 MYGO lite database (Ashburner et al. 2000) to the Astral95 1.75 database of structurally classified domain sequences (Chandonia et al. 2004) using BLAST. BLAST matches with expectation values better than 10−8 and a match length >85% of the full length of the Astral sequence were included in the set. Sequences were clustered using CD-HIT with a sequence identity cutoff of 80% and a length difference of 80% to reduce sequence redundancy and sample bias (Li and Godzik 2006). All GO annotations of members within a cluster were assigned to the cluster's representative sequence.
Probability tables for evidence (x = {p,c,s}) were calculated using the following equation:
where N is the number of sequences with the given annotation, ∩ is the intersection, and MF is the set of all GO MF terms. Note, in Equation 6, M indicates the number of pseudocounts added to the probability distributions. Negligible differences in results were seen when using a range of M values from 4 to 10. The value of M was conservatively chosen to be 10. Priors used in pseudocount calculations are calculated using the following equation:
Transfer of GO annotations for features of our function prediction method
GO annotations were used as features (GO-P and -C) to perform function prediction. Often, an unannotated protein has a similar protein that is well characterized, and it can be inferred that the two share the same GO terms. GO annotations from annotated sequences in MYGO were transferred to sequences in our 94 genomes based on high-confidence BLAST matches. In addition, true labels (GO MF) were also generated automatically to benchmark our function prediction classifier. Each PFP protein sequence was searched against the MYGO sequence database (Ashburner et al. 2000), and annotations were transferred from BLAST matches with an expectation value better than 10−10 and a match alignment consisting of 85% of the smaller sequence. The MYGO database June 2009 was used for evaluating confidence of function prediction methods. The MYGO database August 2010 was used to generate automated GO annotations for final molecular function predictions.
Selection of relevant features for function prediction
Since the GO Ontology is represented as a directed acyclic graph (i.e., specific terms are children of related less-specific terms), multiple terms annotated to a single protein are often conditionally dependent, which violates our naive Bayes assumption of independent predictors. We remedy this by selecting the most relevant GO-P and GO-C terms for predicting each molecular function by way of mutual information. Initially, we observed high mutual information scores for non-specific GO-P and -C terms with specific MF terms and correct for this by only calculating mutual information for joint probabilities where MF and P or C terms are true. The modified mutual information (MI) of a GO term (x) with a molecular function (mf) is given by the following equation:
The P and C terms (x) with the maximum mutual information out of all terms annotated were selected as predictors of function in the naive Bayes method.
Evaluating confidence
De novo solved after predicted (SAP)
We built a benchmark of de novo structure predictions whose predictions were made prior to an experimental structure being solved. Sequences were compared to the Astral 1.75 database using BLAST. A BLAST expectation value of 10−5 and alignment length of 80% was used to transfer SCOP superfamily assignments of Astral domains to query sequences. Sequences were then clustered with CD-HIT using 40% identity and 70% length parameters to limit over-representation and sequence bias. Sequences of each cluster were then searched in the full PDB using BLAST to identify sequences that were possibly crystallized prior to our structure predictions (2005-01-01). Sequences with BLAST matches (<10 eval), which met a threshold of 20% identity and 50% length to PDB sequences deposited prior to 2005, were filtered out. This conservative filtering ensures that sequences with de novo structure predictions in the SAP set were folded prior to any similar structure solved in the PDB. A list of the sequences used in the SAP set can be found in Supplemental Table S5.
Superfamily classification error
To estimate the error of our de novo superfamily classifier, the SAP benchmark was classified using an earlier version of SCOP (1.67). We compared these predicted superfamilies to the true superfamilies as determined by sequence comparisons to Astral 1.75 sequences (as described in the previous section). We then only included incorrectly classified entries (i.e., predicted superfamily ≠ true superfamily) for further analysis, as these are examples of error in our classification method. We were then able to determine three types of error from this set, specifically, new superfamily error, model error, and misclassification error. New superfamily error was calculated as the number of SAP entries in which the true superfamily was not present in SCOP 1.67. To calculate model error and misclassification error, we compared predicted structures of a SAP entry to a structure in the incorrectly assigned superfamily and to a structure in the true superfamily using Mammoth Z-score. SAP structures that are more similar to the incorrect superfamily than the true superfamily (i.e., higher Z-score) are due to insufficient quality of 3D Rosetta models and are therefore considered model error. SAP structures that are closer to the correct superfamily but still incorrectly classified are incorrectly predicted due to misclassification error.
Function prediction
To analyze the performance of the naive Bayes function prediction method using PDB-BLAST and FFAS03 superfamily classifications as predictors, function predictions were made for 5000 randomly sampled eukaryotic PDB-BLAST and FFAS03 proteins with known GO-MF annotations. To analyze performance using de novo superfamily classifications as predictors, function predictions were made for 231 domains of the SAP set with known GO-MF. Predictions were compared to the known MF annotation terms (i.e., automated GO annotations based on MYGO June 2009) for accuracy. Only specific molecular functions (annotated to <2% of proteins) are included in the set of known annotations. Performance of the function prediction classifier is determined by Precision versus Recall:
where TP is true predictions, FP is false predictions, and FN is true annotations not predicted. The predictions labeled “random” in Precision–Recall graphs were produced sampling GO-MF terms from all predictions and ranking by base LLR calculated from priors.
To determine the uniqueness of function prediction between evidence sets (with structure, PCS; and without structure, PC), functions were predicted with both evidence sets for a random sampling of 5000 proteins with FFAS03 domain predictions that had SCOP classifications and known GO MF annotations. Predictions were ordered by log likelihood ratio, and precision estimates were created based on comparing the predicted MF term to the known (or electronically transferred) MF annotation term.
Acknowledgments
We thank the volunteers participating in the Human Proteome Folding Project on IBM's World Community Grid and the FFAS03 development team. We also thank Sasha Levy for comments on the manuscript; Shannon Tsai, John Bako, and P. Doug Renfrew for computational support; and Jane Carlton for helpful discussions. In addition, we thank the Rosetta Commons and the Yeast Resource Center. R.B., K.D., and G.L.B. were supported by NSF-0820757, NIH-RC4 AI092765-01, and NIH-U54CA143907-01. K.D. was also supported by NIH T32-GM-088118-01. T.N.D. and M.R. and the development of the YRC were supported by NIH-P41-RR11823. D.R.G. and L.M. thank 5 U54 AI057141-03 and 1S10RR023044-01 for support.
Footnotes
[Supplemental material is available for this article.]
Article published online before print. Article, supplemental material, and publication date are at http://www.genome.org/cgi/doi/10.1101/gr.121475.111. Freely available online through the Genome Research Open Access option.
References
- Acar M, Jafar-Nejad H, Takeuchi H, Rajan A, Ibrani D, Rana NA, Pan H, Haltiwanger RS, Bellen HJ 2008. Rumi is a CAP10 domain glycosyltransferase that modifies Notch and is required for Notch signaling. Cell 132: 247–258 [DOI] [PMC free article] [PubMed] [Google Scholar]
- Altschul SF, Madden TL, Schäffer AA, Zhang J, Zhang Z, Miller W, Lipman DJ 1997. Gapped BLAST and PSI-BLAST: a new generation of protein database search programs. Nucleic Acids Res 25: 3389–3402 [DOI] [PMC free article] [PubMed] [Google Scholar]
- Anantharaman V, Koonin EV, Aravind L 2001. Peptide-N-glycanases and DNA repair proteins, Xp-C/Rad4, are, respectively, active and inactivated enzymes sharing a common transglutaminase fold. Hum Mol Genet 10: 1627–1630 [DOI] [PubMed] [Google Scholar]
- Anderson DP 2004. BOINC: A system for public-resource computing and storage. In GRID (ed. Buyya R), pp. 4–10 IEEE Computer Society, Washington, DC [Google Scholar]
- Ashburner M, Ball CA, Blake JA, Botstein D, Butler H, Cherry JM, Davis AP, Dolinski K, Dwight SS, Eppig JT, et al. 2000. Gene Ontology: tool for the unification of biology. The Gene Ontology Consortium. Nat Genet 25: 25–29 [DOI] [PMC free article] [PubMed] [Google Scholar]
- Avila-Campillo I, Drew K, Lin J, Reiss DJ, Bonneau R 2007. BioNetBuilder: automatic integration of biological networks. Bioinformatics 23: 392–393 [DOI] [PubMed] [Google Scholar]
- Bader GD, Hogue CWV 2002. Analyzing yeast protein–protein interaction data obtained from different sources. Nat Biotechnol 20: 991–997 [DOI] [PubMed] [Google Scholar]
- Bendtsen J, Nielsen H, von Heijne G, Brunak S 2004. Improved prediction of signal peptides: SignalP 3.0. J Mol Biol 340: 783–795 [DOI] [PubMed] [Google Scholar]
- Bonneau R, Baliga N, Deutsch E, Shannon P, Hood L 2004. Comprehensive de novo structure prediction in a systems-biology context for the archaea Halobacterium sp NRC-1. Genome Biol 5: R52 doi: 10.1186/gb-2004-5-8-r52 [DOI] [PMC free article] [PubMed] [Google Scholar]
- Bonneau R, Facciotti MT, Reiss DJ, Schmid AK, Pan M, Kaur A, Thorsson V, Shannon P, Johnson MH, Bare JC, et al. 2007. A predictive model for transcriptional control of physiology in a free living cell. Cell 131: 1354–1365 [DOI] [PubMed] [Google Scholar]
- Boxem M, Maliga Z, Klitgord N, Li N, Lemmens I, Mana M, de Lichtervelde L, Mul JD, van de Peut D, Devos M, et al. 2008. A protein domain-based interactome network for C. elegans early embryogenesis. Cell 134: 534–545 [DOI] [PMC free article] [PubMed] [Google Scholar]
- Bradley P, Malmström L, Qian B, Schonbrun J, Chivian D, Kim DE, Meiler J, Misura KMS, Baker D 2005. Free modeling with Rosetta in CASP6. Proteins (Suppl 7) 61: 128–134 [DOI] [PubMed] [Google Scholar]
- Chandonia JM, Hon G, Walker NS, Lo Conte L, Koehl P, Levitt M, Brenner SE 2004. The ASTRAL Compendium in 2004. Nucleic Acids Res 32: D189–D192 [DOI] [PMC free article] [PubMed] [Google Scholar]
- Chivian D, Kim DE, Malmstrom L, Bradley P, Robertson T, Murphy P, Strauss CE, Bonneau R, Rohl CA, Baker D 2003. Automated prediction of CASP-5 structures using the Robetta server. Proteins (Suppl 6) 53: 524–533 [DOI] [PubMed] [Google Scholar]
- Chivian D, Kim DE, Malmström L, Schonbrun J, Rohl CA, Baker D 2005. Prediction of CASP6 structures using automated Robetta protocols. Proteins (Suppl 7) 61: 157–166 [DOI] [PubMed] [Google Scholar]
- Chothia C, Lesk AM 1986. The relation between the divergence of sequence and structure in proteins. EMBO J 5: 823–826 [DOI] [PMC free article] [PubMed] [Google Scholar]
- Chothia C, Gough J, Vogel C, Teichmann SA 2003. Evolution of the protein repertoire. Science 300: 1701–1703 [DOI] [PubMed] [Google Scholar]
- Cox MM, Battista JR 2005. Deinococcus radiodurans—the consummate survivor. Nat Rev Microbiol 3: 882–892 [DOI] [PubMed] [Google Scholar]
- Cuff A, Redfern OC, Greene L, Sillitoe I, Lewis T, Dibley M, Reid A, Pearl F, Dallman T, Todd A, et al. 2009. The CATH hierarchy revisited—structural divergence in domain superfamilies and the continuity of fold space. Structure 17: 1051–1062 [DOI] [PMC free article] [PubMed] [Google Scholar]
- Dessailly BH, Nair R, Jaroszewski L, Fajardo JE, Kouranov A, Lee D, Fiser A, Godzik A, Rost B, Orengo C 2009. PSI-2: Structural genomics to cover protein domain family space. Structure 17: 869–881 [DOI] [PMC free article] [PubMed] [Google Scholar]
- Finn RD, Tate J, Mistry J, Coggill PC, Sammut SJ, Hotz HR, Ceric G, Forslund K, Eddy SR, Sonnhammer EL, et al. 2008. The Pfam protein families database. Nucleic Acids Res 36: D281–D288 [DOI] [PMC free article] [PubMed] [Google Scholar]
- Ginalski K, Rychlewski L, Baker D, Grishin NV 2004. Protein structure prediction for the male-specific region of the human Y chromosome. Proc Natl Acad Sci 101: 2305–2310 [DOI] [PMC free article] [PubMed] [Google Scholar]
- Guigó R, Flicek P, Abril JF, Reymond A, Lagarde J, Denoeud F, Antonarakis S, Ashburner M, Bajic VB, Birney E, et al. 2006. EGASP: the human ENCODE Genome Annotation Assessment Project. Genome Biol 7: S2 doi: 10.1186/gb-2006-7-s1-s2 [DOI] [PMC free article] [PubMed] [Google Scholar]
- Hazbun TR, Malmström L, Anderson S, Graczyk BJ, Fox B, Riffle M, Sundin BA, Aranda JD, McDonald WH, Chiu C-H, et al. 2003. Assigning function to yeast proteins by integration of technologies. Mol Cell 12: 1353–1365 [DOI] [PubMed] [Google Scholar]
- Herr JC, Chertihin O, Digilio L, Jha KN, Vemuganti S, Flickinger CJ 2008. Distribution of RNA binding protein MOEP19 in the oocyte cortex and early embryo indicates pre-patterning related to blastomere polarity and trophectoderm specification. Dev Biol 314: 300–316 [DOI] [PMC free article] [PubMed] [Google Scholar]
- Jaroszewski L, Rychlewski L, Li Z, Li W, Godzik A 2005. FFAS03: a server for profile–profile sequence alignments. Nucleic Acids Res 33: W284–W288 [DOI] [PMC free article] [PubMed] [Google Scholar]
- Jones D 1999. Protein secondary structure prediction based on position-specific scoring matrices. J Mol Biol 292: 195–202 [DOI] [PubMed] [Google Scholar]
- Jones D, Ward J 2003. Prediction of disordered regions in proteins from position specific score matrices. Proteins 53: 573–578 [DOI] [PubMed] [Google Scholar]
- Kim DE, Chivian D, Malmström L, Baker D 2005. Automated prediction of domain boundaries in CASP6 targets using Ginzu and RosettaDOM. Proteins (Suppl 7) 61: 193–200 [DOI] [PubMed] [Google Scholar]
- Krogh A, Larsson B, von Heijne G, Sonnhammer E 2001. Predicting transmembrane protein topology with a hidden Markov model: Application to complete genomes. J Mol Biol 305: 567–580 [DOI] [PubMed] [Google Scholar]
- Lee A, Karplus P, Ganem B, Clardy J 1995. Atomic-structure of the buried catalytic pocket of Escherichia-coli chorismate mutase. J Am Chem Soc 117: 3627–3628 [Google Scholar]
- Lee I, Date SV, Adai AT, Marcotte EM 2004. A probabilistic functional network of yeast genes. Science 306: 1555–1558 [DOI] [PubMed] [Google Scholar]
- Lee D, Redfern O, Orengo C 2007. Predicting protein function from sequence and structure. Nat Rev Mol Cell Biol 8: 995–1005 [DOI] [PubMed] [Google Scholar]
- Li W, Godzik A 2006. Cd-hit: a fast program for clustering and comparing large sets of protein or nucleotide sequences. Bioinformatics 22: 1658–1659 [DOI] [PubMed] [Google Scholar]
- Liu J, Rost B 2004. CHOP: parsing proteins into structural domains. Nucleic Acids Res 32: W569–W571 [DOI] [PMC free article] [PubMed] [Google Scholar]
- Liu Y, Zhou J, Omelchenko MV, Beliaev AS, Venkateswaran A, Stair J, Wu L, Thompson DK, Xu D, Rogozin IB, et al. 2003. Transcriptome dynamics of Deinococcus radiodurans recovering from ionizing radiation. Proc Natl Acad Sci 100: 4191–4196 [DOI] [PMC free article] [PubMed] [Google Scholar]
- Lopez G, Valencia A, Tress M 2007. FireDB—a database of functionally important residues from proteins of known structure. Nucleic Acids Res 35: D219–D223 [DOI] [PMC free article] [PubMed] [Google Scholar]
- Lupas A, Vandyke M, Stock J 1991. Predicting coiled coils from protein sequences. Science 252: 1162–1164 [DOI] [PubMed] [Google Scholar]
- Makarova KS, Aravind L, Wolf YI, Tatusov RL, Minton KW, Koonin EV, Daly MJ 2001. Genome of the extremely radiation-resistant bacterium Deinococcus radiodurans viewed from the perspective of comparative genomics. Microbiol Mol Biol Rev 65: 44–79 [DOI] [PMC free article] [PubMed] [Google Scholar]
- Malmström L, Riffle M, Strauss CEM, Chivian D, Davis TN, Bonneau R, Baker D 2007. Superfamily assignments for the yeast proteome through integration of structure prediction with the Gene Ontology. PLoS Biol 5: e76 doi: 10.1371/journal.pbio.0050076 [DOI] [PMC free article] [PubMed] [Google Scholar]
- Marcotte EM, Pellegrini M, Ng HL, Rice DW, Yeates TO, Eisenberg D 1999. Detecting protein function and protein–protein interactions from genome sequences. Science 285: 751–753 [DOI] [PubMed] [Google Scholar]
- Marsden RL, Lewis TA, Orengo CA 2007. Towards a comprehensive structural coverage of completed genomes: a structural genomics viewpoint. BMC Bioinformatics 8: 86 doi: 10.1186/1471-2105-8-86 [DOI] [PMC free article] [PubMed] [Google Scholar]
- Matthews BW 2007. Protein Structure Initiative: getting into gear. Nat Struct Mol Biol 14: 459–460 [DOI] [PubMed] [Google Scholar]
- Murzin AG, Brenner SE, Hubbard T, Chothia C 1995. SCOP: A structural classification of proteins database for the investigation of sequences and structures. J Mol Biol 247: 536–540 [DOI] [PubMed] [Google Scholar]
- Nardini M, Pesce A, Labarre M, Richard C, Bolli A, Ascenzi P, Guertin M, Bolognesi M 2006. Structural determinants in the group III truncated hemoglobin from Campylobacter jejuni. J Biol Chem 281: 37803–37812 [DOI] [PubMed] [Google Scholar]
- Nielsen P, Krogh A 2005. Large-scale prokaryotic gene prediction and comparison to genome annotation. Bioinformatics 21: 4322–4329 [DOI] [PubMed] [Google Scholar]
- Orengo CA, Michie AD, Jones S, Jones DT, Swindells MB, Thornton JM 1997. CATH—a hierarchic classification of protein domain structures. Structure 5: 1093–1108 [DOI] [PubMed] [Google Scholar]
- Ortiz AR, Strauss CE, Olmea O 2002. MAMMOTH (matching molecular models obtained from theory): An automated method for model comparison. Protein Sci 11: 2606–2621 [DOI] [PMC free article] [PubMed] [Google Scholar]
- Pena-Castillo L, Tasan M, Myers C, Lee H, Joshi T, Zhang C, Guan Y, Leone M, Pagnani A, Kim W, et al. 2008. A critical assessment of Mus musculus gene function prediction using integrated genomic evidence. Genome Biol 9: S2 doi: 10.1186/gb-2008-9-s1-s2 [DOI] [PMC free article] [PubMed] [Google Scholar]
- Pieper U, Eswar N, Webb BM, Eramian D, Kelly L, Barkan DT, Carter H, Mankoo P, Karchin R, Marti-Renom MA, et al. 2009. MODBASE, a database of annotated comparative protein structure models and associated resources. Nucleic Acids Res 37: D347–D354 [DOI] [PMC free article] [PubMed] [Google Scholar]
- Rieckmann KH, Davis DR, Hutton DC 1989. Plasmodium vivax resistance to chloroquine? Lancet 2: 1183–1184 [DOI] [PubMed] [Google Scholar]
- Riffle M, Malmström L, Davis TN 2005. The Yeast Resource Center Public Data Repository. Nucleic Acids Res 33: D378–D382 [DOI] [PMC free article] [PubMed] [Google Scholar]
- Rohl CA, Strauss CEM, Misura KMS, Baker D 2004. Protein structure prediction using Rosetta. Methods Enzymol 383: 66–93 [DOI] [PubMed] [Google Scholar]
- Rychlewski L, Jaroszewski L, Li W, Godzik A 2000. Comparison of sequence profiles. Strategies for structural predictions using sequence information. Protein Sci 9: 232–241 [DOI] [PMC free article] [PubMed] [Google Scholar]
- Shannon P, Markiel A, Ozier O, Baliga NS, Wang JT, Ramage D, Amin N, Schwikowski B, Ideker T 2003. Cytoscape: A software environment for integrated models of biomolecular interaction networks. Genome Res 13: 2498–2504 [DOI] [PMC free article] [PubMed] [Google Scholar]
- Troyanskaya OG, Dolinski K, Owen AB, Altman RB, Botstein D 2003. A Bayesian framework for combining heterogeneous data sources for gene function prediction (in Saccharomyces cerevisiae). Proc Natl Acad Sci 100: 8348–8353 [DOI] [PMC free article] [PubMed] [Google Scholar]
- Vinogradov SN, Moens L 2008. Diversity of globin function: Enzymatic, transport, storage, and sensing. J Biol Chem 283: 8773–8777 [DOI] [PubMed] [Google Scholar]
- Vogel C, Berzuini C, Bashton M, Gough J, Teichmann SA 2004. Supra-domains: Evolutionary units larger than single protein domains. J Mol Biol 336: 809–823 [DOI] [PubMed] [Google Scholar]
- Yooseph S, Sutton G, Rusch DB, Halpern AL, Williamson SJ, Remington K, Eisen JA, Heidelberg KB, Manning G, Li W, et al. 2007. The Sorcerer II Global Ocean Sampling expedition: Expanding the universe of protein families. PLoS Biol 5: e16 doi: 10.1371/journal.pbio.0050016 [DOI] [PMC free article] [PubMed] [Google Scholar]
- Zhang Y, Thiele I, Weekes D, Li Z, Jaroszewski L, Ginalski K, Deacon AM, Wooley J, Lesley SA, Wilson IA, et al. 2009. Three-dimensional structural view of the central metabolic network of Thermotoga maritima. Science 325: 1544–1549 [DOI] [PMC free article] [PubMed] [Google Scholar]
- Zhou H, Luo Y, Huang S 2010. Updates of mTOR inhibitors. Anticancer Agents Med Chem 10: 571–581 [DOI] [PMC free article] [PubMed] [Google Scholar]