

Abstract
Context: A relationship between primary hyperparathyroidism (PHPT) and obesity has been observed but is incompletely understood. Furthermore, obesity has been associated with vitamin D deficiency, suggesting that the three conditions may be linked.
Objective: We hypothesized that PHPT in morbidly obese patients is more severe and that the difference may be explained by vitamin D deficiency.
Design and Setting, Participants, and Outcome Measures: Records of 196 patients with surgically treated PHPT and known body mass index (BMI) were examined. Patients were stratified into three BMI groups: group I (nonobese), BMI < 25 kg/m2 (n = 54); group II (non-severely obese), BMI 25–34 kg/m2 (n = 102); and group III (severely obese), BMI 35 kg/m2 or greater (n = 40).
Results: Preoperative PTH levels were higher in group ΙΙΙ compared with group Ι (181 ± 153 vs. 140 ± 80 pg/ml, p = 0.04). Group III patients had larger tumors on average compared with group I (1.8 ± 1.5 vs. 1.04 ± 1.5 g, P = 0.0002). In group III, BMI positively correlated with parathyroid tumor weight (r = 0.5, P = 0.002). Postoperative PTH was higher in group III compared with group Ι (61 ± 41 vs. 44 ± 28 pg/ml, P = 0.02). There was higher frequency of depression, musculoskeletal symptoms, weakness, and gastroesophageal reflux disease in group III patients.
Conclusions: BMI positively correlated with parathyroid tumor weight independent of vitamin D. Severely obese patients have larger parathyroid tumor weight, higher pre- and postoperative PTH, and greater symptoms.
Severely obese primary hyperparathyroidism patients have larger glands and higher levels of parathyroid hormone.
Primary hyperparathyroidism (PHPT) is a common endocrine disorder that affects one in 500 women and one in 2000 men (1). It is most commonly due to a single parathyroid adenoma-secreting PTH. The disease is characterized by combined hypercalcemia and nonsuppressed serum PTH, leading to a wide spectrum of phenotypes ranging from asymptomatic to severe clinical presentations (2).
Obesity has been linked to hyperparathyroidism (HPT). This relationship was initially observed in the context of postmenopausal women with PHPT (3). Subsequently, several studies reproduced this observation across all age and sex groups. In a metaanalysis of 17 studies, PHPT patients had increased weight or body mass index (BMI) in comparison with controls (4). Although obesity is associated with PHPT, the exact underlying mechanism of this association remains unknown. It is possible that obesity may contribute to the development of PHPT through vitamin D deficiency and the consequent autonomous stimulation and growth of the parathyroid gland(s). Alternatively, PHPT has been suggested to contribute to the development of obesity. In fact, due to the high frequency of obesity observed in PHPT patients, some authors consider obesity a feature of PHPT (3).
Factors associated with the course and severity of PHPT are incompletely understood. Vitamin D acts to suppress transcription and secretion of PTH from bovine parathyroid glands (5,6), and its deficiency could result in high levels of PTH secretion in humans. Vitamin D deficiency is a known cause of secondary HPT and in areas in which vitamin D deficiency is endemic (e.g. India), PHPT has very severe disease manifestations, including high PTH, osteitis fibrosa cystic, and very large parathyroid adenomas (7). In the United States, patients with concurrent PHPT and vitamin D deficiency have more severe PHPT, with higher PTH, serum calcium, alkaline phosphatase, and larger adenomas (8). Several studies have demonstrated a link between vitamin D deficiency and larger parathyroid tumors, suggesting a role for vitamin D deficiency in parathyroid growth (9,10). However, others have found no significant relationship between 25-hydroxyvitamin D (25-OH D) and parathyroid tumor weight after adjusting for covariates such as BMI (11).
Obese individuals are at greater risk for both vitamin D deficiency (12,13) and may be predisposed to PHPT (3,4). Because vitamin D deficiency is associated with severe HPT, we postulated that severely obese patients with PHPT have a more severe disease phenotype due to concurrent vitamin D deficiency alone. To explore this possibility, we evaluated the clinical features of nonobese, nonseverely obese, and severely obese patients who had surgery for PHPT and found that patients with severe obesity have features of more severe PHPT independent of vitamin D status.
Patients and Methods
This study included 196 patients (aged 22–87 yr) with PHPT and known BMI who had parathyroidectomy for PHPT at Duke University Medical Center between April 26, 2005, and April 16, 2009. Of the 196 patients, 186 had single gland disease and 10 patients had multigland disease. Patients were excluded if they had multiple endocrine neoplasia. The diagnosis of PHPT was based on standard clinical criteria, biochemical findings, and postoperative histopathological examination. Symptom history was collected from medical records. Patients were considered symptomatic if they had any symptoms of PHPT, including fatigue, musculoskeletal complaints, neurocognitive manifestations, bone disease, or nephrolithiasis. Patients with PHPT and vitamin D deficiency did not have routine preoperative vitamin D repletion due to concern for eliciting hypercalcemia. Indications for surgery included symptomatic PHPT or asymptomatic PHPT with one or more criteria for surgery as defined by the National Institutes of Health consensus conference guidelines (14). All patients were operated on by one of three endocrine surgeons.
BMI was calculated as weight in kilograms divided by height in square meters. Patients were divided into three groups for this analysis based on their BMI: group I, nonobese, BMI less than 25 kg/m2 (n = 54); group II, non-severely obese, BMI 25–35 kg/m2 (n = 102); and group III, severely obese, BMI 35 kg/m2 or greater (n = 40). Patients’ demographics and clinical values (such as BMI, laboratory findings, and localization studies) were recorded prospectively. Imaging results were not used for selection of patients for surgery. Follow-up biochemical parameters including serum calcium and intact PTH were measured at 1 wk and 1–41 months postoperatively. We defined vitamin D deficiency as serum 25-OH D levels of less than 20 ng/ml and vitamin D nondeficiency as levels 20 ng/ml or greater.
All specimens underwent routine pathological assessment. Histopathological re-review was performed on a subset of 42 available cases. Formalin-fixed and paraffin-embedded parathyroid tumors were sectioned at 5 μm thickness, stained with hematoxylin and eosin, and reviewed for cell type and percent fat content. The percent fat content was graded according to the proportion of fat to the whole section.
Statistical analyses were performed with SAS version 9.1.3 (SAS Institute, Cary, NC) and GraphPad Prism 4 (GraphPad Inc., San Diego, CA). The relationship between BMI and tumor weight was assessed using linear regression and correlation. The significance of the slope for BMI was obtained with and without adjustment for the covariates age, gender, race (white, nonwhite), and vitamin D. The correlation of BMI and tumor weight was obtained. Partial correlations were computed, adjusting for the covariates. The relationship between BMI and tumor weight was examined by category of BMI (<25, 25–34, ≥ 35 kg/m2) in separate regression models. In addition, the significance of the difference in the slopes was assessed by testing an interaction term for BMI category with BMI in a model containing both terms. Groups were compared using ANOVA with posttest analysis. Categorical data were assessed by χ2 tests. For all analyses, a P ≤ 0.05 was considered to indicate statistical significance. All results are expressed as means ± sd unless otherwise specified.
Results
The demographic characteristics for the entire cohort of 196 patients studied are listed in Table 1. There was no difference in mean age, sex, or race distribution among the BMI groups. As expected, both mean and median BMI were significantly different among the three BMI groups.
Table 1.
Study population (n = 196)
| Variable | Group I (BMI < 25 kg/m2) (n = 54) | Group II (BMI 25–35 kg/m2) (n = 102) | Group III (BMI > 35 kg/m2) (n = 40) | P value |
|---|---|---|---|---|
| Age (yr) | 59 ± 14 | 60 ± 13 | 56 ± 12 | NS |
| Sex | ||||
| Female | 45 (83%) | 81 (79%) | 34 (85%) | NS |
| Male | 9 (17%) | 21 (21%) | 6 (15%) | |
| Race | ||||
| White | 41 (76%) | 67 (66%) | 22 (55%) | NS |
| A.A. | 9 (16%) | 32 (31%) | 18 (45%) | |
| Other | 3 | 2 | ||
| BMI | ||||
| Mean | 22.3 ± 2 | 29.5 ± 3 | 40.7 ± 5 | <0.0001 |
| Median | 23 ± 2 | 29.4 ± 3 | 39.4 ± 5 | |
| Multi-gland Patients | 3 | 5 | 2 | NS |
Age is shown in mean ± sd. NS, Not significant; n, number of patients.
Other includes: group I (two Asians and unknown), group II (one Asian and one Native American).
Overall, 94% (184 of 186) of the patients were symptomatic. PHPT-specific symptoms for all of the groups are depicted in Fig. 1. Compared with group I, group III presented with greater frequency of depression [45% (17 of 38) vs. 23% (11 of 53), P = 0.04], musculoskeletal symptoms [58% (22 of 38) vs. 33% (16 of 49), P = 0.03], weakness complaints [18% (seven of 38) vs. 2% (one of 49), P = 0.02], and symptoms of gastroesophageal reflux disease [34% (13 of 38) vs. 12% (six of 49), P = 0.02]. There was a tendency toward a more severe presentation increasingly associated with higher BMI that did not reach statistical significance with fatigue reported in [53% (26 of 49), 60% (58 of 96), and 68% (26 of 38) for groups I, II, and III, respectively]. Conversely, osteoporosis was documented more in patients of group I [49% (24 of 49)] compared with patients of groups II [25% (24 of 96)] and III [16% (six of 38), P = 0.001]. Presenting symptoms including constipation, nephrolithiasis, and cognitive impairment were similar between groups.
Figure 1.

Primary hyperparathyroidism-specific symptom distribution. GERD, Gastroesophageal reflux disease. ‡, P = 0.03; *, P = 0.02; ¥, P = 0.02; γ, P = 0.04; §, P = 0.001.
Preoperative biochemical data for the patients including calcium, intact PTH, and 25-OH D levels are shown in Table 2. Preoperative ionized and total calcium as well as alkaline phosphatase were not different among BMI groups. Preoperative PTH was significantly lower in group Ι compared with group ΙΙΙ (140 ± 80 vs. 181 ± 153 pg/ml, P = 0.04) but not to group II (167 ± 128 pg/ml). Preoperative 25-OH D was also higher in group I compared with group III (29 ± 10 vs. 23 ± 12, P = 0.01) and in group II compared with group III (28 ± 14 vs. 23 ± 12, P = 0.02). Similarly, there was a trend toward fewer vitamin D-deficient patients [n = 11 (21%)] in group I compared with groups II [n = 26 (26%)] and III [n = 15 (42%), P = 0.08].
Table 2.
Laboratory data
| Measurement/Study | Group I (BMI < 25 kg/m2) (n = 54) | Group II (BMI 25–35 kg/m2) (n = 102) | Group III (BMI > 35 kg/m2) (n = 40) | P value |
|---|---|---|---|---|
| Preoperative calcium | ||||
| Total (mg/dl) | 10.9 ± 0.94 | 11.1 ± 0.82 | 11 ± 0.6 | NS |
| Ionized (mmol/liter) | 1.45 ± 0.11 | 1.46 ± 0.13 | 1.43 ± 0.1 | NS |
| Preoperative PTH (pg/ml) | 140 ± 80 | 166 ± 128 | 181 ± 153 | |
| Alkaline phosphatase (U/liter) | 149 ± 323 | 102 ± 39 | 109 ± 36 | NS |
| Preoperative 25-OH D (ng/ml) | 29 ± 10 | 28 ± 14 | 23 ± 12 | |
| Postoperative calcium (mg/dl) | 9.4 ± 0.5 | 9.3 ± 0.5 | 9.3 ± 0.9 | NS |
| Postoperative PTH (mg/dl) | 44 ± 28 | 57 ± 41 | 61 ± 41 | |
Data are shown as mean ± sd. NS, Not significant; n, number of patients.
Group I vs. group III (P = 0.04).
Group I vs. group III (P = 0.01) and group II vs. group III (P = 0.02).
Group I vs. group III (P = 0.02).
For all of the patients, preoperative ultrasound accurately localized 85% (174 of 205) of the abnormal glands, compared with 79% (160 of 202) using sestamibi scanning (P = 0.2). When considering the positivity of either of the studies, 90% (187 of 209) of the abnormal glands were accurately localized preoperatively. Per individual BMI group, preoperative ultrasonography accurately identified 83% (44 of 53) of the enlarged parathyroid glands in group I, 86% (94 of 109) in group II, and 84% (36 of 43) in group III (P = 0.8). Preoperative sestamibi scanning performance was similar across groups [89% (46 of 52), 76% (81 of 107), and 78% (33 of 43), respectively; P = 0.2].
For the entire group of 196 patients, the mean parathyroid tumor weight was 1.2 ± 1.4 g, whereas the median was 0.7 g. The tumor weight was distributed as follows: group I, 1.04 ± 1.5 g; group II, 1.08 ± 1.2 g; and group III, 1.8 ± 1.5 g. Group III patients had larger tumors on average, compared with both group I and II patients (P < 0.0004) (Fig. 2). As a continuous variable across all groups, BMI positively correlated with adenoma weight (r = 0.3, P < 0.001, Fig. 3A). When we adjusted for potential confounders including preoperative vitamin D, age, race, and sex, the BMI-tumor weight relationship remained significant (r = 0.2, P = 0.005). The relationship between BMI and tumor weight within each of the BMI groups was as follows: group I, r = 0.02, P = 0.9; group II, r = 0.2, P = 0.06; and group III, r = 0.5, P = 0.002 (P = 0.4). The BMI-tumor weight relationship in group III was significant after adjusting for either preoperative vitamin D (r = 0.46, P = 0.002) or preoperative vitamin D, age, sex, and race (r = 0.44, P = 0.01).
Figure 2.
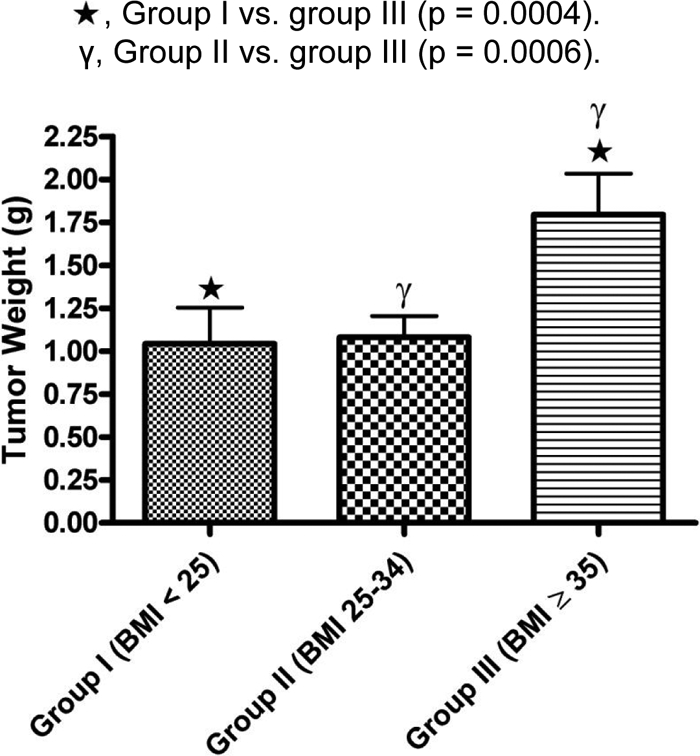
Mean parathyroid tumor weight distribution across the three BMI groups. Star, Group I vs. group III (P = 0.0004); γ, group II vs. group III (P = 0.0006).
Figure 3.

Relationship between BMI and tumor weight (A), preoperative 25-OH D (B), and preoperative serum PTH (C). A, r = 0.3, P < 0.001; B, r = 0.2, P = 0.02; C, r = 0.1, P = 0.2.
To explore whether vitamin D status could explain the relationship between BMI and parathyroid tumor weight, we correlated BMI with 25-OH D, and subsequently 25-OH D with tumor weight. As a continuous variable across all 196 patients, BMI negatively correlated with preoperative 25-OH D levels (r = 0.2, P = 0.02) (Fig. 3B). Preoperative 25-OH D also correlated inversely with parathyroid tumor weight (r = 0.2, P = 0.049). However, after adjusting for potential confounders including BMI, age, and race, the inverse relationship between 25-OH D and tumor weight became insignificant. When adjusting for BMI only, our observed inverse relationship between the 25-OH D and tumor weight was no longer significant, suggesting a direct relationship between BMI and tumor weight independent of vitamin D status.
Upon examination of hematoxylin and eosin-stained PHPT tumor sections (n = 42), percent fat content varied from less than 5 to 90% (Fig. 4). As a continuous variable, the BMI did not correlate with percent tumor fat content (P = 0.5). To compare the distribution of the tumor fat content, we divided the patients into two groups: BMI less than 35 kg/m2 (n = 10) and BMI 35 kg/m2 or greater (n = 32). Tumor fat content was similar in the two groups (BMI < 35 and BMI ≥ 35 kg/m2), at 8 ± 17 and 10 ± 28%, respectively (P = 0.8). Furthermore, we stratified the tumors into those with minimal fat content (≤10%, n = 35) and those with high fat content (>20%, n = 7). Again, BMI was similar in these two groups (30 ± 4 vs. 30 ± 7, P = 0.8).
Figure 4.

Representative hematoxylin and eosin-stained parathyroid tumor sections. Resected gland with fat content less than 5% and corresponding BMI of 42% (A), fat content 20% and corresponding BMI of 31 kg/m2 (B), and fat content 90% and corresponding BMI of 36 kg/m2 (C).
To examine whether tumor weight can be used as a surrogate for disease severity, we studied the relationship between tumor weight and the biochemical indices. Parathyroid tumor weight significantly correlated with preoperative PTH (P = 0.002), total calcium (P = 0.02), and alkaline phosphatase (P = 0.02). BMI did not correlate with preoperative total calcium (r < 0.01, P = 0.9) or PTH (r = 0.1, P = 0.2, Fig. 3C).
No differences were observed in the baselines or immediate postresection PTH values between patients in BMI groups I, II, and III. However, intraoperative PTH was marginally but not significantly higher in group ΙΙΙ compared with group Ι patients (282 ± 280 vs. 218 ± 176 pg/ml, respectively; P = 0.05). The degree of PTH decline from baseline was not different between the three groups. However, as a continuous variable, BMI correlated with percent decrease of intraoperative PTH at 5 min after resection (P = 0.047) but not with the decay at 10 min after resection (P = 0.1), which may simply reflect the higher PTH at baseline 1 in patients with high BMI.
At a 4-month median of postoperative follow-up, patients in the BMI group III had higher mean PTH (61 ± 41 pg/ml) compared with group I (44 ± 28 pg/ml) (P = 0.02) but not to group ΙΙ (57 ± 41 pg/ml). The percentage of patients who had a PTH out of the normal range (>72 pg/ml) was not significantly different among the BMI groups [14% (seven of 50), 25% (24 of 97), and 28% (11 of 40) in groups I, II, and III, respectively, P = 0.2]. At the same postoperative follow-up period (median of 4 months), the total serum calcium was similar across the three groups (9.4 ± 0.5, 9.3 ± 0.5, and 9.3 ± 0.9 mg/dl, respectively; P = 0.9). The overall cure rate (as defined by postoperative serum calcium) was 96% at a median follow-up of 4 months.
Discussion
This study of 196 patients suggests that increasing BMI is associated with parathyroid tumor weight and that morbidly obese patients (BMI ≥ 35 kg/m2) have higher pre- and postoperative serum PTH, larger parathyroid tumors, and a more symptomatic presentation. Importantly, the relationship between BMI and tumor weight remains significant after adjusting for potential confounders including preoperative serum 25-OH D. This finding advocates for a direct relationship between obesity and PHPT, regardless of vitamin D status, and implies an independent role for severe obesity in the disease.
Although numerous studies have reported and documented the association between PHPT and obesity (3,4), very few studies have focused on the impact of obesity on PHPT characteristics and manifestations. In a study of 171 PHPT patients, Moosgaard et al. (11) showed that increasing BMI is associated with larger parathyroid adenoma weight. This observation along with our findings suggests a relationship between obesity and parathyroid tumor growth that is not mediated by vitamin D deficiency.
Chronic vitamin D deficiency may lead to parathyroid hyperplasia and adenoma growth (9,15), and in parts of the world in which vitamin D deficiency is endemic, there is a higher prevalence of larger parathyroid tumors (7). In the current study, preoperative 25-OH D is inversely related to tumor weight. However, this relationship became insignificant when adjusting for BMI. This is in discordance with the majority of studies showing that 25-OH D inversely correlated with parathyroid tumor weight (8,9,10). The negative correlation between 25-OH D and obesity could conceivably explain our reported link between obesity and larger tumor on one hand and between PHPT and obesity on the other hand. Nonetheless, in this study we did not find a significant relationship between 25-OH D and tumor weight after adjusting for BMI, suggesting an independent role for BMI in parathyroid growth. In agreement with this observation, Moosgaard et al. (11) reported an insignificant relationship between 25-OH D and parathyroid weight after adjusting for covariates including BMI. The reason for the discrepancy between this finding and the majority of studies may be due to the fact that many of previous studies did not adjust for potential confounders (e.g. BMI).
Owing to the high variability of fat content from one parathyroid adenoma to another (Fig. 4), we thought to examine whether morbid obesity is associated with adenoma fat content and therefore to exclude the potential confounding effect of fat content in the relationship between BMI and gland weight. We found that BMI does not correlate with tumor fat content, and the tumor fat content/mass was similar between the severely and non-severely obese patients. Additionally, there is mounting evidence that BMI or obesity correlates with serum PTH in normal individuals and patients with secondary HPT (16,17), suggesting a functional relationship between obesity and the parathyroid glands. Based on this result and our data, it is unlikely that our reported relationship between obesity and larger parathyroid tumor weight can be attributed to an increased fat deposition in the glands.
The mechanistic connection between obesity and parathyroid tumor weight/growth is unknown. However, several epidemiological studies have linked obesity to the development of various tumors. Obese women have a 6-fold higher risk of developing endometrial cancer compared with lean women (18), and obesity has been attributed to 39% of the endometrial cancers in Europe (19). Similar increased risk has also been found in cancers of the breast, kidney, gallbladder, and colon (19,20). Moreover, obese men with prostate cancer have higher prostatic-specific antigen and increased rate of recurrence and death after radical prostatectomy (21,22). In a large study of 2302 prostatic cancer patients, Freedland et al. (23) and others have reported that BMI independently associates with tumor volume and high-grade disease; patients with severe obesity (BMI ≥ 35 kg/m2) had 40% larger tumor volume than normal-weight patients. Although it is well known that obesity is associated with the development of tumors, the mechanism of this association is unclear.
It has been suggested that the association of obesity with a more aggressive tumor phenotype is, at least in part, due to the mitogenic effect of the higher levels of sex hormones and/or insulin in obese patients (23). It has been suggested that the propensity of obese individuals to develop breast and endometrial cancers may be due to the elevated levels of estrogen generated by adipocyte-rich peripheral tissues. The human parathyroid gland expresses estrogen receptor-α and -β (24,25). Estradiol treatment results in increased PTH secretion in both in vitro and in vivo settings (26,27,28,29). However, very limited data are available regarding the effect of estradiol on parathyroid growth. Wong et al. (25) have reported that tamoxifen and ICI 182,780 (an estrogen receptor antagonist) decreased DNA synthesis in the parathyroid in a dose-dependent fashion. Furthermore, free IGF-I has been found to be higher in obese people than in normal controls (30). IGF-I and IGF-II are polypeptide hormones that play an important role in development and growth with an overall mitogenic effect. It has been proposed that IGF-I and IGF-II are involved in parathyroid growth regulation (31,32). In a study of nine cultured human parathyroid cell preparations, the addition of either IGF-I or IGF-II to the media increased DNA synthesis by 163 and 131%, respectively (33). These results suggest that estrogen and/or IGF-I/II may potentially mediate parathyroid tumor growth and could represent a mechanism for the obesity-tumor weight association documented here. Additionally, it is possible that severely obese patients may have end-organ resistance to PTH as a result of increased skeletal mass (34) and therefore requiring higher PTH levels than the non-severely obese patients.
Although our data show that severe obesity associates with elevated pre- and postoperative PTH, heavier gland weight, and a more severe symptomatic presentation, we did not find a difference in pre- and postoperative serum calcium between our different BMI groups. This is in contrast to the currently prevailing assumption that the level of serum calcium is the main determinant of PHPT severity, and thereby it can be used as a criterion to indicate surgery (35). However, there is a growing body of evidence to explain and support our observation that preoperative serum calcium does not reflect the severity of PHPT (36,37). In a cohort of 155 PHPT patients, Burney et al. (38) found no difference in PHPT-specific symptoms and postsurgical improvements between patients with high and low preoperative serum calcium. Others have found that PHPT patients with lower preoperative serum calcium may have more severe symptoms (39). Alternatively, many of the symptoms of HPT are nonspecific, and it is quite possible that obesity itself is contributing to the symptoms in these individuals, confounding our findings.
Interestingly, our data also show that osteoporosis was less prevalent in the severely obese group. This finding could be explained by the anabolic effect of the higher levels of PTH and/or estrogen in these patients population. Alternatively, mechanical loading effects due to their heavy body weight could potentially improve bone mass, decreasing the frequency of osteoporosis in this population. Another possibility is that severely obese patients may have skeletal resistance to the resorptive effect of the PTH.
A limitation to our study is that we did not have a BMI-matched, non-PHPT control, which makes it difficult to attribute the reported symptoms exclusively to PHPT because these symptoms may well associate with obesity, regardless of PHPT disease status. However, we must also recognize the fact that the symptoms evaluated here have been considered as parathyroid-specific symptoms (38), and treatment decisions are often based on the presence or absence of these symptoms in any patient with PHPT, regardless of morbid obesity. Another caveat is that we did not control for vitamin D supplementation in our study. It is possible that our recorded 25-OH D levels may not reflect actual patients’ vitamin D status at the time their PHPT developed or was diagnosed. Nevertheless, at the time of treatment for the study cohort, it was not our practice or the practice of our referring endocrinologists to supplement vitamin D before surgery.
Conclusions
In this study of 196 PHPT patients, we establish a positive correlation between severe obesity and parathyroid tumor weight. Based on our work and previous findings, we believe that obesity may impact tumor growth independent of vitamin D status. Severely obese patients (BMI ≥ 35 kg/m2) have a more severe disease phenotype as evidenced by larger parathyroid tumor weight, higher pre- and postoperative PTH, and greater symptoms.
Acknowledgments
The authors gratefully acknowledge the help of Ms. Cynthia Webb for the database support of this study.
Footnotes
Disclosure Summary: The authors have nothing to declare.
First Published Online August 4, 2010
Abbreviations: BMI, Body mass index; HPT, hyperparathyroidism; 25-OH D, 25-hydroxyvitamin D; PHPT, primary hyperparathyroidism.
References
- Ruda JM, Hollenbeak CS, Stack Jr BC 2005 A systematic review of the diagnosis and treatment of primary hyperparathyroidism from 1995 to 2003. Otolaryngol Head Neck Surg 132:359–372 [DOI] [PubMed] [Google Scholar]
- Bilezikian JP, Silverberg SJ 2000 Clinical spectrum of primary hyperparathyroidism. Rev Endocr Metab Disord 1:237–245 [DOI] [PubMed] [Google Scholar]
- Grey AB, Evans MC, Stapleton JP, Reid IR 1994 Body weight and bone mineral density in postmenopausal women with primary hyperparathyroidism. Ann Intern Med 121:745–749 [DOI] [PubMed] [Google Scholar]
- Bolland MJ, Grey AB, Gamble GD, Reid IR 2005 Association between primary hyperparathyroidism and increased body weight: a meta-analysis. J Clin Endocrinol Metab 90:1525–1530 [DOI] [PubMed] [Google Scholar]
- Russell J, Lettieri D, Sherwood LM 1986 Suppression by 1,25(OH)2D3 of transcription of the pre-proparathyroid hormone gene. Endocrinology 119:2864–2866 [DOI] [PubMed] [Google Scholar]
- Brown AJ, Ritter C, Slatopolsky E, Muralidharan KR, Okamura WH, Reddy GS 1999 1α,25-Dihydroxy-3-epi-vitamin D3, a natural metabolite of 1α,25-dihydroxyvitamin D3, is a potent suppressor of parathyroid hormone secretion. J Cell Biochem 73:106–113 [PubMed] [Google Scholar]
- Harinarayan CV, Gupta N, Kochupillai N 1995 Vitamin D status in primary hyperparathyroidism in India. Clin Endocrinol (Oxf) 43:351–358 [DOI] [PubMed] [Google Scholar]
- Untch BR, Barfield ME, Dar M, Dixit D, Leight Jr GS, Olson Jr JA 2007 Impact of 25-hydroxyvitamin D deficiency on perioperative parathyroid hormone kinetics and results in patients with primary hyperparathyroidism. Surgery 142:1022–1026 [DOI] [PubMed] [Google Scholar]
- Rao DS, Honasoge M, Divine GW, Phillips ER, Lee MW, Ansari MR, Talpos GB, Parfitt AM 2000 Effect of vitamin D nutrition on parathyroid adenoma weight: pathogenetic and clinical implications. J Clin Endocrinol Metab 85:1054–1058 [DOI] [PubMed] [Google Scholar]
- Ozbey N, Erbil Y, Ademoğlu E, Ozarmagan S, Barbaros U, Bozbora A 2006 Correlations between vitamin D status and biochemical/clinical and pathological parameters in primary hyperparathyroidism. World J Surg 30:321–326 [DOI] [PubMed] [Google Scholar]
- Moosgaard B, Vestergaard P, Heickendorff L, Melsen F, Christiansen P, Mosekilde L 2006 Plasma 25-hydroxyvitamin D and not 1,25-dihydroxyvitamin D is associated with parathyroid adenoma secretion in primary hyperparathyroidism: a cross-sectional study. Eur J Endocrinol 155:237–244 [DOI] [PubMed] [Google Scholar]
- Liel Y, Ulmer E, Shary J, Hollis BW, Bell NH 1988 Low circulating vitamin D in obesity. Calcif Tissue Int 43:199–201 [DOI] [PubMed] [Google Scholar]
- Need AG, Morris HA, Horowitz M, Nordin C 1993 Effects of skin thickness, age, body fat, and sunlight on serum 25-hydroxyvitamin D. Am J Clin Nutr 58:882–885 [DOI] [PubMed] [Google Scholar]
- Bilezikian JP, Potts Jr JT, Fuleihan Gel H, Kleerekoper M, Neer R, Peacock M, Rastad J, Silverberg SJ, Udelsman R, Wells SA 2002 Summary statement from a workshop on asymptomatic primary hyperparathyroidism: a perspective for the 21st century. J Clin Endocrinol Metab 87:5353–5361 [DOI] [PubMed] [Google Scholar]
- Lumb GA, Stanbury SW 1974 Parathyroid function in human vitamin D deficiency and vitamin D deficiency in primary hyperparathyroidism. Am J Med 56:833–839 [DOI] [PubMed] [Google Scholar]
- Saab G, Whaley-Connell A, McFarlane SI, Li S, Chen SC, Sowers JR, McCullough PA, Bakris GL 2010 Obesity is associated with increased parathyroid hormone levels independent of glomerular filtration rate in chronic kidney disease. Metabolism 59:385–389 [DOI] [PubMed] [Google Scholar]
- Kamycheva E, Sundsfjord J, Jorde R 2004 Serum parathyroid hormone level is associated with body mass index. The 5th Tromso study. Eur J Endocrinol 151:167–172 [DOI] [PubMed] [Google Scholar]
- Lindemann K, Vatten LJ, Ellstrøm-Engh M, Eskild A 2008 Body mass, diabetes and smoking, and endometrial cancer risk: a follow-up study. Br J Cancer 98:1582–1585 [DOI] [PMC free article] [PubMed] [Google Scholar]
- Bergström A, Pisani P, Tenet V, Wolk A, Adami HO 2001 Overweight as an avoidable cause of cancer in Europe. Int J Cancer 91:421–430 [DOI] [PubMed] [Google Scholar]
- Carroll KK 1998 Obesity as a risk factor for certain types of cancer. Lipids 33:1055–1059 [DOI] [PubMed] [Google Scholar]
- Freedland SJ, Grubb KA, Yiu SK, Humphreys EB, Nielsen ME, Mangold LA, Isaacs WB, Partin AW 2005 Obesity and risk of biochemical progression following radical prostatectomy at a tertiary care referral center. J Urol 174:919–922 [DOI] [PubMed] [Google Scholar]
- Calle EE, Rodriguez C, Walker-Thurmond K, Thun MJ 2003 Overweight, obesity, and mortality from cancer in a prospectively studied cohort of U.S. adults. N Engl J Med 348:1625–1638 [DOI] [PubMed] [Google Scholar]
- Freedland SJ, Bañez LL, Sun LL, Fitzsimons NJ, Moul JW 2009 Obese men have higher-grade and larger tumors: an analysis of the duke prostate center database. Prostate Cancer Prostatic Dis 12:259–263 [DOI] [PubMed] [Google Scholar]
- Sandelin K, Skoog L, Humla S, Farnebo LO 1992 Oestrogen, progesterone, and glucocorticoid receptors in normal and neoplastic parathyroid glands. Eur J Surg 158:467–472 [PubMed] [Google Scholar]
- Wong C, Lai T, Hilly JM, Stewart CE, Farndon JR 2002 Selective estrogen receptor modulators inhibit the effects of insulin-like growth factors in hyperparathyroidism. Surgery 132:998–1006; discussion 1006–1007 [DOI] [PubMed] [Google Scholar]
- Boucher A, D'Amour P, Hamel L, Fugère P, Gascon-Barré M, Lepage R, Ste-Marie LG 1989 Estrogen replacement decreases the set point of parathyroid hormone stimulation by calcium in normal postmenopausal women. J Clin Endocrinol Metab 68:831–836 [DOI] [PubMed] [Google Scholar]
- Naveh-Many T, Almogi G, Livni N, Silver J 1992 Estrogen receptors and biologic response in rat parathyroid tissue and C cells. J Clin Invest 90:2434–2438 [DOI] [PMC free article] [PubMed] [Google Scholar]
- Greenberg C, Kukreja SC, Bowser EN, Hargis GK, Henderson WJ, Williams GA 1987 Parathyroid hormone secretion: effect of estradiol and progesterone. Metabolism 36:151–154 [DOI] [PubMed] [Google Scholar]
- Zofková I, Röjdmark S, Kancheva RL 1993 Does estrogen replacement therapy influence parathyroid hormone responsiveness to exogenous hypercalcemia in postmenopausal women? J Endocrinol Invest 16:323–327 [DOI] [PubMed] [Google Scholar]
- Nam SY, Lee EJ, Kim KR, Cha BS, Song YD, Lim SK, Lee HC, Huh KB 1997 Effect of obesity on total and free insulin-like growth factor (IGF)-1, and their relationship to IGF-binding protein (BP)-1, IGFBP-2, IGFBP-3, insulin, and growth hormone. Int J Obes Relat Metab Disord 21:355–359 [DOI] [PubMed] [Google Scholar]
- Tanaka R, Tsushima T, Murakami H, Shizume K, Obara T 1994 Insulin-like growth factor I receptors and insulin-like growth factor-binding proteins in human parathyroid tumors. World J Surg 18:635–641; discussion 641–642 [DOI] [PubMed] [Google Scholar]
- Sadler GP, Jones DL, Woodhead JS, Horgan K, Wheeler MH 1996 Effect of growth factors on growth of bovine parathyroid cells in serum-free medium. World J Surg 20:822–828; discussion 828–829 [DOI] [PubMed] [Google Scholar]
- Wong CK, Lai T, Holly JM, Wheeler MH, Stewart CE, Farndon JR 2006 Insulin-like growth factors (IGF) I and II utilize different calcium signaling pathways in a primary human parathyroid cell culture model. World J Surg 30:333–345 [DOI] [PubMed] [Google Scholar]
- Hamoui N, Anthone G, Crookes PF 2004 Calcium metabolism in the morbidly obese. Obes Surg 14:9–12 [DOI] [PubMed] [Google Scholar]
- 1991 NIH conference. Diagnosis and management of asymptomatic primary hyperparathyroidism: consensus development conference statement. Ann Intern Med 114:593–597 [DOI] [PubMed] [Google Scholar]
- Bergenfelz A, Lindblom P, Lindergård B, Valdemarsson S, Westerdahl J 2003 Preoperative normal level of parathyroid hormone signifies an early and mild form of primary hyperparathyroidism. World J Surg 27:481–485 [DOI] [PubMed] [Google Scholar]
- Berger AD, Wu W, Eisner BH, Cooperberg MR, Duh QY, Stoller ML 2009 Patients with primary hyperparathyroidism—why do some form stones? J Urol 181:2141–2145 [DOI] [PubMed] [Google Scholar]
- Burney RE, Jones KR, Christy B, Thompson NW 1999 Health status improvement after surgical correction of primary hyperparathyroidism in patients with high and low preoperative calcium levels. Surgery 125:608–614 [PubMed] [Google Scholar]
- Repplinger D, Schaefer S, Chen H, Sippel RS 2009 Neurocognitive dysfunction: a predictor of parathyroid hyperplasia. Surgery 146:1138–1143 [DOI] [PMC free article] [PubMed] [Google Scholar]