

Abstract
Since the functional role(s) of angiotensin II (Ang II) type II receptor (AT2R) in type I diabetes is unknown, we hypothesized that AT2R is involved in decreasing the effects of type I diabetes on the kidneys. We induced diabetes with low-dose streptozotocin (STZ) in both AT2R knockout (AT2RKO) and wild-type (WT) male mice aged 12 weeks and followed them for 4 weeks. Three subgroups nondiabetic, diabetic, and insulin-treated diabetic (Rx insulin implant) were studied. Systolic blood pressure (SBP), physiological parameters, glomerular filtration rate (GFR), renal morphology, gene expression, and apoptosis were assessed. After 4 weeks of diabetes, compared to WT controls, AT2RKO mice clearly developed features of early diabetic nephropathy (DN), such as renal hypertrophy, tubular apoptosis, and progressive extracellular matrix (ECM) protein accumulation as well as increased GFR. AT2RKO mice presented hypertension unaffected by diabetes. Renal oxidative stress (measured as heme oxygenase 1 (HO-1) gene expression and reactive oxygen species (ROS) generation) and intrarenal renin angiotensin system components, such as angiotensinogen (Agt), AT1R, and angiotensin-converting enzyme (ACE) gene expression, were augmented whereas angiotensin-converting enzyme2 (ACE2) gene expression was decreased in renal proximal tubules (RPTs) of AT2RKO mice. The renal changes noted above were significantly enhanced in diabetic AT2RKO mice but partially attenuated in insulin-treated diabetic WT and AT2RKO mice. In conclusion, AT2R deficiency accelerates the development of DN, which appears to be mediated, at least in part, via heightened oxidative stress and ACE/ACE2 ratio in RPTs.
1. Introduction
Diabetic nephropathy (DN) is the single major cause of end-stage renal failure in North America [1, 2]. Among the multiple risk factors contributing to diabetic renal disease, the renin-angiotensin system (RAS), a coordinated hormonal cascade that has major physiological and pathological effects on the cardiovascular and renal functions, is one of the most important systems affecting DN development and progression [3–5].
Although chronic treatment with RAS blockers is effective in controlling hypertension and retarding DN progression, it is not a cure, indicating that the mechanisms of renal protection by RAS blockers in diabetes are far from being completely understood, and the discovery of additional therapeutic pathways as potential drug targets is of paramount importance [2, 6].
Intrarenal angiotensin II (Ang II), a principal effector of the RAS that is increased in DN, acts through 2 major angiotensin receptors, Ang II type I receptor (AT1R) and AT2R, and may be involved in dysfunctional responses in the diabetic kidney [3–5]. For instance, Ang II effects within the kidney are mediated by AT1R and include cellular dedifferentiation and proliferation, renal hypertrophy and apoptosis, vasoconstriction and heightened renal and tubular sodium resorption. In contrast to the well-established functional impact of AT1R in DN, the functional role of AT2R in the development of nephropathy in type I diabetes is incompletely understood. AT2R activation appears to suppress renin biosynthesis and release from renal juxtaglomerular cells, leading to vasodilatation and natriuresis, both of which may reduce blood pressure (BP) [3–5].
In the kidneys, AT2R expression in both embryonic and mature stages (i.e., glomerular endothelial cells, podocytes, tubular epithelial cells, and inner medullary collecting ducts) is known and well defined [7]. AT2R-deficient mice (i.e., AT2R knockout, AT2RKO) display a phenotype similar to that of humans with congenital renal and urinary tract anomalies [8, 9] and incur hypertension in adulthood [8]. These phenotypes highlight the importance of AT2R in normal kidney development and BP regulation, but understanding how AT2R is regulated remains elusive.
An additional component of the RAS family, angiotensin-converting enzyme2 (ACE2) [10, 11], shares 42% homology with angiotensin-converting enzyme (ACE) but has different biochemical activities. ACE2 specifically cleaves Ang I and Ang II into Ang 1-9 and Ang 1-7, respectively. Since ACE2 and ACE are coexpressed in many tissues, and ACE2 expression is both cardio- and renoprotective, acting in a counterregulatory manner to ACE in both experimental animals and humans, alterations in their activities and the ACE/ACE2 ratio may participate in hypertension and renal disease [12–14]. Whether AT2R and ACE2 interact in diabetes, including DN, is unknown. However, since AT2R inhibits ACE activity [15], we speculated that AT2R in diabetes might lead to heightened ACE2 activity and then to an increased ACE2/ACE ratio, which could be important in vasodilatation and natriuresis in DN.
In the current in vivo study, we examined the potential functional role(s) of AT2R deficiency in nephropathy development in type I diabetes. We hypothesized that AT2R deficiency will accelerate the progression of DN in type I diabetes via reactive oxygen species (ROS) generation and upregulation classic intrarenal RAS gene expression with downregulation of ACE2 gene expression in renal proximal tubules (RPTs).
2. Methods
2.1. Animals
Male wild-type (WT, C57/BL6) and AT2RKO mice (C57/BL6 background, obtained from Dr. Tadashi Inagami, Department of Biochemistry, Vanderbilt University School of Medicine, Nashville, Tenn, USA) [8] were studied in vivo.
As described previously [16–18], we induced diabetes in male AT2RKO and WT mice at the age of 12 weeks with intraperitoneal multiple injections of streptozotocin (STZ, Sigma-Aldrich Canada Ltd., Oakville, ON, Canada) at a low-dose level of ~45–50 mg per kg body weight (BW) daily for 5 consecutive days. Three subgroups (nondiabetic (control), diabetic, and diabetic treated with insulin implants (LinShin Canada, Inc., Toronto, ON, Canada)) were sacrificed at the age of 17 weeks after a 4-week experimental period.
Animal care in these experiments met the standards set forth by the Canadian Council on Animal Care, and all procedures were approved by the Institutional Animal Care Committee of the CRCHUM. All AT2RKO and WT (C57/BL6) mice were housed under standard conditions of humidity and lighting (12-hour light-dark cycles), with free access to standard mouse chow and water ad libitum.
2.2. Physiological Studies
Blood glucose levels were measured with a Side-Kick Glucose Analyzer (Model 1500, Interscience, ON, Canada) after a 4-hour fast in the morning as reported previously [16–18]. Mean systolic blood pressure (SBP) was monitored by the tail-cuff method with the Visitech BP-2000 Blood Pressure Analysis System for mice (Visitech System Inc., Apex, NC, USA) as reported elsewhere [16–18]. Briefly, all animals were conditioned and acclimated for 2 weeks (20–30 min of SBP measurements per session, thrice weekly) starting at 10 weeks of age, and then SBP was measured thrice weekly and averaged per week from 12 weeks of age until 16-weeks of age. Since the animals were acclimated to BP measurement, we judged that the stress of having SBP recorded by tail cuff was relatively minimized. While the technique of tail-cuff measurement is generally considered less sensitive than telemetry, we believe that our SBP data is valid and convincing, based on the substantial numbers of animals used and the longitudinal studies.
All animals were euthanized at 17 weeks of age under CO2 and the kidneys removed immediately. Body weight (BW) and kidney weight (KW) were rapidly recorded. The left kidney was utilized for renal morphology and immunohistochemistry (IHC). The right kidney was reserved for renal proximal tubule (RPTs) isolation by the Percoll gradient method as well as for gene expression experiments as previously reported [16–18].
2.3. Glomerular Filtration Rate (GFR) Measurement
We estimated the GFR in 16 weeks old animals according to the protocol described by Qi et al. [19] and as recommended by AMDCC (http://www.diacomp.org/). In brief, each mouse received a single intravenous bolus of 5% fluorescein isothiocyanate-inulin (FITC-inulin), after which 7 blood samples (each ~20 μL) were collected from the saphenous vein at 3, 7, 10, 15, 35, 55, and 75 min post-FITC-inulin injection. Plasma fluorescence concentration at each time point was measured by Fluoroscan Ascent FL (Labsystems, Helsinki, Finland) with 485 nm excitation and read at 538 nm emission. The GFR was calculated according to the equation: GFR = I/(A/α + B/β), where I was the amount of FITC-inulin bolus delivered, A and α were the y intercept and decay constant of the rapid (initial) decay phase, respectively, and B and β were the y intercept and decay constant of the slow decay phase, respectively [19].
2.4. Renal Morphology
Paraffin-embedded renal sections (4 to 5 specimens per group) were stained with Periodic Acid Schiff (PAS) and Masson's Trichrome staining and visualized by light microscopy by an observer blinded to the treatment group. The collected glomerular images were analyzed and quantified by NIH Image J software (http://rsb.info.nih.gov/ij/) as reported previously [20–22].
2.5. Apoptosis Assay
Apoptosis was quantified by the transferase-dUTP-nicked-end labeling (TUNEL) as reported previously [16, 23]. Semiquantitation of apoptotic cells in the kidneys was performed as previously reported [20–22].
2.6. ROS Generation
Freshly isolated RPTs were immediately processed for ROS measurement by the lucigenin method as described previously [20, 21, 24]. ROS production was normalized with protein concentration and expressed as relative light units (RLUs) per μg protein.
2.7. Real-Time-Quantitative Polymerase Chain Reaction (RT-qPCR)
Total RNA extracted from freshly isolated RPTs was assayed for gene expression by real time quantitative PCR (RT-qPCR) as reported previously [16, 17, 23]. Fast SYBR Green Mastermix kit and the 7500 fast real-time PCR system (Applied Biosystems, Life Technologies, Foster City, Calif, USA) were employed for this purpose.
2.8. Immunohistochemistry
Immunohistochemistry (IHC) was performed by the standard avidin-biotin-peroxidase complex method (ABC Staining System, Santa Cruz Biotechnologies, Santa Cruz, Calif, USA), as described elsewhere [16, 23]. Polyclonal anti-angiotensinogen (Agt) antibody was a gift from Dr. John S.D. Chan (CRCHUM—Hôtel-Dieu Hospital). Other antibodies, including AT1R, ACE, and anti-heme oxygenase-1 (HO-1), were purchased from Santa Cruz Biotechnologies. Monoclonal ACE2 antibody was procured from R&D Systems, Inc. (Burlington, ON, Canada).
2.9. Statistical Analysis
Statistical significance between the experimental groups was analyzed by 1-way ANOVA, followed by the Bonferroni test with Graphpad Software, Prism 5.0 (http://www.graphpad.com/prism/Prism.htm). A probability level of P ≤ 0.05 was considered to be statistically significant as compared with WT control animal.
3. Results
3.1. Physiological Findings
We measured some biological parameters such as BW (g), KW (mg), daily food consumption (g/day), and blood glycemic concentration (mM) in 3 subgroups of animals (nondiabetic control, and diabetic, with or without insulin treatment) of both WT and AT2RKO mice. There were no significant differences between AT2RKO and WT mice with or without diabetes in terms of BW (Figure 1(a)) (WT mice (g), control (N = 15), 28.9 ± 3.39; diabetic (N = 14), 25.52 ± 1.38; diabetic with insulin treatment (N = 13), 26.07 ± 1.91; AT2RKO mice (g), control (N = 15), 25.13 ± 1.40; diabetic (N = 15), 23.96 ± 1.25; diabetic with insulin treatment (N = 13), 24.05 ± 2.82 and daily food consumption (Figure 1(b)) (WT mice (g/day), control (N = 15), 2.96 ± 0.41; diabetic (N = 14), 4.35 ± 0.77; and diabetic with insulin treatment (N = 13), 3.37 ± 0.67; AT2RKO mice (g), control (N = 15), 2.82 ± 0.50; diabetic (N = 15), 4.44 ± 0.89; diabetic with insulin treatment (N = 13), 3.45 ± 0.34). As expected, renal hypertrophy (Figure 1(c)) (defined by the ratio of KW versus BW) was present in diabetic animals of both AT2RKO and WT mice; insulin therapy normalized the hyperglycemia (Figure 1(d)) (WT mice (mM), control (N = 15), 7.87 ± 1.59; diabetic (N = 14), 31.43 ± 3.68; diabetic with insulin treatment (N = 13), 15.13 ± 4.18; AT2RKO mice (mM), control (N = 15), 10.16 ± 0.99; diabetic (N = 15), 28.38 ± 3.6; diabetic with insulin treatment (N = 13), 12.64 ± 3.59).
Figure 1.

Physiological parameters measurement in 3 groups (control (open bar), diabetic (black bar), and insulin-treated diabetic (shadowed bar)) of both WT and AT2RKO male mice at the age of 16 weeks. (a) Gross body weight (BW, g); (b) Food consumptions (g/day); (c) KW/BW ratio; (d) blood glycemic concentration (mM). *P ≤ 0.05; **P ≤ 0.01; NS, non significant.
3.2. Mean Systolic Blood Pressure (SBP) and Glomerular Filtration Rate (GFRs) Measurement
SBP increased over time in AT2RKO mice as reported [8] (Figure 2(a)), and the development of hypertension appeared independent of diabetes (Figure 2(b)). For example, after 4 weeks of diabetes, there was no further increase in the SBP in either WT or AT2RKO mice (Figure 2(b)) (WT mice, control (N = 10), 112.5 ± 5.78 mmHg; WT diabetic (N = 12), 111.40 ± 4.51 mmHg; WT diabetic with insulin treatment (N = 9), 114 ± 4.27 mmHg; AT2RKO mice, control (N = 13), 130.04 ± 7.00 mmHg; AT2RKO diabetic (N = 12), 132.20 ± 5.62 mmHg; AT2RKO diabetic with insulin treatment (N = 10), 128.97 ± 1.28 mmHg).
Figure 2.

(a) Longitudinal and cross-sectional changes in mean SBP in 3 subgroups (e.g., control (●), diabetic (■), and insulin-treated diabetic (▲)) of WT (broken line) and AT2RKO male mice (solid line) from the age of 12 to 16 weeks. (b) Mean SBP in 3 groups control (open bar), diabetic (black bar), and insulin-treated diabetic (shadowed bar) of WT and AT2RKO male mice at the age of 16 weeks. (c) GFR in 3 groups (control (open bar), diabetic (black bar), and insulin-treated diabetic (shadowed bar)) of WT and AT2RKO male mice at age 16 weeks. *P ≤ 0.05.
AT2RKO mice had higher GFRs [(uL/min)/BW(g)] by FITC-inulin measurement (Figure 2(c)) (control: 42.74 ± 4.3, (N = 8); diabetic 56.10 ± 4.9, (N = 8); diabetic with insulin treatment 37.16 ± 6.5, (N = 7)) at 16 weeks of age as compared to WT (control: 35.33 ± 4.5, (N = 8); diabetic 49.78 ± 5.4, (N = 9); and diabetic with insulin treatment 38.93 ± 5.56, (N = 7)). Thus, renal hyperfiltration occurs in AT2RKO mice, which may possibly contribute to the development of hypertension.
3.3. Renal Morphology and Apoptosis
Extracellular matrix (ECM) protein accumulation in glomeruli and tubular apoptosis are the key features of diabetic nephropathy. As compared to WT animals at the age of 16 weeks, AT2RKO mice display increased ECM accumulation in the glomeruli (Figures 3(a)–3(b), PAS staining) and tubulointerstitium (Figures 3(c) and 3(d), Masson trichrome staining) with upregulation of renal collagen IV mRNA level (Figure 3(e)), as well as tubular apoptosis (Figure 4, TUNEL assay). These features were further pronounced in diabetic animals and partially attenuated in the insulin-treated groups in both WT and AT2RKO mice.
Figure 3.
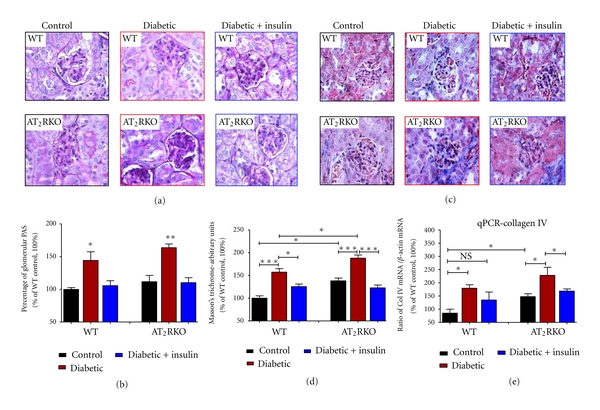
Renal morphology assessed by (a) and (b) PAS staining and (c) and (d) Masson's trichrome staining (magnification 600X). (b) and (d) Quantification of relatively stained arbitrary units of PAS (b) and Masson's Trichrome (d) in 3 subgroups [control (black bar), diabetic (red bar) and insulin-treated diabetic (blue bar)] of WT and AT2RKO male mice at the age of 16 weeks. The y-axis shows the percentage of relative staining values compared to WT control animals (100%). (e) Renal collagen IV mRNA expression analyzed by RT-qPCR. Quantitation of renal collagen IV gene was normalized to its own β-actin mRNA. The y-axis shows the percentage of relative values compared to WT animals (100%). *P ≤ 0.05; **P ≤ 0.01; ***P ≤ 0.001; NS, nonsignificant.
Figure 4.
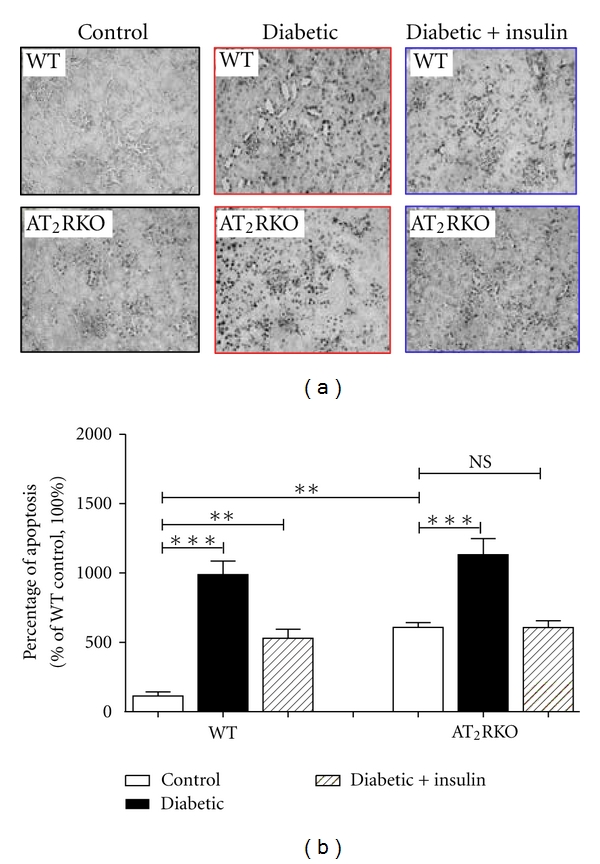
(a) TUNEL assay (magnification 200X) in the kidneys of 3 subgroups [control (open bar), diabetic (black bar) and insulin-treated diabetic (shadowed bar)] of WT and AT2RKO male mice at age 16 weeks. (b) Semi-quantitation of apoptotic cells in the kidneys. The y-axis shows the fold increase of apoptotic cell number in the kidneys of 3 subgroups of mice. **P ≤ 0.01; ***P ≤ 0.001; NS, non-significant.
3.4. ROS Generation
Heme oxygenase 1 (HO-1) is an oxidative stress-inducible enzyme that confers cellular oxidative stress in vivo, as reported previously [25]. Compared to WT mice at the age of 16 weeks, HO-1 expression, as seen by IHC (Figure 5(a)) and Western blot (Figure 5(b)), was increased significantly in RPT cells of AT2RKO mice, and this increment was even more marked in diabetic and prevented in insulin-treated AT2RKO mice.
Figure 5.

(a) HO-1 IHC staining (magnification 200X) in the kidneys of 3 subgroups (control, diabetic, and insulin-treated diabetic) of both WT and AT2RKO male mice. (b) HO-1 expression analyzed by Western blot in freshly isolated RPTs from 3 subgroups (control (open bar), diabetic (black bar), and insulin-treated diabetic (shadowed bar)) of WT and AT2RKO male mice. The quantitation of the relative densities of HO-1 normalized to β-actin. The y-axis shows the percentage of relative values compared to WT controls (100%). **P ≤ 0.01; (c) ROS measurement in RPTs. The y-axis shows relative ROS production values compared to WT controls (100%). (d) p47phox mRNA expression in RPTs analyzed by RT-qPCR. Quantitation of p47phox gene was normalized to its own β-actin mRNA. The y-axis shows the percentage of relative values compared to WT animals (100%). *P ≤ 0.05. **P ≤ 0.01; NS, nonsignificant.
We confirmed the renal HO-1 IHC results in freshly isolated RPTs from the 3 subgroups of AT2RKO and WT mice by measuring ROS generation according to the lucigenin method [20, 21, 24]. Compared to WT animals, ROS generation was significantly augmented in freshly isolated RPTs from AT2RKO mice (Figure 5(c)), and this ROS elevation was even more striking in diabetic and attenuated in insulin-treated AT2RKO mice (Figure 5(c)). Moreover, as compared with control WT mice, p47phox mRNA (one of NADPH oxidase components) seems to be upregulated in RPTs of AT2RKO mice, and this upregulation appears to be more profound in diabetic condition (Figure 5(d)).
3.5. Activation of Intrarenal RAS
First, we assessed the basal expression of several key components of the RAS—Agt, AT1R, ACE, and ACE2—by RT-qPCR and Western blotting in freshly isolated RPTs from both WT and AT2RKO mice. Compared to WT animals, the intrarenal RAS genes, that is, Agt, AT1R, and ACE, were increased, but ACE2 was decreased in RPTs of AT2RKO mice (Figure 6).
Figure 6.

Basal expression of intrarenal RAS genes (i.e., Agt, AT1R, ACE, and ACE2) in freshly isolated RPTs from WT (open bar) and AT2RKO (black bar) male mice at the age of 16 weeks. (a) RT-qPCR. Quantitation of relative intra-renal RAS genes was normalized to their own β-actin mRNA. The y-axis shows the percentage of relative values compared to WT animals (100%). *P ≤ 0.05. (b) Western blotting. Quantitation of relative densities of intrarenal RAS genes was normalized to β-actin. The y-axis shows the percentage of relative values compared to WT animals (100%). **P ≤ 0.01.
To establish a linkage between nephropathy development and intrarenal RAS activation in diabetes more completely, we evaluated intrarenal RAS genes by IHC in the kidneys of 3 subgroups of animals from both AT2RKO and WT mice. As compared to WT mice, the enhanced Agt, AT1R, and ACE were more striking in the diabetic kidneys of AT2RKO. For example, the elevation of Agt protein expression was mainly localized in the proximal tubules (Figures 7(a) and 7(b)). AT1R were detected in the proximal tubules and small intrarenal vessels (Figures 7(c) and 7(d)) with ACE on the luminal side of the proximal tubules (Figures 8(a) and 8(b)). The increased Agt, AT1R, and ACE expression appeared to be partially ameliorated in the kidneys of insulin-treated animals (Figure 7 and Figure 8).
Figure 7.

IHC staining of mAgt (a) and (b) and AT1R (c) and (d) genes. (a) and (c) IHC images of Agt and AT1R in the kidneys of 3 subgroups of both WT and AT2RKO male mice (magnification 600X). (b) and (d) Semiquantification of IHC expression in the kidneys of 3 subgroups (control (black bar), diabetic (red bar), and insulin-treated diabetic (blue bar)) of WT and AT2RKO male mice. The y-axis shows the percentage of relative staining values compared to WT control animals (100%). *P ≤ 0.05; **P ≤ 0.01; ***P ≤ 0.001.
Figure 8.

IHC staining of ACE (a) and (b) and ACE2 (c) and (d) genes. (a) and (c) IHC images of ACE and ACE2 in the kidneys of 3 subgroups of WT and AT2RKO male mice (magnification 200X). (b) and (d) Semiquantification of IHC expression in the kidneys of 3 subgroups (control (black bar), diabetic (red bar), and insulin-treated diabetic (blue bar)) of WT and AT2RKO male mice. The y-axis shows the percentage of relative staining values compared to WT controls (100%). *P ≤ 0.05; **P ≤ 0.01; ***P ≤ 0.001.
In contrast, ACE2 gene expression was significantly downregulated in RPTs of AT2RKO mice (Figure 6). Although its expression was similar in location to that of ACE, ACE2 was significantly decreased in RPTs of AT2RKO mice, but was relatively increased in diabetic kidneys of AT2RKO mice (Figures 8(c) and 8(d)), consistent with previously reported counterregulatory interactions between ACE and ACE2, which may play a role in hypertension in diabetes [13, 14, 26].
4. Discussion
The present study examined potential mechanisms of the functional role(s) of AT2R deficiency in the development of nephropathy in type I diabetes. AT2R deficiency accelerated the development of DN, which appears to be mediated, at least in part, via elevated oxidative stress and ACE/ACE2 ratio in RPTs.
In contrast to the well-established functional impact of AT1R in DN, few data are currently available concerning the role of the AT2R in diabetes and DN progression. It has been postulated that the action of AT2R may counterbalance the action of AT1R in hypertension and kidney disease. For instance, activation of the AT2R leads to vasodilatation [27] (e.g., possibly via activation of bradykinin-cGMP-nitric oxide (NO) pathway [28] and suppression of renin biosynthesis and release from renal juxtaglomerular cells [28]; these lead to vasodilatation and natriuresis, which then reduces blood pressure), mediates natriuresis (e.g., possibly via the renal dopaminergic system, a crucial system in the control of renal sodium excretion and blood pressure) [29], and causes antiproliferative/proapoptotic responses [30]. Thus, it seems reasonable that AT2R might have a counterregulatory role opposing AT1R-mediated vasoconstriction, but such mechanistic conclusions are based mainly on the studies in which an antagonist of AT2R, PD123319, was used to block AT2R function [29]. In this regard, a model in which AT2R is ablated, such as AT2RKO mice, has been eagerly used to determine whether activation of the AT2R is important in the progression of diabetic nephropathy. If so, manipulating the AT2R could act as a potential therapeutic strategy in DN.
Our studies confirmed observations that, as compared to WT animals, AT2RKO enhanced renal fibrosis [31]. After 4 weeks of diabetes, AT2RKO develops clear evidence of DN, showing renal hypertrophy, tubular apoptosis, and progressive accumulation of glomerular and tubulointerstitial ECM proteins as well as increased GFR, suggesting that deficiency of AT2R might accelerate the progress of development of DN.
There are several possible mechanisms by which deficiency of AT2R accelerates the development of DN. First, renal hyperfiltration (a key component causing endothelial dysfunction and mesangial stretch) with increased GFR is a hallmark of early DN [32]. As compared with WT animals, there was pronounced hyperfiltration in AT2RKO mice in diabetes; we speculate that this apparent hyperfiltration contributes to the development of hypertension and DN observed in AT2RKO mice—with or without diabetes. However, our data contrast with the report by Sourris et al. [33] who claimed that lower GFRs were seen in diabetic AT2RKO mice. These disparate results could be explained by technical differences in how the studies were performed: (1) we directly measured the GFR, and the other group of authors used urinary albumin excretion rates (AER) and creatinine clearance to estimate GFR; (2) our animals were diabetic for four weeks, whereas theirs had diabetes for 24 weeks. Thus, the stage of DN was not comparable. Jerums et al. [32] recently reviewed the assessments of AER and GFR in diabetic nephropathy, indicating that changes in AER are dynamic, whereas changes in GFR are usually progressive; additionally increases in AER generally, precede a decline in GFR [32].
Second, Rüster et al. [34] indicated that Ang II via AT2R in podocytes upregulates RAGE (receptors for AGEs) production, the key pathogenic factor in diabetic renal injury. Recently, Sourris et al. [33] reported that overexpression of RAGE in primary mesangial cell cultures via an adenovector-based construct enhanced superoxide generation with a significant decline of AT2R expression; AT2RKO mice exhibited significantly higher renal superoxide production in freshly minced kidney cortex as compared with those from WT animals; however, elevated renal superoxide production in the AT2RKO remained unaffected by diabetes. Then, they postulated that the pathogenic interactions among the RAGE, AT2R deficiency, and ROS generation might impact the development of diabetic renal injury.
Previously, we demonstrated that intrarenal RAS activation and high glucose via ROS generation may act in concert to increase proximal tubular cell (RPTs) apoptosis and tubulointerstitial fibrosis in diabetes, independent of systemic hypertension [16, 17]. In the current study, we observed that ROS generation in the renal cortex was significantly augmented in RPTs of AT2RKO mice as assessed by HO-1 expression, and we validated our observation in freshly isolated RPTs from AT2RKO mice. This elevation of ROS was even more pronounced in the kidneys of diabetic AT2RKO mice and attenuated in the insulin-treated animals.
NADPH oxidase plays an important role in the ROS generation in DN. NADPH oxidase consists of several membrane-bound subunits (gp91phox, nox, and p22phox) and cytosolic subunits (p47phox and p67phox). It has been reported that oxidative stress in the diabetic nephropathy is mediated, at least in part, through p47phox activation [35, 36]. By qPCR analysis, we have found that as compared with control WT mice, p47phox mRNA seems to be upregulated in RPTs of AT2RKO mice, and this upregulation appears to be more profound in diabetic condition. Taken together, these data suggested that AT2R deficiency increased intrarenal ROS generation in RPTs, leading to acceleration of the progress of DN.
Third, while functional linkage of ACE2-Ang-(1-7)-Mas axis and oxidative stress is evident in the heart [37], the role of ACE2 expression and high glucose/Ang II-induced ROS generation in kidney pathophysiology is still not established [37–39]. To date, evidence indicates that recombinant human ACE2 prevents Ang II-induced hypertension, renal oxidative stress, and tubulointerstitial fibrosis [40] while attenuating diabetic kidney injury in Akita mice in association with reduced blood pressure and decreased NADPH oxidase activity [41]. Since AT2R inhibits ACE activity [15], which may, in part, underlie AT2R increasingly recognized attenuation of AT1R-mediated actions, on the other hand, we speculate that AT2R might increase ACE2 activity and then decrease the ACE/ACE2 ratio to prevent the diabetic renal injury. Our data from this study further tested and support this hypothesis in an in vivo model.
The key components of the intrarenal RAS, including Agt, AT1R, and ACE are significantly upregulated, whereas ACE2 is downregulated, in renal proximal tubules of AT2RKO mice compared to WT animals. Additionally, the elevation of AT1R, as seen in small intrarenal vessels, also favors the development of DN. Moreover, the increased classic RAS gene expression (i.e., Agt, AT1R, and ACE) was further enhanced in diabetic AT2RKO mice, and that expression is particularly attenuated in the kidneys of insulin-treated animals. Taken together, these data suggest that intratubular Ang II is increased in proximal tubules of AT2RKO with or without diabetes; the increased ACE/ACE2 ratio might accelerate, at least in part, favoring the development of DN.
In summary, our results suggest that deficiency of AT2R that enhanced or accelerated the development of diabetic nephropathy is mediated, at least in part, via elevated ROS generation and activation of intrarenal RAS genes with downregulation of ACE2 gene expression in RPTs.
Acknowledgments
The authors acknowledge the kind gifts of AT2R knockout mice (AT2RKO) from Dr. Tadashi Inagami (Department of Biochemistry, Vanderbilt University School of Medicine, Nashville, Tenn, USA). Thanks are also due to Dr. John S.D. Chan (CRCHUM—Hôtel-Dieu, Montreal, QC, Canada) and Dr. Julie R. Ingelfinger (Massachusetts General Hospital, Boston, Mass, USA) for their unconditional support and discussion of this project, which was supported by Fonds de la Recherche en Santé du Québec (FRSQ chercheur-boursier junior II funding to Dr. Shao-Ling Zhang). The editorial assistance of Ovid Da Silva and the Research Support Office, CRCHUM is acknowledged.
Abbreviations
- ACE:
Angiotensin-converting enzyme
- ACE2:
Angiotensin-converting enzyme2
- AER:
Albumin excretion rate
- Agt:
Angiotensinogen
- Ang II:
Angiotensin II
- AT1R and AT2R:
Ang II receptors type 1 and 2
- AT2RKO:
AT2R knockout
- BP:
Blood pressure
- BW
Body weight
- DN:
Diabetic nephropathy
- ECM:
Extracellular matrix
- FITC:
Fluorescein isothiocyanate
- GFR:
Glomerular filtration rate
- HO-1:
Heme oxygenase-1
- IHC:
Immunohistochemistry
- KW:
Kidney weight
- PAS:
Periodic Acid Schiff
- RAGE:
Receptors of AGEs
- RAS:
Renin-angiotensin system
- ROS:
Reactive oxygen species
- RPTs:
Renal proximal tubules
- RT-qPCR:
Real-time-quantitative polymerase chain reaction
- SBP:
Systolic blood pressure
- STZ:
Streptozotocin
- TUNEL:
Transferase-dUTP-nicked-end labeling
- WT:
Wild type.
References
- 1.Breyer MD. Diabetic nephropathy: introduction. Seminars in Nephrology. 2007;27(2):p. 129. doi: 10.1016/j.semnephrol.2007.01.011. [DOI] [PubMed] [Google Scholar]
- 2.Gross JL, de Azevedo MJ, Silveiro SP, Canani LH, Caramori ML, Zelmanovitz T. Diabetic nephropathy: diagnosis, prevention, and treatment. Diabetes Care. 2005;28(1):164–176. doi: 10.2337/diacare.28.1.164. [DOI] [PubMed] [Google Scholar]
- 3.Jacobsen PK, Rossing P, Parving HH. Impact of renin angiotensin system blockade on night to day blood pressure ratio in diabetic nephropathy. Nephrology Dialysis Transplantation. 2006;21(7):2030–2031. doi: 10.1093/ndt/gfl012. [DOI] [PubMed] [Google Scholar]
- 4.Parving HH, de Zeeuw D, Cooper ME, et al. ACE gene polymorphism and losartan treatment in type 2 diabetic patients with nephropathy. Journal of the American Society of Nephrology. 2008;19(4):771–779. doi: 10.1681/ASN.2007050582. [DOI] [PMC free article] [PubMed] [Google Scholar]
- 5.Schjoedt KJ, Hansen HP, Tarnow L, Rossing P, Parving HH. Long-term prevention of diabetic nephropathy: an audit. Diabetologia. 2008;51(6):956–961. doi: 10.1007/s00125-008-0990-3. [DOI] [PubMed] [Google Scholar]
- 6.Ritz E, Schmieder RE, Pollock CA. Renal protection in diabetes: lessons from ONTARGET® . Cardiovascular Diabetology. 2010;9, article 60 doi: 10.1186/1475-2840-9-60. [DOI] [PMC free article] [PubMed] [Google Scholar]
- 7.Ozono R, Wang ZQ, Moore AF, Inagami T, Siragy HM, Carey RM. Expression of the subtype 2 angiotensin (AT2) receptor protein in rat kidney. Hypertension. 1997;30(5):1238–1246. doi: 10.1161/01.hyp.30.5.1238. [DOI] [PubMed] [Google Scholar]
- 8.Ichiki T, Labosky PA, Shiota C, et al. Effects on blood pressure exploratory behaviour of mice lacking angiotensin II type 2 receptor. Nature. 1995;377(6551):748–750. doi: 10.1038/377748a0. [DOI] [PubMed] [Google Scholar]
- 9.Nishimura H, Yerkes E, Hohenfellner K, et al. Role of the angiotensin type 2 receptor gene in congenital anomalies of the kidney and urinary tract, CAKUT, of mice and men. Molecular Cell. 1999;3(1):1–10. doi: 10.1016/s1097-2765(00)80169-0. [DOI] [PubMed] [Google Scholar]
- 10.Donoghue M, Hsieh F, Baronas E, et al. A novel angiotensin-converting enzyme-related carboxypeptidase (ACE2) converts angiotensin I to angiotensin 1-9. Circulation Research. 2000;87(5):E1–9. doi: 10.1161/01.res.87.5.e1. [DOI] [PubMed] [Google Scholar]
- 11.Tipnis SR, Hooper NM, Hyde R, Karran E, Christie G, Turner AJ. A human homolog of angiotensin-converting enzyme: cloning and functional expression as a captopril-insensitive carboxypeptidase. Journal of Biological Chemistry. 2000;275(43):33238–33243. doi: 10.1074/jbc.M002615200. [DOI] [PubMed] [Google Scholar]
- 12.Ferrario CM, Chappell MC, Tallant EA, Brosnihan KB, Diz DI. Counterregulatory actions of angiotensin-(1-7) Hypertension. 1997;30(3):535–541. doi: 10.1161/01.hyp.30.3.535. [DOI] [PubMed] [Google Scholar]
- 13.Ingelfinger JR. Angiotensin-converting enzyme 2: implications for blood pressure and kidney disease. Current Opinion in Nephrology and Hypertension. 2009;18(1):79–84. doi: 10.1097/MNH.0b013e32831b70ad. [DOI] [PubMed] [Google Scholar]
- 14.Koka V, Xiao RH, Chung ACK, Wang W, Truong LD, Lan HY. Angiotensin II up-regulates angiotensin I-converting enzyme (ACE), but down-regulates ACE2 via the AT1-ERK/p38 MAP kinase pathway. American Journal of Pathology. 2008;172(5):1174–1183. doi: 10.2353/ajpath.2008.070762. [DOI] [PMC free article] [PubMed] [Google Scholar]
- 15.Hunley TE, Tamura M, Stoneking BJ, et al. The angiotensin type II receptor tonically inhibits angiotensin-converting enzyme in AT2 null mutant mice. Kidney International. 2000;57(2):570–577. doi: 10.1046/j.1523-1755.2000.00877.x. [DOI] [PubMed] [Google Scholar]
- 16.Liu F, Brezniceanu ML, Wei CC, et al. Overexpression of angiotensinogen increases tubular apoptosis in diabetes. Journal of the American Society of Nephrology. 2008;19(2):269–280. doi: 10.1681/ASN.2007010074. [DOI] [PMC free article] [PubMed] [Google Scholar]
- 17.Liu F, Wei CC, Wu SJ, et al. Apocynin attenuates tubular apoptosis and tubulointerstitial fibrosis in transgenic mice independent of hypertension. Kidney International. 2009;75(2):156–166. doi: 10.1038/ki.2008.509. [DOI] [PubMed] [Google Scholar]
- 18.Sachetelli S, Liu Q, Zhang SL, et al. RAS blockade decreases blood pressure and proteinuria in transgenic mice overexpressing rat angiotensinogen gene in the kidney. Kidney International. 2006;69(6):1016–1023. doi: 10.1038/sj.ki.5000210. [DOI] [PubMed] [Google Scholar]
- 19.Qi Z, Fujita H, Jin J, et al. Characterization of susceptibility of inbred mouse strains to diabetic nephropathy. Diabetes. 2005;54(9):2628–2637. doi: 10.2337/diabetes.54.9.2628. [DOI] [PubMed] [Google Scholar]
- 20.Brezniceanu ML, Liu F, Wei CC, et al. Attenuation of interstitial fibrosis and tubular apoptosis in db/db transgenic mice overexpressing catalase in renal proximal tubular cells. Diabetes. 2008;57(2):451–459. doi: 10.2337/db07-0013. [DOI] [PubMed] [Google Scholar]
- 21.Brezniceanu ML, Wei CC, Zhang SL, et al. Transforming growth factor-beta 1 stimulates angiotensinogen gene expression in kidney proximal tubular cells. Kidney International. 2006;69(11):1977–1985. doi: 10.1038/sj.ki.5000396. [DOI] [PubMed] [Google Scholar]
- 22.Tolivia J, Navarro A, Del Valle E, Perez C, Ordoñez C, Martínez E. Application of photoshop and scion image analysis to quantification of signals in histochemistry, immunocytochemistry and hybridocytochemistry. Analytical and Quantitative Cytology and Histology. 2006;28(1):43–53. [PubMed] [Google Scholar]
- 23.Tran S, Chen YW, Chenier I, et al. Maternal diabetes modulates renal morphogenesis in offspring. Journal of the American Society of Nephrology. 2008;19(5):943–952. doi: 10.1681/ASN.2007080864. [DOI] [PMC free article] [PubMed] [Google Scholar]
- 24.Brezniceanu ML, Liu F, Wei CC, et al. Catalase overexpression attenuates angiotensinogen expression and apoptosis in diabetic mice. Kidney International. 2007;71(9):912–923. doi: 10.1038/sj.ki.5002188. [DOI] [PubMed] [Google Scholar]
- 25.Godin N, Liu F, Lau GJ, et al. Catalase overexpression prevents hypertension and tubular apoptosis in angiotensinogen transgenic mice. Kidney International. 2010;77(12):1086–1097. doi: 10.1038/ki.2010.63. [DOI] [PubMed] [Google Scholar]
- 26.Ferrario CM, Jessup J, Gallagher PE, et al. Effects of renin-angiotensin system blockade on renal angiotensin-(1-7) forming enzymes and receptors. Kidney International. 2005;68(5):2189–2196. doi: 10.1111/j.1523-1755.2005.00675.x. [DOI] [PubMed] [Google Scholar]
- 27.Siragy HM. Angiotensin AT1 and AT2 receptors—the battle for health and disease. Nephrology Dialysis Transplantation. 2007;22(11):3128–3130. doi: 10.1093/ndt/gfm614. [DOI] [PubMed] [Google Scholar]
- 28.Siragy HM, Inagami T, Carey RM. NO and cGMP mediate angiotensin AT2 receptor-induced renal renin inhibition in young rats. American Journal of Physiology. 2007;293(4):R1461–R1467. doi: 10.1152/ajpregu.00014.2007. [DOI] [PubMed] [Google Scholar]
- 29.Carey RM, Padia SH. Angiotensin AT2 receptors: control of renal sodium excretion and blood pressure. Trends in Endocrinology and Metabolism. 2008;19(3):84–87. doi: 10.1016/j.tem.2008.01.003. [DOI] [PubMed] [Google Scholar]
- 30.Jöhren O, Dendorfer A, Dominiak P. Cardiovascular and renal function of angiotensin II type-2 receptors. Cardiovascular Research. 2004;62(3):460–467. doi: 10.1016/j.cardiores.2004.01.011. [DOI] [PubMed] [Google Scholar]
- 31.Ma J, Nishimura H, Fogo A, Kon V, Inagami T, Ichikawa I. Accelerated fibrosis and collagen deposition develop in the renal interstitium of angiotensin type 2 receptor null mutant mice during ureteral obstruction. Kidney International. 1998;53(4):937–944. doi: 10.1111/j.1523-1755.1998.00893.x. [DOI] [PubMed] [Google Scholar]
- 32.Jerums G, Panagiotopoulos S, Premaratne E, MacIsaac RJ. Integrating albuminuria and GFR in the assessment of diabetic nephropathy. Nature Reviews Nephrology. 2009;5(7):397–406. doi: 10.1038/nrneph.2009.91. [DOI] [PubMed] [Google Scholar]
- 33.Sourris KC, Morley AL, Koitka A, et al. Receptor for AGEs (RAGE) blockade may exert its renoprotective effects in patients with diabetic nephropathy via induction of the angiotensin II type 2 (AT2) receptor. Diabetologia. 2010;53(11):2442–2451. doi: 10.1007/s00125-010-1837-2. [DOI] [PMC free article] [PubMed] [Google Scholar]
- 34.Rüster C, Bondeva T, Franke S, Tanaka N, Yamamoto H, Wolf G. Angiotensin II upregulates RAGE expression on podocytes: role of AT2 receptors. American Journal of Nephrology. 2009;29(6):538–550. doi: 10.1159/000191467. [DOI] [PubMed] [Google Scholar]
- 35.Asaba K, Tojo A, Onozato ML, et al. Effects of NADPH oxidase inhibitor in diabetic nephropathy. Kidney International. 2005;67(5):1890–1898. doi: 10.1111/j.1523-1755.2005.00287.x. [DOI] [PubMed] [Google Scholar]
- 36.Kitada M, Koya D, Sugimoto T, et al. Translocation of glomerular p47phox and p67phox by protein kinase C-β activation is required for oxidative stress in diabetic nephropathy. Diabetes. 2003;52(10):2603–2614. doi: 10.2337/diabetes.52.10.2603. [DOI] [PubMed] [Google Scholar]
- 37.Rabelo LA, Alenina N, Bader M. ACE2-angiotensin-(1-7)-Mas axis and oxidative stress in cardiovascular disease. Hypertension Research. 2011;34(2):154–160. doi: 10.1038/hr.2010.235. [DOI] [PubMed] [Google Scholar]
- 38.Benter IF, Yousif MHM, Dhaunsi GS, Kaur J, Chappell MC, Diz DI. Angiotensin-(1-7) prevents activation of NADPH oxidase and renal vascular dysfunction in diabetic hypertensive rats. American Journal of Nephrology. 2007;28(1):25–33. doi: 10.1159/000108758. [DOI] [PubMed] [Google Scholar]
- 39.Gonzales S, Noriega GO, Tomaro ML, Peña C. Angiotensin-(1-7) stimulates oxidative stress in rat kidney. Regulatory Peptides. 2002;106(1-3):67–70. doi: 10.1016/s0167-0115(02)00032-0. [DOI] [PubMed] [Google Scholar]
- 40.Zhong J, Guo D, Chen CB, et al. Prevention of angiotensin II-mediated renal oxidative stress, inflammation, and fibrosis by angiotensin-converting enzyme 2. Hypertension. 2011;57:314–322. doi: 10.1161/HYPERTENSIONAHA.110.164244. [DOI] [PubMed] [Google Scholar]
- 41.Oudit GY, Liu GC, Zhong J, et al. Human recombinant ACE2 reduces the progression of diabetic nephropathy. Diabetes. 2010;59(2):529–538. doi: 10.2337/db09-1218. [DOI] [PMC free article] [PubMed] [Google Scholar]