

Abstract
Purpose: The combination of single photon emission computed tomography (SPECT) and computer tomography (CT) that incorporates iterative reconstruction algorithms with attenuation and scatter correction should facilitate accurate non-invasive quantitative imaging. Quantitative SPECT (QSPECT) may improve diagnostic ability and could be useful for many applications including dosimetry assessment. Using 177Lu, we developed a QSPECT method using a commercially available SPECT/CT system. Methods: Serial SPECT of 177Lu sources (89–12,400 MBq) were acquired with multiple contiguous energy windows along with a co-registered CT, and were reconstructed using an iterative algorithm with attenuation and scatter correction. Camera sensitivity (based on reconstructed SPECT count rate) and dead-time (based on wide-energy spectrum count rate) were resolved by non-linear curve fit. Utilizing these parameters, a SPECT dataset can be converted to a QSPECT dataset allowing quantitation in Becquerels per cubic centimetre or standardized uptake value (SUV). Validation QSPECT/CT studies were performed on a 177Lu cylindrical phantom (7 studies) and on 5 patients (6 studies) who were administered a therapeutic dose of [177Lu]octreotate. Results: The QSPECT sensitivity was 1.08 × 10⁻⁵ ± 0.02 × 10⁻⁵ s−1 Bq−1. The paralyzing dead-time constant was 0.78 ± 0.03 µs. The measured total activity with QSPECT deviated from the calibrated activity by 5.6 ± 1.9% and 2.6 ± 1.8%, respectively, in phantom and patients. Dead-time count loss up to 11.7% was observed in patient studies. Conclusion: QSPECT has high accuracy both in our phantom model and in clinical practice following [177Lu]octreotate therapy. This has the potential to yield more accurate dosimetry estimates than planar imaging and facilitate therapeutic response assessment. Validating this method with other radionuclides could open the way for many other research and clinical applications.
Keywords: Quantitation, SPECT/CT, dead-time, dosimetry, lutetium-177
Introduction
Quantitation in nuclear medicine is useful for a variety of clinical and research applications[1,2]. In cancer imaging, quantitation is particularly useful for the assessment of therapeutic response. A common clinical application is the serial assessment of glucose metabolism in tumours using [18F]fluorodeoxyglucose (FDG) positron emission tomography (PET) following treatment. Another cancer imaging application where quantitation is highly desirable is the assessment of biodistribution as a potential means of determining lesion and healthy tissue dosimetry following radionuclide therapy[3]. Many radionuclides used for this purpose emit both the particulate radiations that provide the therapeutic effect and gamma photons in a highly interrelated manner. Accordingly, imaging of the gamma photons with gamma cameras using single photon emission computed tomography (SPECT)-capable systems can provide an estimate of absorbed radiation dose related to concomitant particulate emissions.
Relative quantification, in which counts from 2 or more regions of interest are compared, has been the primary method used in general nuclear medicine. In contrast, PET incorporating attenuation correction allows quantitative determination of actual tissue activity within a defined region (in Bq cm−3) or by way of a standardized uptake value (SUV) obtained from normalizing for administered dose and patient factors such as body weight[1]. Quantitation has not gained widespread use with SPECT, partly due to the lack of commercially available systems supporting quantitative SPECT (QSPECT). Hybrid SPECT cameras coupled with computed tomography (SPECT/CT) allow rapid and convenient acquisition of a co-registered attenuation map for attenuation correction (AC). Scatter correction (SC) in SPECT is complex and has previously been perceived as a major obstacle to QSPECT implementation, but there has been extensive progress in this area over the last 3 decades[4,5], and reconstruction incorporating SC has been implemented by SPECT/CT system manufacturers. It is also known that dead-time can result in significant quantitation inaccuracy with gamma cameras[6]. For example, Chiesa et al.[7] observed apparent count losses due to dead-time ranging from 50 to 90% over the abdominal region, when performing planar scans after 131I-based therapy. Dead-time correction is therefore required for accurate QSPECT, particularly in a post-therapy setting where dosimetry is most pertinent.
Some authors have developed promising QSPECT reconstruction methods based on SPECT/CT imaging that include advanced SC algorithms[8,9], but these methods require third-party software or advanced programming, which limits their availability. Our aim was to develop and validate a QSPECT protocol using a commercially available SPECT/CT camera system and its bundled software. 177Lu was the isotope of interest, given the potential to assess dosimetry and therapeutic response in patients with neuroendocrine tumour disease being treated with [177Lu]octreotate ([177Lu-DOTA0,Tyr3]octreotate).
Materials and methods
SPECT/CT system
All acquisitions were performed using a hybrid dual-head SPECT/CT camera (Symbia TruePoint T6, Siemens Medical Solutions, Germany), which has a crystal thickness of 15.8 mm and a 40 cm axial by 50 cm diameter SPECT field of view (FOV). All data reconstruction and analysis were performed with the packaged software from the same vendor (Syngo MI Applications version 7.5, Siemens Medical Solutions, Germany). The study was performed entirely independently of the vendor.
SPECT/CT acquisition and reconstruction
The main photopeak of 177Lu (208 keV; 10.4% probability)[10] was the photopeak of interest. Fig. 1 presents the energy spectrum when imaging a patient injected with [177Lu]octreotate. Tables 1 and 2 summarize, respectively, the SPECT and CT acquisition parameters. Table 3 summarizes the QSPECT multi-step processing workflow that was set up in Syngo MI Applications.
Figure 1.

Energy distribution of incident photons (spectrum) when scanning a patient injected with [177Lu]octreotate (anterior abdominal view). A is the photopeak energy window (208 keV; 20% width), B is the lower scatter energy window (10% width), C and D are general scatter windows (110.9 and 37 keV, respectively; 100% width).
Table 1.
SPECT acquisition parameters
| Collimator | Medium energy, low penetration |
| Matrix | 128 × 128 |
| Zoom | 1.0 |
| Pixel | 4.8 mm |
| Angular steps | 96 (48 per head) over 360° |
| Mode | Step and shoot |
| Orbit | Contouring |
| Time per frame | 10–15 s for patient studies; 10–40 s for calibration and phantom studies |
| Energy windows | A. Photopeak (208 keV, 20% width, 187.2–228.8 keV) |
| B. Lower scatter (10% width, 166.4 to 187.2 keV) | |
| C. General scatter (110.9 keV, 100% width, 55.5–166.4 keV) | |
| D. General scatter (37.0 keV, 100% width, 18.5–55.5 keV) |
Table 2.
CT acquisition parameters
| Topogram FOV | Same as SPECT axial FOV |
| CT FOV | 40 cm axial by 50 cm transaxial (same as SPECT) |
| Collimation | 6 × 3.0 mm |
| Pitch | 1.0 |
| Rotation | 0.6 s |
| Voltage | 130 kV |
| Current | CARE Dose4D, effective mAs = 70 |
| Reconstructions | CT for attenuation correction (CTAC): B08s filter, 5.0 mm slice, 512 × 512 |
| CT for visualization: B41s medium + filter, 5.0 mm slice, 512 × 512 |
Table 3.
QSPECT processing workflow in Syngo MI Applications
| Step | Activity | Description |
|---|---|---|
| 1 | Data selection | Selection of raw SPECT acquisition and CTAC series |
| 2 | Scatter estimation | Extraction of the photopeak acquisition series (energy window A) and generation the lower scatter series (from energy window B) using the DEW technique |
| 3 | Series reconstruction | Non-corrected filtered backprojection reconstruction, for the purpose of generating the SPECT matrix for CTAC resampling |
| 4 | Series registration | Resampling of CTAC to the SPECT matrix |
| 5 | Attenuation map | Conversion of resampled CTAC into an attenuation map using 208 keV narrow beam geometry settings (no filtering) |
| 6 | Series reconstructiona | Iterative reconstruction (OSEM Flash 3D, 4 iterations, 8 subsets) with AC and SC (no zoom, no filtering) |
| 7 | Series arithmetic | Multiplication (rescaling) of the raw SPECT acquisition series by 0.01 to avoid pixel saturation (>65,535 counts/pixel) during the next step. The Use Scale Factor option was enabled in this activityc |
| 8 | Series arithmetic | Sum of the rescaled raw SPECT acquisition series frames (96 × 4 energy windows = 384 frames) into one static image. The displayed count sum of this static image times 100 is the wide-spectrum counts (CWo) |
| 9 | Series arithmeticb | Multiplication of the reconstructed SPECT series by a coefficient (K) converting counts to dead-time corrected quantitative uptake data. The resulting series is saved as QSPECT |
aFor the calibration studies, the photopeak and scatter series were scaled down before reconstruction (by a factor up to 100) in order to avoid voxel saturation (>65,535 counts/voxel) in the reconstructed SPECT dataset.
bThis step was not performed for the calibration studies.
cThis allows fractions of counts (e.g. 2 decimal digits) to be preserved in subsequent step.
The proprietary iterative (ordered subset expectation maximization, or OSEM) reconstruction algorithm with collimator depth-dependent three-dimensional resolution recovery (Flash 3D, Siemens Medical Solutions, Germany) was chosen because it is the only algorithm allowing both AC and SC with this SPECT/CT system. Also, this system only supports dual- and triple-energy window techniques (DEW and TEW, respectively) for scatter estimation. The TEW technique uses 2 scatter energy windows, one on each side on the photopeak energy windows, and is defined by
where CS is the number of estimated counts of scattered photons mixed in the photopeak window; CL and CU are the counts in the lower and upper scatter windows, respectively; WP, WL and WU are the widths of the photopeak, lower and upper scatter windows, respectively. The DEW technique uses only one lower scatter energy window and assumes CU = 0 in the above equation[11]. There is a very low incidence of gamma and bremsstrahlung photon events with energy higher than the 208-keV photopeak window’s upper limit (228.8 keV), as shown in Fig. 1. We therefore chose the DEW technique for SC throughout this work. We selected a wider scatter window (10% of photopeak energy) than proposed by Ichihara et al.[11] in order to obtain better counting statistics and minimize the statistical noise without having to filter the scatter estimation series (which is, in fact, the unaltered energy window B acquisition projections in our protocol) prior to reconstruction.
The purpose of the general scatter windows (C and D, Table 1 and Fig. 1) was to obtain, at Step 8 of the processing workflow (Table 3), the observed wide-spectrum counts (CWo), which is the total number of events with an energy ranging from ∼25 to 228.8 keV. This gamma camera does not record events with energy below ∼25 keV, and it is assumed that the number of such events, as well as events with energy higher than 228.8 keV, is proportional to CWo. CWo divided by the total acquisition time T (the number of steps multiplied by the time per step) is the wide-spectrum count rate (RWo). Total counts from each reconstructed AC SC SPECT dataset series were divided by T to yield the observed AC SC SPECT counting rate (RSo).
The final SPECT transaxial matrix was 128 × 128, with 4.8 mm isotropic voxel (110.6 μm3).
Sensitivity and dead-time
Our dose calibrator (Capintec CRC-15 R) was previously calibrated with a 177Lu source from IBD-Holland (Netherlands). Ten sources consisting of <1 ml of 177Lu aqueous solution in 1.5-ml Eppendorf tubes were calibrated and their activity was decay-corrected to the time of each acquisition. There was less than 0.2% difference between readings of 177Lu solution in syringes and Eppendorf tubes. Therefore, the geometric dependence of the dose calibrator was considered insignificant. One to 4 sources were placed in various combinations in the centre of the camera FOV and a total of 34 SPECT/CT acquisitions were performed. Of these, 8 acquisitions (89–12,300 MBq) were performed without added attenuating/scattering medium, as shown in Fig. 2a, and 26 acquisitions (92–12,400 MBq) were performed with the addition of an attenuating/scattering medium surrounding the sources, as shown in Fig. 2b. The latter consisted of a polystyrene icebox containing 8 one-litre saline bags and a thin-walled plastic cylinder in its centre in which the sources were inserted. The purpose of this attenuating/scattering medium was to obtain calibration data acquired with an amount of scatter similar to what is observed in clinical 177Lu scanning.
Figure 2.

From left to right: CT, SPECT and fused transaxial slice of, respectively: (a) 177Lu source without surrounding attenuating/scattering medium; (b) 177Lu source with surrounding attenuating/scattering medium consisting of a polystyrene foam icebox containing 8 one-litre saline bags; (c) Perspex cylindrical phantom with 3 cylindrical inserts.
Our SPECT/CT system behaves like a paralyzable system. Applying the cascaded paralyzable–non-paralyzable model[6] would have been inappropriate since the non-paralyzing dead-time constant would have been smaller than the paralyzing dead-time constant (data not shown). Therefore, we fitted the dead-time model for paralyzable systems from Sorenson[6] to the data using the equation:
where
A is the calibrated activity, S is the QSPECT sensitivity (i.e. sensitivity of AC SC SPECT when dead-time count loss is zero) and τ is the paralyzing dead-time constant of the system. Using Prism software (version 5.01, GraphPad Software Inc., USA), we plotted RWo against X and resolved S and τ ( ± standard error of the mean) by curve fitting. A RWo lookup table was created, where for each expected wide-spectrum count rate (RWe, which is equal to SX) incremental interval (e.g. 1000 s−1), RWo is calculated along with the corresponding dead-time correction factor (D = RWe/RWo) value, so that for any RWo, up to the theoretical maximum RWo, a D value is returned and applied to correct reconstructed AC SC SPECT data for dead-time.
To validate the use of RWo for dead-time correction, we repeated Sorenson’s model fitting using observed photopeak energy window count rate (RPo) instead of RWo, and analyzed the data from acquisitions with and without added attenuating/scattering medium separately.
QSPECT conversion coefficient
At Step 9 of the processing workflow (Table 3), the reconstructed AC SC SPECT series is multiplied by a conversion coefficient (K), analogous to the rescale slope in PET images, which converts count data into intuitive quantitative data such as activity concentration (Bq cm−3), percentage of injected activity concentration (%IA cm−3) or fraction of injected activity concentration normalized for body weight (SUV)[1], as follows:
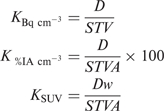 |
where D is the dead-time correction factor; S is the QSPECT sensitivity; T is the acquisition time, V is the voxel volume, A is the calibrated, decay-corrected administered activity, and w is the patient’s body weight (assuming that 1 g = 1 cm3). Lean body weight or body surface area could also be used instead of body weight, if desired[1]. The calculation of K is facilitated by the use of a spreadsheet (which includes the RWo lookup table) where CWo is entered, along with the dose parameters (injected activity, calibration time, acquisition time) and patient’s weight where appropriate, and K is returned. It may be necessary to rescale K by one or more orders of magnitude, so that the final data ranges from 0 to 65,535 units, without exceeding 65,535, in which case the quantitative accuracy could be compromised. This is a limitation of systems handling nuclear medicine imaging data in word (16 bits) mode and allowing only integer numbers (i.e. no rescale slope as in PET images). For example, a convenient way to convert data to SUV is to assign 1 count unit = 0.01 SUV, thus allowing SUVs from 0.00 to 655.35 to be displayed properly. When performing a multiple-bed (or whole-body) QSPECT, CWo must be recorded, and calculated independently, for each bed position, as there may be significant count rate and dead-time differences between each bed position.
Phantom validation
Seven QSPECT/CT (Bq cm−3) scans were acquired on a Perspex phantom consisting of a large fillable cylinder (diameter 20 cm; length 20 cm; fillable volume 2500 cm3), with 3 cylindrical inserts (diameter 3 cm; volume 175 cm3). Two of these inserts are fillable and the other is fitted with material simulating bone density. The phantom was filled with aqueous solution of various 177Lu activity concentrations, detailed in Table 4. An example of a QSPECT/CT study with this phantom is shown in Fig. 2c. The total activity of the QSPECT reconstructed data was calculated. Volumes of interest (VOI) using percentage threshold of maximum activity that was above the surrounding activity level (1–40%) were drawn over the fillable cylindrical inserts to measure their respective total activity, including the spill-over activity. Activity in the large cylinder was the difference between the total activity and the cylinder inserts activity. Activities measured by QSPECT were compared with corresponding decay-corrected calibrated activity in each compartment and total activity in the phantom (ranging from 22.6 to 1730 MBq).
Table 4.
QSPECT phantom validation
| No. | Calibrated activity (MBq) |
QSPECT activity (MBq)a |
Deviation (%)a |
Dead-time count loss (%) | Total deviation no DTC (%)b | |||||||||
|---|---|---|---|---|---|---|---|---|---|---|---|---|---|---|
| A | B | C | Total | A | B | C | Total | A | B | C | Total | |||
| 1 | 22.6 | 0 | 0 | 22.6 | 20.5 | – | – | 20.5 | −9.5 | – | – | −9.5 | 0.0 | −9.5 |
| 2 | 78.7 | 0 | 0 | 78.7 | 82.1 | – | – | 82.1 | 4.3 | – | – | 4.3 | −0.2 | 4.1 |
| 3 | 75.3 | 0 | 314 | 390 | 71.6 | – | 302 | 373 | −5.0 | – | –4.0 | −4.2 | −0.9 | −5.0 |
| 4 | 75.2 | 146 | 314 | 535 | 65.9 | 131 | 315 | 512 | −12.4 | −10.2 | 0.4 | −4.3 | −1.3 | −5.6 |
| 5 | 75.0 | 146 | 940 | 1160 | 63.9 | 131 | 903 | 1100 | −14.9 | −10.2 | −3.9 | −5.4 | −2.9 | −8.2 |
| 6 | 650 | 145 | 938 | 1730 | 616 | 139 | 891 | 1650 | −5.2 | −4.3 | −5.0 | −5.0 | −4.4 | −9.1 |
| 7 | 373 | 83.4 | 538 | 994 | 360 | 73.4 | 498 | 932 | −3.4 | −12.0 | −7.4 | −6.3 | −2.5 | −8.6 |
A and B, cylindrical insert compartments (175 cm3); C, large cylinder compartment (2,500 cm3).
aQSPECT data with dead-time correction (DTC).
bSPECT data corrected for attenuation, scatter and sensitivity, but not for dead-time.
Patient validation
The clinical component of the study was approved by our institutional ethics committee and the patients provided informed consent. Five patients with metastatic neuroendocrine tumour disease who were injected with a therapeutic dose of [177Lu]octreotate (ranging from 7.9 to 10.2 GBq) in the course of their medical care underwent a 2-bed QSPECT/CT (SUV), from lower neck to proximal thighs, starting between 40 and 60 min after injection. Patients were weighed. They were asked not to void before the scan, so that the total injected activity was contained within their body at the time of acquisition. Patient 5 was scanned twice, following 2 consecutive [177Lu]octreotate cycles.
Accuracy was assessed by comparing the total QSPECT activity with the decay-corrected calibrated injected dose. Because [177Lu]octreotate is a systemic agent and total body SPECT scanning (4–5 bed positions) is impractical, we applied the following methods to resolve the total QSPECT activity. The total QSPECT activity was comprised of 2 parts: one from the section of the body that was scanned and the other from an estimate of the activity in the rest of the body (extra-scan body). The volume of the scanned section of the body was derived using a threshold of −400 Hounsfield units on the acquired CT to draw a VOI surrounding the patient. The volume of the extra-scan body was calculated by subtracting the latter (assuming 1 g = 1 cm3) from the patient’s known weight. Body background activity concentration was the average activity concentration within 2 ellipsoidal VOI (approximately 100 cm3 each) comprising blood, muscle, fat and bone: one over the shoulder area and one over the proximal thigh. This body background activity concentration was multiplied by the extra-scan body volume to estimate the extra-scan body activity.
Results
Camera sensitivity and dead-time
Fig. 3 illustrates the dead-time phenomenon as RWo as a function of RWe. Sorenson’s model was fitted to the data with an R2 value of 0.998. S was 1.078 × 10⁻⁵ ± 0.016 × 10⁻⁵ s−1 Bq−1 and τ was 0.781 ± 0.029 µs. The theoretical maximum RWo is estimated at 471,000 s−1.
Figure 3.

Observed wide-spectrum count rate versus expected wide-spectrum count rate. The solid line curve is the result of Sorenson’s paralyzable model fit. The dotted line is the line of identity.
The heterogeneous attenuating/scattering medium (Fig. 2b) increased the counts in the lower scatter window (window B) up to 30–35% of the counts in the photopeak window (window A), a similar proportion to what is observed for typical clinical 177Lu-SPECT/CT studies. By comparison, that proportion fell to 12–18% when no attenuating/scattering medium was added (Fig. 2a). When RWo was analyzed separately for data acquired with and without added surrounding attenuating/scattering medium, τ was not statistically different between the 2 attenuation/scatter conditions (95% confidence intervals: 0.729–0.789 µs and 0.751–0.863 µs, respectively).
Fig. 4 illustrates the dead-time phenomenon as RPo as a function of the photopeak energy window expected count rate (RPe). The apparent τ was 4.90 ± 0.10 µs and 3.20 ± 0.10 µs, respectively, with and without added surrounding attenuating/scattering medium. τ was statistically different between the 2 attenuation/scatter conditions (95% confidence intervals: 4.70–5.10 µs and 2.98–3.43 µs, respectively).
Figure 4.

Observed photopeak count rate versus expected photopeak count rate, with (red) and without (blue) added attenuating/scattering medium surrounding the 177Lu sources. The solid line curves are the result of Sorenson’s paralyzable model fit. The dotted line is the line of identity. At a given observed count rate, the apparent dead-time varies depending on the attenuation/scatter conditions.
Phantom validation
Table 4 shows the results of the phantom validation experiment. The measured activity with QSPECT deviated from the decay-corrected calibrated activity by 5.6 ± 1.9% (average of absolute deviation ± SD) for total activity and by 6.6 ± 3.5% for all VOIs. Dead-time varied between 0.0% and 4.4%.
Patient validation
Table 5 shows the results of the patient validation experiment. The sum of the total activity measured with QSPECT and the extrapolated activity in the extra-scan body deviated by 2.6 ± 1.8% (average of absolute deviation ± SD) from the decay-corrected calibrated injected dose. Dead-time varied between 6.6% and 11.7%. An example of a clinical [177Lu]octreotate-QSPECT/CT study is presented in Fig. 5.
Table 5.
QSPECT patient validation
| No. | Dose (GBq) | Body volume (L) |
Body background (SUV)a,b | Body activity (SUV L)b |
Dead-time count loss (%) |
Deviation (%) |
||||||
|---|---|---|---|---|---|---|---|---|---|---|---|---|
| Totalc | Scannedd | Extra-scan | Scanned | Extra-scane | Total | Bed 1 | Bed 2 | DTCb | No DTCf | |||
| 1 | 8.3 | 82.0 | 54.9 | 27.1 | 0.43 | 67.8 | 11.7 | 79.5 | 10.8 | 6.8 | −3.1 | −12.2 |
| 2 | 8.3 | 71.0 | 46.5 | 24.5 | 0.47 | 57.7 | 11.4 | 69.1 | 10.4 | 7.2 | −2.6 | −11.6 |
| 3 | 7.9 | 74.6 | 39.5 | 35.1 | 0.16 | 66.0 | 5.7 | 71.7 | 7.1 | 11.7 | −3.8 | −15.1 |
| 4 | 10.2 | 103.5 | 67.7 | 39.8 | 0.41 | 87.2 | 16.3 | 103.5 | 7.7 | 11.6 | 0.0 | −10.2 |
| 5 | 7.9 | 78.0 | 45.9 | 32.1 | 0.43 | 60.3 | 13.9 | 74.2 | 9.5 | 6.9 | −4.9 | −14.0 |
| 5 | 9.1 | 78.0 | 51.9 | 26.1 | 0.47 | 65.1 | 12.2 | 77.3 | 11.3 | 6.6 | −1.0 | −10.3 |
aAverage activity concentration in volumes of interest over shoulder and thigh.
bQSPECT data with dead-time correction (DTC).
cBased on patient’s weight, assuming that 1 g = 1 cm3 and 1 kg = 1 L.
dBased on CT.
eExtrapolated from body volume outside FOV and body background activity concentration.
fSPECT data corrected for attenuation, scatter and sensitivity, but not for dead-time.
Figure 5.

From left to right, top to bottom, respectively: fused, CT and SPECT transaxial slice, and anterior maximum intensity projection of body QSPECT/CT started 60 min after intravenous administration of 8.4 GBq of [177Lu]octreotate, in a patient with metastatic neuroendocrine tumour to liver and abdominal lymph nodes (patient 1). The upper threshold of the colour scale (red) was set to SUV 12.
Discussion
The development of QSPECT, a quantitative three-dimensional imaging technique, has the potential to have a significantly effect on oncological nuclear medicine practice by improving the accuracy of dosimetry estimates in radionuclide therapy. QSPECT has a potential complementary role to PET in cancer imaging in this regard since it is now feasible to perform pre-treatment analysis of radiopharmaceutical biodistribution using a diagnostic PET ligand and to then validate the actual uptake and clearance of activity from a lesion or from normal organs by performing serial quantitative measurements following therapy with a single photon emitting therapeutic agent. This may facilitate more appropriate dosing of targeted therapies, optimizing the delivered radiation dose to tumour while minimizing the risk of toxicity to healthy tissues. QSPECT can also facilitate comparison of serial scans, thus informing on the evolution of specific tumour biology characteristics over time. Examples may include receptor expression or occupancy. This may have a particular role in therapeutic response assessment, particularly in peptide receptor radionuclide therapy.
The development of hybrid scanners with CT-based AC combined with new iterative reconstruction methods incorporating SC should facilitate QSPECT reconstruction. Unfortunately, despite these technical advances, quantitation with SPECT is not currently provided by major commercial gamma camera vendors despite being routinely available with PET equipment. A QSPECT method that is pragmatic, easy to implement and use in routine clinical setting would be highly desirable. With these principles in mind, we developed a QSPECT method using a commercially available SPECT/CT system supporting AC and SC, without recourse to programming or third-party software to reconstruct data. Our method requires minimal operator input, and relevant calculations are facilitated by the use of standard spreadsheet software.
Accuracy
We found that QSPECT recovered total activity was within a few percent of the calibrated activity in both phantom and patient acquisitions. Willowson et al.[8] used a similar methodology with lung ventilation and perfusion radiopharmaceuticals and demonstrated that virtually all the administered activity could be accounted for in a one-bed position SPECT/CT. We studied a systemic radiopharmaceutical and this included an estimation of activity in the non-scanned areas of body (distal limbs, head and neck), which was assumed to be of the same average level as that in proximal limbs (mixture of muscular, osseous and fatty tissues). This contributed only 8–19% of the total recovered activity. We feel this assumption is a reasonable alternative to whole-body SPECT scanning, which would be impractical in a clinical setting. Based on the whole-body planar scan that we also performed in these patients, there were no significant areas of uptake in the non-scanned areas (tumours and major target organs were all included in the SPECT/CT scan) and the non-specific background activity appeared visually quite homogeneous. Also, since the patients did not void between injection and imaging, the excreted activity was completely included in FOV.
We focused on the assessment of QSPECT’s ability to recover the total activity in sources, phantom and patients. Of course, the activity concentration in small volumes will be affected by partial volume effect and spill-over, and to a greater extent than with PET due to inherently lower SPECT spatial resolution[12]. This may explain, at least partly, the slightly lower accuracy we found when analyzing VOI data from phantom inserts. Partial volume effect correction can be achieved by determination and application of recovery coefficients to structures of known volume, as a post-processing analysis step[8,13,14].
When the relative distribution of activity was the same among the phantom’s compartments (Table 4, acquisitions 1–2 and 6–7), the activity was recovered with less than 14% difference between corresponding VOIs. Also, the total body activity of the patient we scanned on 2 occasions (Table 5, patient 5) was recovered with less than 4% difference. While further investigation is warranted to fully assess the reproducibility of this QSPECT protocol, these first results are encouraging.
In Table 6, we summarize our results and those from other groups who reported on QSPECT (with CT-based AC) in physical phantoms and patients. Although radionuclides, protocols and evaluation methods varied, our results are comparable with those of others, with mean absolute deviations below 10%. The SC method supported by the SPECT/CT system that we evaluated is based on dual- or triple-energy window techniques[11], which are not considered state-of-the-art approaches for quantitation by some authors[5]. Nevertheless, our results remain comparable with those of authors who used more sophisticated SC algorithms[8,9,17–19]. The fact that we calibrated our camera system with a wide range of source activities, with and without attenuating/scattering medium, and using our clinical AC SC SPECT protocol may have contributed to these encouraging results. A potential limitation of our validation method is the use of a phantom that is smaller (20 cm) than the diameter of the human body but due to the variability of body habitus and consequently its attenuation and scattering characteristics, we believe that the apparent accuracy of patient data are encouraging.
Table 6.
Comparison of QSPECT with CT-based AC: deviation of the measured activity from the calibrated activity in physical phantoms and patients
| Beauregard et al. | Zeintl et al. [16] | Willowson et al. [8] | Shcherbinin et al. [9] | Vandervoort et al. [17] | He et al. [18] | Du et al. [19] | Koral et al. [20] | |
|---|---|---|---|---|---|---|---|---|
| Radionuclide(s)/ radiopharmaceutical(s) | [177Lu]Octreotate | [99mTc]Diphosphonate | [99mTc]MAA, [99mTc]Technegas | 99mTc, 123I, 131I, 111In | 99mTc | 111In | 123I | 131I |
| SC method | DEW | DEW | TDSC | APD | APD, APDI | ESSE | ESSE, MBDC | TEW |
| Other corrections | DT, RR | RR, PVa | DT | RR | RR | RR | RR, PVa | RR, PVa |
| Sensitivity factor determination method | Corrected SPECT | Corrected SPECT | Non-corrected planar | Non-corrected planar | Not specified | Not specified | Planar geometric collimation | Corrected SPECT |
| Physical phantom studies | ||||||||
| Type(s) of phantom | Cylindrical | Cylindrical | Cylindrical, torso | Torso | Torso | Torso | Brain | Cylindrical |
| n (VOI/studies) | 23/7 | 6/1 | 3/2 | 8/4 | 6/2 | 6/1 | 5/1 | 8/2 |
| Mean absolute deviation (%)b | 5.6 | 4.6 | 2.6 | 3.9 | 3.1 | 2.7 | – | 9.9 |
| Deviation range (%) | −14.9 to + 4.3 | −6.8 to +2.8 | −4.1 to −1.7 | −4.5 to +5.1 | −8.0 to +4.0 | −5.1 to +4.3 | <2.4 | −23.8 to +18.5 |
| Clinical studies | ||||||||
| Type of acquisition | 2-bed | 1-bed | 1-bed | – | – | – | – | – |
| n (studies) | 6 | 16 | 12 | – | – | – | – | – |
| Mean absolute deviation (%)b | 2.6 | 8.1c | 2.6 | – | – | – | – | – |
| Deviation range (%) | −4.9 to 0.0 | −7.8 to +16.9 | −7.4 to +3.7 | – | – | – | – | – |
APD, analytic photon distribution; APDI, analytic photon distribution-interpolative; DT, dead-time; ESSE, effective source scatter estimation; DEW, dual-energy window; MBDC, model-based downscatter correction; MAA, macro-aggregated albumin; PV, partial volume; RR, resolution recovery; TDSC, transmission-dependent scatter correction; TEW, triple-energy window; VOI, volume of interest.
aPV correction was applied as a post-processing correction to recover activity from relatively small VOI in phantoms studies.
bIn cases where reported mean deviation was calculated from signed deviation results, we recalculated the mean absolute deviation from published data.
cUrine activity concentration.
To maintain this accuracy in routine clinical practice, quality control of the camera sensitivity must be performed on a regular basis, and if a significant deviation occurs, the sensitivity must be reassessed.
Dead-time correction
Our SPECT/CT system displays dead-time on the console monitor during the acquisition, but it does not record dead-time values, nor does it apply any dead-time correction to acquisition data. Therefore, post-acquisition dead-time correction was the main challenge in the elaboration of our QSPECT protocol. We developed a practical dead-time correction method using our system’s bundled software. Count rate and dead-time vary between angular steps and between bed positions. Our method allows the determination and the application of an average dead-time correction factor for each bed position reconstructed AC SC SPECT data. Our results show the importance of correcting for dead-time in the setting of post-[177Lu]octreotate therapy scanning.
We found that, at a given RPo, the observed dead-time would change depending on the presence or not of added attenuating/scattering medium (Fig. 4), but that at a given RWo the dead-time appeared to be independent of attenuation/scatter. This supports the hypothesis that any photon event occurring within the camera crystal, with an energy falling within photopeak or not, may be processed by the camera system and contribute to dead-time[15]. Delpon et al.[21] used a full-spectrum count rate (analogue to RWo) method for dead-time correction of planar scintigraphy. The use of such a method has not been reported before, to our knowledge, for dead-time correction of AC SC SPECT.
Willowson et al.[8] used the 99mTc photopeak energy window count rate (RPo) to establish the dead-time of their system and perform dead-time correction in patient QSPECT studies. Zeintl et al.[16] recently reported on 99mTc QSPECT in patients using the same SPECT/CT system and similar reconstruction methods as we do, but without dead-time correction. In both cases, the patients were administered diagnostic doses of 99mTc radiopharmaceuticals (lower counting rate and dead-time conditions than post-177Lu therapy scanning). Because of this, it is possible that the use of RWo in the first case, or even the application of dead-time correction in the second case would have had a minimal impact on their reported quantitation accuracy. However, our results suggest that dead-time correction improves the accuracy of post-[177Lu]octreotate therapy QSPECT scanning. Furthermore, the difference between the counting rate parameters (RWo vs RPo) used for dead-time correction may become significant when dead-time is non-negligible, particularly under varying attenuation/scatter conditions.
Garkavij et al. reported on [177Lu]octreotate dosimetry assessment using QSPECT[22]. However, they do not mention that dead-time correction was applied. Even at 24 h after a therapeutic injection of [177Lu]octreotate, when they performed the first SPECT study, average dead-time can be as high as 5–10% in patients with a high burden of neuroendocrine tumour disease and this could result in a systematic underestimation of uptake and absorbed doses.
QSPECT with other radionuclides
We plan to implement and validate this QSPECT method with other radionuclides commonly used in our oncological practice such as 99mTc, 111In, and 131I. Of course, the sensitivity of the camera system needs to be established for each radionuclide using its respective collimator and standardized SPECT/CT acquisition and processing protocols (including DEW or TEW SC, as appropriate). In theory, the dead-time constant based on RWo should be minimally affected by the radionuclide, but this needs to be investigated. Adjusting the acquisition time per frame for the relevant clinical application is important to avoid saturation of reconstructed SPECT dataset. If data saturation occurs, scaling down the photopeak and scatter series prior to reconstruction is warranted, otherwise the quantitative accuracy would be compromised.
Conclusion
We describe a practical method to use a commercially available SPECT/CT system to perform 177Lu QSPECT with high accuracy. We also show the importance of dead-time count losses when scanning high 177Lu activity. QSPECT will be useful for dosimetry assessment and serial post-therapy scan comparison in patients of our radionuclide therapy program. This technique could potentially be implemented and validated with other SPECT/CT systems and radionuclides, which may open the way to many novel clinical and research applications. It is also hoped that the gamma camera vendors will implement operator-friendly, state-of-the-art and fully integrated QSPECT processing in the very near future.
Acknowledgements
The authors are grateful to Micheal G. Stabin from the Department of Radiology and Radiological Sciences, Vanderbilt University (Nashville, TN), for reviewing this paper. Jean-Mathieu Beauregard was supported by a fellowship bursary award from Laval University (Quebec, Canada). Professor Hicks is the recipient of a Victorian Government Translational Research Grant through the Victorian Cancer Agency to study genomic and dosimetric factors predictive of response of neuroendocrine tumour to peptide receptor radionuclide therapy.
Footnotes
This paper is available online at http://www.cancerimaging.org. In the event of a change in the URL address, please use the DOI provided to locate the paper.
References
- 1.Huang SC. Anatomy of SUV. Standardized uptake value. Nucl Med Biol. 2000;27:643–6. doi: 10.1016/S0969-8051(00)00155-4. [DOI] [PubMed] [Google Scholar]
- 2.Siegel JA, Thomas SR, Stubbs JB, et al. MIRD pamphlet no. 16. Techniques for quantitative radiopharmaceutical biodistribution data acquisition and analysis for use in human radiation dose estimates. J Nucl Med. 1999;40:37S–61S. [PubMed] [Google Scholar]
- 3.Beauregard JM, Croteau E, Ahmed N, van Lier JE, Bénard F. Assessment of human biodistribution and dosimetry of 4-fluoro-11beta-methoxy-16alpha-18F-fluoroestradiol using serial whole-body PET/CT. J Nucl Med. 2009;50:100–7. doi: 10.2967/jnumed.108.057000. [DOI] [PubMed] [Google Scholar]
- 4.Zaidi H, Koral KF. Scatter modelling and compensation in emission tomography. Eur J Nucl Med Mol Imaging. 2004;31:761–82. doi: 10.1007/s00259-004-1495-z. [DOI] [PubMed] [Google Scholar]
- 5.Rosenthal MS, Cullom J, Hawkins W, Moore SC, Tsui BM, Yester M. Quantitative SPECT imaging: a review and recommendations by the Focus Committee of the Society of Nuclear Medicine Computer and Instrumentation Council. J Nucl Med. 1995;36:1489–513. [PubMed] [Google Scholar]
- 6.Sorenson JA. Deadtime characteristics of Anger cameras. J Nucl Med. 1975;16:284–8. [PubMed] [Google Scholar]
- 7.Chiesa C, Negri A, Albertini C, et al. A practical dead time correction method in planar activity quantification for dosimetry during radionuclide therapy. Q J Nucl Med Mol Imaging. 2009;53:658–70. [PubMed] [Google Scholar]
- 8.Willowson K, Bailey DL, Baldock C. Quantitative SPECT reconstruction using CT-derived corrections. Phys Med Biol. 2008;53:3099–112. doi: 10.1088/0031-9155/53/12/002. [DOI] [PubMed] [Google Scholar]
- 9.Shcherbinin S, Celler A, Belhocine T, Vanderwerf R, Driedger A. Accuracy of quantitative reconstructions in SPECT/CT imaging. Phys Med Biol. 2008;53:4595–604. doi: 10.1088/0031-9155/53/17/009. [DOI] [PubMed] [Google Scholar]
- 10.Schötzig U, Schrader H, Schönfeld E, Günther E, Klein R. Standardisation and decay data of 177Lu and 188Re. Appl Radiat Isot. 2001;55:89–96. doi: 10.1016/s0969-8043(00)00362-6. [DOI] [PubMed] [Google Scholar]
- 11.Ichihara T, Ogawa K, Motomura N, Kubo A, Hashimoto S. Compton scatter compensation using the triple-energy window method for single- and dual-isotope SPECT. J Nucl Med. 1993;34:2216–21. [PubMed] [Google Scholar]
- 12.Hoffman EJ, Huang SC, Phelps ME. Quantitation in positron emission computed tomography: 1. Effect of object size. J Comput Assist Tomogr. 1979;3:299–308. doi: 10.1097/00004728-197906000-00001. [DOI] [PubMed] [Google Scholar]
- 13.Srinivas SM, Dhurairaj T, Basu S, Bural G, Surti S, Alavi A. A recovery coefficient method for partial volume correction of PET images. Ann Nucl Med. 2009;23:341–8. doi: 10.1007/s12149-009-0241-9. [DOI] [PubMed] [Google Scholar]
- 14.Pereira JM, Stabin MG, Lima FR, Guimaraes MI, Forrester J. Image quantification for radiation dose calculations – limitations and uncertainties. Health Phys. 2010;99:688–701. doi: 10.1097/HP.0b013e3181e28cdb. [DOI] [PMC free article] [PubMed] [Google Scholar]
- 15.Arnold JE, Johnston AS, Pinsky SM. The influence of true counting rate and the photopeak fraction of detected events on Anger camera deadtime. J Nucl Med. 1974;15:412–6. [PubMed] [Google Scholar]
- 16.Zeintl J, Vija AH, Yahil A, Hornegger J, Kuwert T. Quantitative accuracy of clinical 99mTc SPECT/CT using ordered-subset expectation maximization with 3-dimensional resolution recovery, attenuation, and scatter correction. J Nucl Med. 2010;51:921–8. doi: 10.2967/jnumed.109.071571. [DOI] [PubMed] [Google Scholar]
- 17.Vandervoort E, Celler A, Harrop R. Implementation of an iterative scatter correction, the influence of attenuation map quality and their effect on absolute quantitation in SPECT. Phys Med Biol. 2007;52:1527–45. doi: 10.1088/0031-9155/52/5/020. [DOI] [PubMed] [Google Scholar]
- 18.He B, Frey EC. Comparison of conventional, model-based quantitative planar, and quantitative SPECT image processing methods for organ activity estimation using In-111 agents. Phys Med Biol. 2006;51:3967–81. doi: 10.1088/0031-9155/51/16/006. [DOI] [PubMed] [Google Scholar]
- 19.Du Y, Tsui BM, Frey EC. Model-based compensation for quantitative 123I brain SPECT imaging. Phys Med Biol. 2006;51:1269–82. doi: 10.1088/0031-9155/51/5/016. [DOI] [PubMed] [Google Scholar]
- 20.Koral KF, Yendiki A, Dewaraja YK. Recovery of total I-131 activity within focal volumes using SPECT and 3D OSEM. Phys Med Biol. 2007;52:777–90. doi: 10.1088/0031-9155/52/3/017. [DOI] [PubMed] [Google Scholar]
- 21.Delpon G, Ferrer L, Lisbona A, Bardiès M. Correction of count losses due to deadtime on a DST-XLi (SmVi-GE) camera during dosimetric studies in patients injected with iodine-131. Phys Med Biol. 2002;47:N79–N90. doi: 10.1088/0031-9155/47/7/402. [DOI] [PubMed] [Google Scholar]
- 22.Garkavij M, Nickel M, Sjögreen-Gleisner K, et al. 177Lu-[DOTA0,Tyr3] octreotate therapy in patients with disseminated neuroendocrine tumors: analysis of dosimetry with impact on future therapeutic strategy. Cancer. 2010;116:1084–92. doi: 10.1002/cncr.24796. [DOI] [PubMed] [Google Scholar]