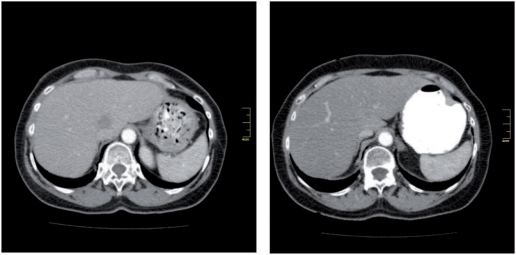
Abstract
Neoadjuvant systemic therapy may induce steatosis or sinusoid obstruction syndrome in the liver. The aim of this study was to investigate the influence of systemic therapy with irinotecan, oxaliplatin and cetuximab on conspicuity of liver metastases on computed tomography (CT). CT scans of 48 patients with initial unresectable colorectal liver metastases which were treated in a Europe-wide, opened, randomized phase II trial receiving oxaliplatin or irinotecan combined with folinic acid and cetuximab were analysed. The density of the metastases and the liver parenchyma before and after systemic therapy were analysed by region-of-interest technique and the tumour-to-liver difference (dHU TLD). The mean density of liver parenchyma and liver metastases did not vary significantly before and after neoadjuvant therapy on plain (56.3 ± 8.1 HU, 54.8 ± 13.5 HU) and arterial enhanced CT (76.0 ± 15.7 HU, 70.5 ± 20.4 HU). There was a significant reduction (105.6 ± 17.3 HU, 93.3 ± 18.2 HU) in the density of liver parenchyma on portal venous scans after systemic therapy (p < 0.0001) and a reduction of dHU TLD, consecutively. In patients with colorectal liver metastases, neoadjuvant chemotherapy may have a toxic impact on liver parenchyma resulting in reduced tumour-to-liver contrast in contrast-enhanced CT. This may lead to underestimation of real lesion size.
Keywords: Computed tomography, liver, colorectal carcinoma, neoadjuvant therapy
Introduction
Approximately 50% of patients with colorectal cancer develop liver metastases at some point during the course of their disease[1]. Unfortunately, only 10–15% of patients diagnosed with colorectal liver metastases are candidates for curative resection[2]. In cases of non-resectable liver metastasis with potential resectability after down-staging, intensive systemic chemotherapy should be applied to reach the aim of secondary resectability[3]. Nowadays, chemotherapy regimens such as combined use of folinic acid and oxaliplatin (folinic acid, fluorouracil, oxaliplatin; FOLFOX) or irinotecan (folinic acid, fluorouracil, irinotecan; FOLFIRI) are the recommended and prevailing protocols[4]. Additionally, targeting agents such as cetuximab have experienced a significant upturn recently[5] and may convert initially non-resectable liver metastases into resectable ones with potentially curative intent[6]. Nevertheless, systemic chemotherapy may induce severe adverse events that may potentially reduce the patient’s quality of life and tumour resectability.
Hepatotoxity may be due to the development of steatosis or sinusoid obstruction syndrome (blue liver) and occur after treatment with both irinotecan and oxaliplatin[7,8]. Variance in liver texture after chemotherapy might be detectable with computed tomography (CT). The attenuation value in the healthy liver is normally 50–57 Hounsfield units (HU) on plain CT and decreases 1.6 HU for each milligram of triglycerides deposited per gram of hepatic tissue[9].
In several ongoing studies on neoadjuvant treatment of liver metastases from colorectal cancer, CT is still the method of choice for the evaluation of response and the measurement of tumour size and the distance to adjoining vessels such as the liver artery, portal vein and liver vein. The surgical decision on whether a patient technically may be treated by liver resection or not is usually based on CT scans. Therefore, any factor that may influence the contrast between liver metastases and liver parenchyma may be fateful for the prognosis of the patient. However, magnetic resonance imaging (MRI) seems to be a superior modality in detecting lesions, especially in patients treated with neoadjuvant chemotherapy[10].
The aim of this study was to explore if chemotherapy-induced alteration of liver parenchyma may influence the attenuation of tumours, parenchyma or tumour-to-liver difference (dHU TLD) on CT.
Patients and methods
Study design
The study was a retrospective evaluation of CT scans of patients with initially unresectable liver metastases from colorectal cancer (CRC) using the data from a Europe-wide randomized multicenter trial that tested the feasibility and the outcome of neoadjuvant treatment with cetuximab plus FA and oxaliplatin (FOLFOX) or irinotecan (FOLFIRI). The initial study has been approved by the institutional ethics committee and written informed consent was obtained from all participants. Liver metastases were synchronous or metachronous and histologically validated.
The inclusion criteria were:
non-resectable liver metastases without extrahepatic disease (non-resectability was defined in cases where 5 or more liver metastases were present or liver metastases were deemed technically non-resectable, depending on the remaining functional tissue, present infiltration of all liver veins, 2 liver arteries, both portal branches or both bile ducts)
18 years or older
if the patient had simultaneous metastases, the primary tumour had been resected not less than 1 month before chemotherapy
Karnofsky performance status of 80 or higher
acceptable bone marrow, liver and renal function
Exclusion criteria were:
extrahepatic metastases, lymph node metastases
primary tumour recurrence
prior chemotherapy (except adjuvant, > 6 months ago)
prior EGFR (epidermal growth factor receptor) targeting-therapy
radiotherapy / major surgery < 4 weeks ago
systemic therapy
clinically relevant coronary disease
myocardial infarction < 12 months ago
peripheral neuropathy > CTC grade I
inflammatory bowel disease
previous malignancy (except CRC, basal cell carcinoma, pre-invasive carcinoma of the cervix)
severe psychiatric illness
drug- or alcohol abuse
breast-feeding or pregnant women
Study groups
The sample was composed of 74 patients randomized to a combination of cetuximab (400 mg/m2 and 250 mg/m2 weekly) plus FOLFOX (oxaliplatin 100, folinic acid 400, fluorouracil 400 (bolus) and 2400 mg/m2) or cetuximab plus FOLFIRI (irinotecan 180, folinic acid 400, fluorouracil 400 (bolus) and 2400 mg/m2) as neoadjuvant treatment for 4 months (8 cycles). Prior to chemotherapy, baseline CT scans were recorded for each patient both plain and enhanced (arterial, portal venous and venous phase). On an average of 16 weeks later, follow-up CT scans were recorded under the same conditions. Due to different CT systems at the participating centres, the CT protocol and technical values such as slice thickness and tube voltage were not standardized. Forty-eight of 74 patients (64.9%) with corresponding CT scans both at baseline and at follow-up were included in this study.
Patients with baseline CT only (n = 7), e.g. because of death, or follow-up CT (n = 2) in a different CT phase, with positron emission tomography (PET)/CT or MRI (n = 9) and with non-corresponding CT phases at baseline and follow-up (n = 8) were excluded.
Eighty-four different phases of these 48 patients were available and assorted into 3 definitive study groups: plain CT phase (n = 24; group 1), arterial phase (n = 30; group 2), portal venous phase (n = 30; group 3). The 48 study patients were characterized by a male/female ratio of 32:16 and a mean age of 62.9 years with an age range of 35–79 years (Table 1). The patients in the study group were selected from 12 European hospitals participating in the CELIM trial. The interval between baseline CT scan and follow-up scan was 117 days (median 122 days) (17 weeks; median 17 weeks) (Table 2).
Table 1.
Characteristics of all 74 patients in the study including CT phases, sex and age in years
| Patient characteristics | Number | % |
|---|---|---|
| Patients with CRC metastasis screened | 74 | 100 |
| Baseline and follow-up existing | 56 | 75.7 |
| Same CT phase at baseline and follow-up | 48 | 64.9 |
| Cumulative CT phases | 85 | |
| Sex | ||
| Male | 32 | 66.7 |
| Female | 16 | 33.3 |
| Age (years) | ||
| Mean | 62.9 | |
| Median | 64 | |
| Range | 35–79 |
Table 2.
Method/CT characteristics and time characteristics of the study
| Characteristics | Number | % |
|---|---|---|
| CT phases | ||
| Plain | 24 | 28.2 |
| Arterial | 30 | 35.3 |
| Portal venous | 30 | 35.3 |
| Venous | 1 | 1.2 |
| Days between baseline and follow-up | ||
| Mean | 117 | |
| Median | 122 | |
| Weeks between baseline and follow-up | ||
| Mean | 17 | |
| Median | 17 | |
Measurements
Liver parenchyma
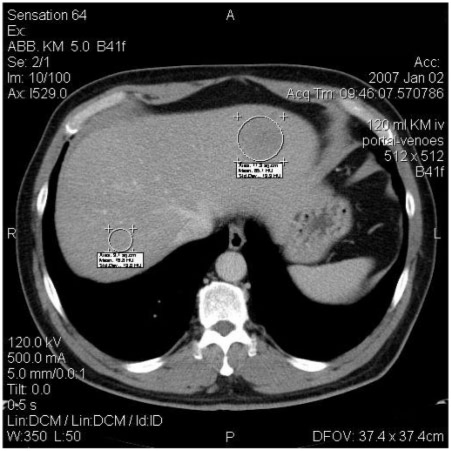
For semiquantitative analysis, attenuation of liver parenchyma (HU) was measured. Circular regions of interest (ROI) were centred in the lesion-free liver parenchyma avoiding liver veins and arteries as well as other pathologic and non-pathologic structures (Fig. 1). To increase the reliability, ROIs were measured over 3 ± 0.4 cm2. Each analysis was performed 3 times. Attenuation of liver parenchyma was compared at baseline CT and at follow-up CT using the mean value of these 3 measurements.
Figure 1.
Measurement in right liver lobe: evaluation of density of liver parenchyma by placement of defined ROIs on selected regions in liver avoiding pathological structures or vessels. Measurement in left liver lobe: evaluation of density of metastasis by circulating ROI.
Liver metastases
To study the potential alteration of attenuation of liver metastases, they were evaluated in the same way as liver parenchyma except for the magnitude of the ROIs. For each patient, one target lesion was chosen and measured 3 times with circular ROIs. In every CT phase (plain, arterial, portal venous) in one patient, the same metastasis was chosen. If metastases were inhomogeneous, e.g. because of central necrosis, density was measured peripherally in the lesion. Therefore, non-permissible deviations of values could be prevented. Metastases were circled by ROI each as their true enlargement and not for a defined size as in the evaluation of liver parenchyma.
Calculations and statistics
Liver parenchyma
To assess reactions and pathologic changes in liver parenchyma due to the 2 chemotherapy strategies, all measurements of attenuation of parenchyma at baseline and at follow-up were included. Only the mean values of any 3 measurements were used. Differences in mean values between baseline and follow-up were calculated for all phases. The arithmetic mean was calculated from all values of attenuation of parenchyma in the plain group (n = 24), the arterial group (n = 30), and the portal venous group (n = 30). The availability of normal distribution in the study group was proven and affirmed for the paired t-test. Thus, statistical significance could be proved using the paired t-test.
TLD
To assess the contrast of liver metastases to lesion-free liver parenchyma, TLD was used for all values of attenuation at baseline and follow-up CT scans for every CT phase and every patient. Each baseline CT was compared with the corresponding follow-up CT for one CT phase and differences between attenuation values were calculated. Those data were arranged in the same groups (plain, arterial phase, portal venous phase). Statistical significance was proved using the paired t-test.
Results
Liver parenchyma
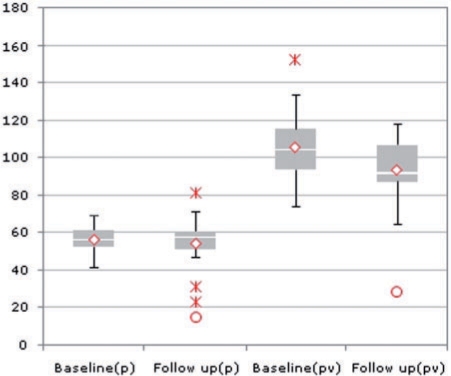
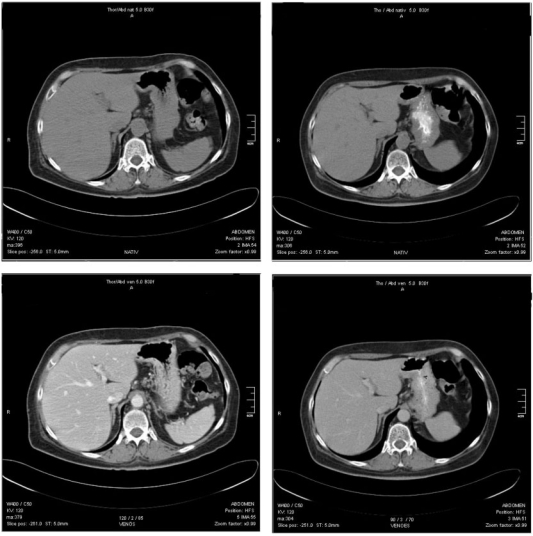
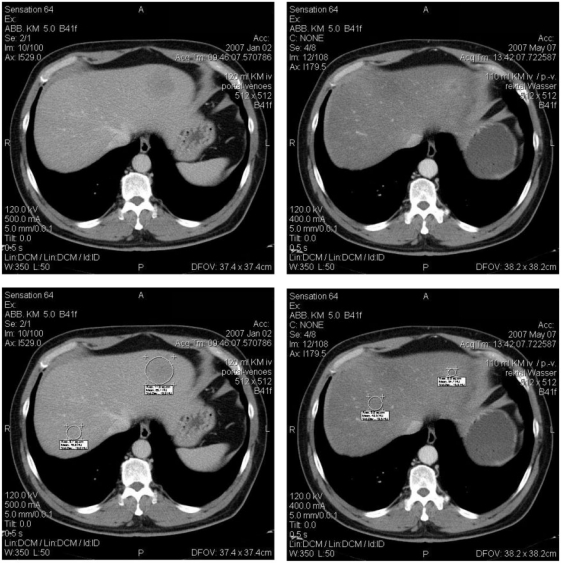
In plain CT (blinded to therapy), the mean attenuation was 56.3 ± 8.1 HU at baseline CT and 54.8 ± 13.5 HU at follow-up CT. Within the arterial phase, the values were 76.0 ± 15.7 HU and 70.5 ± 20.4 HU, and within the portal venous phase mean attenuation was 105.6 ± 17.3 HU and 93.3 ± 18.2 HU. The average difference in attenuation between liver parenchyma at baseline CT and at follow-up CT was −1.4 ± 9.2 HU on plain CT. Using the paired t-test, no significant decrease in density in liver parenchyma (p = 0.22) was seen (Figs. 2, 4). Regarding the portal venous phase, a significant decrease between attenuation of liver parenchyma at baseline CT and at follow-up CT was detected (−12.3 ± 15.2 HU; p < 0.0001) (Figs. 2–4). The same tendency was entirely recognizable in the arterial phase (−5.59 ± 22.2 HU; p = 0.088; Fig. 5).
Figure 2.
Box plot showing the density of liver parenchyma in plain CT (p) and in portal venous phase (pv) in baseline and follow-up in HU; decreasing densities from baseline to follow-up in portal venous phase is significant. In plain CT the same tendency is recognizable but not significant.
Figure 4.
Top: plain CT of one patient; baseline (left), follow-up (right); note the less decreased density of liver parenchyma; baseline 54.3 HU, follow-up 61.4 HU. Bottom: same patient portal venous phase; baseline (left), follow-up (right); note the significantly decreased contrast, baseline 126.6 HU, follow-up 89.2 HU.
Figure 3.
CT of portal venous phase. Top: images without measurements, baseline (left) and follow-up (right). Bottom: same images with measurements, baseline (left) and follow-up (right); the difference in density of liver parenchyma is clearly recognizable (baseline 75.4 HU, follow-up 41.6 HU).
Figure 5.
CT of the arterial phase; baseline (left), follow-up (right); note the decreased density of liver parenchyma, not significant; metastasis no longer identifiable.
After unblinding of the study, the significance of decreasing densities was shown equally in portal venous CT both in the FOLFOX and FOLFIRI groups (FOLFOX, n = 24 patients, portal venous CT dHU −9.6 ± 15.0; FOLFIRI, n = 21 patients, portal venous CT dHU −15.6 ± 16.6; no assignment possible for 3 patients).
TLD
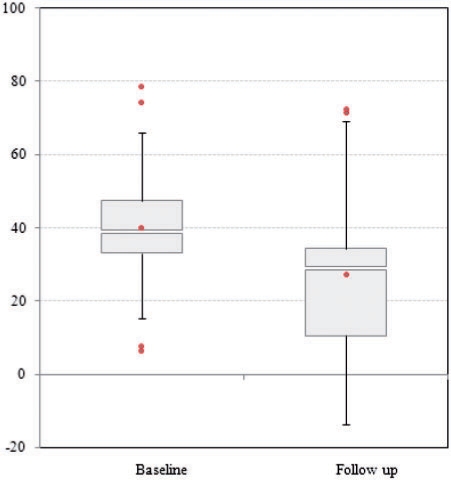
TLD was used to show the change in contrast between liver metastases and liver parenchyma. Therefore, the mean values of attenuation of metastases and liver parenchyma were calculated and subtracted. The mean value of TLD at plain baseline CT was 15.8 ± 8.9 HU and 16.4 ± 12.3 HU at follow-up CT, and did not differ significantly (0.6 ± 13.2 HU) on arterial phase (23.0 ± 11.3 HU versus 22.9 ± 18.9 HU; dHU −0.1 ± 15.8). In contrast, TLD differed significantly within the portal venous phase (40.2 ± 17.9 HU versus 28.4 ± 20.2 HU, dHU −12.3 ± 19.8; p < 0.001). Using the paired t-test a significant decrease in TLD between baseline and follow-up CT was shown in the portal venous phase (Fig. 6). After unblinding, significances were the same for portal venous CT in both treatment groups (FOLFIRI and FOLFOX). Table 3 shows means and standard deviations of attenuation of liver parenchyma after unblinding to chemotherapy, and Table 4 shows TLD at both baseline CT and follow-up CT.
Figure 6.
Box plot showing alteration of tumour-to-liver difference between baseline and follow-up in portal venous phase; note the decrease in contrast, significant.
Table 3.
Density of liver parenchyma at baseline and follow-up (in HU) and dHU (baseline−follow-up) for all patients, unblinded to chemotherapy (FOLFOX and FOLFIRI)
| Density of liver parenchyma |
dHU (mean HU ± SD) | p value | |||
|---|---|---|---|---|---|
| Baseline (mean HU ± SD) | Follow-up (mean HU ± SD) | ||||
| FOLFOX + FOLFIRI | Plain | 56.2 ± 8.2 | 54.9 ± 13.2 | −1.3 ± 9.0 | 0.24 n.s. |
| Arterial | 76.7 ± 16.0 | 71.1 ± 20.4 | −5.59 ± 22.2 | 0.1 n.s. | |
| Portal venous | 106.2 ± 17.3 | 93.8 ± 18.4 | −12.4 ± 15.5 | 0.0001 s. | |
| FOLFOX | Plain | 58.8 ± 6.4 | 59.6 ± 4.9 | 0.8 ± 5.6 | 0.32 n.s |
| Arterial | 75.7 ± 11.9 | 71.2 ± 15.2 | −4.5 ± 13.3 | 0.12 n.s. | |
| Portal venous | 107.1 ± 15.6 | 97.5 ± 11.9 | −9.6 ± 15.0 | 0.01 s. | |
| FOLFIRI | Plain | 53.7 ± 9.2 | 50.3 ± 17.1 | −3.7 ± 11.6 | 0.15 n.s. |
| Arterial | 77.8 ± 19.7 | 71.0 ± 25.2 | −6.7 ± 29.0 | 0.20 n.s. | |
| Portal venous | 105.0 ± 19.7 | 89.3 ± 24.0 | −15.6 ± 16.6 | 0.005 s. | |
n.s., not significant; s., significant.
Table 4.
Tumour-to-liver density (TLD) at baseline and follow-up (in HU) and difference in TLD (baseline−follow-up) for all patients, unblinded to chemotherapy (FOLFOX and FOLFIRI)
| TLD |
Difference in TLD (mean HU ± SD) | p value | |||
|---|---|---|---|---|---|
| Baseline (mean HU ± SD) | Follow-up (mean HU ± SD) | ||||
| FOLFOX + FOLFIRI | Plain | 15.8 ± 9.0 | 16.3 ± 12.4 | −0.6 ± 13.2 | 0.417 n.s. |
| Arterial | 22.5 ± 11.1 | 23.4 ± 19.5 | 0.9 ± 15.7 | 0.382 n.s. | |
| Portal venous | 40.5 ± 18.2 | 27.8 ± 20.3 | −12.8 ± 19.7 | 0.0008 s. | |
| FOLFOX | Plain | 20.6 ± 7.3 | 19.4 ± 11.0 | −1.3 ± 11.0 | 0.347 n.s. |
| Arterial | 23.5 ± 11.4 | 27.0 ± 19.4 | 3.5 ± 17.3 | 0.232 n.s. | |
| Portal venous | 46.6 ± 17.0 | 34.3 ± 23.5 | −12.3 ± 21.4 | 0.018 s. | |
| FOLFIRI | Plain | 10.9 ± 8.0 | 13.3 ± 11.6 | 2.4 ± 15.4 | 0.299 n.s. |
| Arterial | 21.4 ± 11.2 | 19.7 ± 19.6 | −1.7 ± 14.2 | 0.33 n.s. | |
| Portal venous | 33.1 ± 17.3 | 19.7 ± 12.1 | −13.3 ± 18.2 | 0.01 s. | |
n.s., not significant; s., significant.
Metastases
The mean attenuation of metastases in the plain phase was 40.4 ± 8.3 HU at baseline CT and 42.2 ± 16.9 HU at follow-up CT; in the arterial phase it was 53.6 ± 19.9 HU and 48.2 ± 16.5 HU; and in the portal venous phase it was 65.9 ± 18.8 HU at baseline CT and 66.1 ± 23.5 HU at follow-up CT. The average difference in attenuation of metastases between baseline and follow-up was 1.7 ± 14.2 HU in plain CT (p = 0.56). Within the arterial phase, the mean difference was −5.4 ± 18.7 HU (p = 0.12) and within the portal venous phase it was 0.7 ± 18.2 HU (p = 0.83).
Using the paired t-test it was not possible to show a significant difference between attenuation of metastases before and after chemotherapy.
When adding the number of measurements implemented by using the peripheral area of the metastasis, e.g. because of central necrosis, 67/84 metastases (80%) were counted at baseline CT. In contrast, only 17 metastases (20%) were homogeneous before chemotherapy using the measurement of the whole metastasis. One metastasis (1%) could not be recognized clearly at baseline, so the attenuation value of liver parenchyma was used instead. At follow-up, 33 metastases (39%) were measured using the peripheral area, 44 (52%) by sizing the whole metastasis; 8 metastases (10%) were no longer distinguishable.
Discussion
The present study has shown a possible relationship between neoadjuvant chemotherapy in patients with liver metastases from CRC and alterations in liver parenchyma that may influence the attenuation on CT scans.
The results indicate that those changes in structure can account for potential underestimation of liver metastases due to decreased contrast of tumour to liver in CT. Whereas plain CT is best for prediction of pathologic fat content[11], the portal venous phase is more applicable for demarcating liver metastases from parenchyma[12,13]. Several studies have demonstrated the occurrence of secondary effects like steatosis during chemotherapy against colorectal liver metastases[8,14,15]. Vauthey et al.[8] suggested that 17.4% of 248 patients treated with chemotherapy developed either steatohepatitis or steatosis. Whereas steatohepatitis was strongly associated with irinotecan usage, steatosis was not associated with a specific chemotherapy regimen[8]. Pawlik et al.[15] blamed irinotecan for inducing both steatohepatitis and steatosis.
One reason for the significant reduction in dHU in portal venous phase might be the sinusoid obstruction syndrome as an important toxic side effect of neoadjuvant treatment. Sinusoidal reaction such as dilatation and congestion because of perisinusoidal obstruction has been described in several studies examining, e.g. the effect of oxaliplatin on liver texture[8,16,17]. Rubbia-Brandt et al.[18] reported that oxaliplatin-based chemotherapy causes microscopic injuries in endothelial cells resulting in endothelial wall disruption. Subsequent sloughing causes congestion and therefore delayed contrast agent enhancement. Thus, attenuation of liver parenchyma should decrease in the portal venous phase on CT, but this has not been observed until now. Unfortunately, no systematic analysis of resected liver specimens was available in this retrospective and multicentric study. Further studies should focus on the correlation between the presence or absence of histologically verified sinusoid obstruction syndrome and changes in liver attenuation in the portal venous phase.
However, many other factors may explain the reduced contrast enhancement in the portal venous phase. Tumour-related factors may change perfusion in the parenchyma adjacent to the lesion and in the whole organ. Kruskal et al.[19] showed in an animal study that alteration in sinusoidal and postsinusoidal vessels leads to changes in hepatic blood flow before metastases can be visualized by radiological imaging. Moreover, flow rates in the parenchyma adjacent to the metastasis are reduced due to direct compression and increase leukocyte adherence to the vessel. Leggett et al.[20] observed arterial flow changes in patients with hepatic metastasis and concluded that this change in flow and attenuation may lead to misinterpretation of real lesion size in CT.
Although patients with various primary tumours were included in this study, an influence on liver–lesion contrast must be assumed. Different CT systems and an inconsistent CT examination protocol with potential variations in, e.g. tube voltage and contrast dosage before and after treatment, may influence attenuation. Slight deviation in tube voltage may result in attenuation variance as well as patient-related factors such as changes in body weight[21,22].
Steatosis also leads to varied attenuation of liver parenchyma. The change in CT attenuation increases as the fat content increases[23]. Examining liver parenchyma on plain CT, a reduction in attenuation was recognizable by tendency but no significance was shown. Therefore, the occurrence of steatosis could not be proven in the FOLFIRI group or the FOLFOX group. Small sample size for plain CT in relation to contrast-enhanced phases could be a limiting factor.
Most colorectal liver metastases are nodular in shape[24]. Hence, circular ROIs were used for measurement of each metastasis including the whole area infiltrated with lesion mass. The percentage of measurements of metastases implemented using a peripheral area of the lesion was 79% at baseline and 39% at follow-up. Only 20% of metastases could be measured by circling the whole lesion before chemotherapy in contrast to 52% after. These findings indicate that neoadjuvant chemotherapy of colorectal liver metastases alters their appearance from inhomogeneous with central necrosis to homogeneous. Ng et al.[25] agree with the point that central necrosis is more prominent in untreated metastases, but regresses after chemotherapy. Aloysius et al.[14] affirm that inhomogeneity of metastases is much more pronounced in treated patients. However, 50% of liver metastases in their patients were fibrotic so that diagnosis of central necrosis could be more difficult.
In the present study, there was no significant difference between attenuation of metastases before and after chemotherapy. Thus, the difference was only influenced by decreasing attenuation of parenchyma. If TLD is reduced, the contrast between liver parenchyma and metastasis is altered, so that it is difficult to detect metastases in their true dimensions.
Scott et al.[26] suggested that 77.4% of 84 colorectal liver metastases examined had a hypovascular enhancement pattern in the portal venous phase compared with normal liver parenchyma. Any factor that is associated with reduced attenuation of liver parenchyma, such as sinusoidal obstruction syndrome, might lead to a more complicated detection of hypovascular metastases.
The current results confirm the assumption of Benoist et al.[27] that morphologic changes to the structure of liver caused by chemotherapy may be responsible for underestimating metastases in the liver. However, our study could not blame one special chemotherapeutic agent. The effects on liver parenchyma requires better resection of downstaged liver metastases by enlarging the margin of metastases removed including the site of metastases that have disappeared[28]. Additionally, it would be advisable to offer other imaging techniques such as MRI or PET/CT to patients in whom liver metastases are no longer visible.
Conclusion
In patients with colorectal liver metastases, neoadjuvant chemotherapy (FOLFOX/FOLFIRI) may have a toxic impact on liver parenchyma resulting in reduced contrast of tumour to liver in contrast-enhanced CT. This may lead to underestimation of real lesion size.
Footnotes
This paper is available online at http://www.cancerimaging.org. In the event of a change in the URL address, please use the DOI provided to locate the paper.
References
- 1.Leonard GD, Brenner B, Kemeny NE. Neoadjuvant chemotherapy before liver resection for patients with unresectable liver metastases from colorectal carcinoma. J Clin Oncol. 2005;23:2038–48. doi: 10.1200/JCO.2005.00.349. [DOI] [PubMed] [Google Scholar]
- 2.Aloia TA, Sebagh M, Plasse M, et al. Liver histology and surgical outcomes after preoperative chemotherapy with fluorouracil plus oxaliplatin in colorectal cancer liver metastases. J Clin Oncol. 2006;24:4983–90. doi: 10.1200/JCO.2006.05.8156. [DOI] [PubMed] [Google Scholar]
- 3.Weber T, Link KH. Radikale Chirurgie bei primaer metastasierten kolorektalen Karzinomen. Chir Gastroenterol. 2007;23:360–6. doi: 10.1159/000110482. [DOI] [Google Scholar]
- 4.Benoist S, Nordlinger B. Neoadjuvant treatment before resection of liver metastases. Eur J Surg Oncol. 2007;33:35–41. doi: 10.1016/j.ejso.2007.09.022. [DOI] [PubMed] [Google Scholar]
- 5.Mahtani RL, Macdonald JS. Synergy between cetuximab and chemotherapy in tumors of the gastrointestinal tract. Oncologist. 2008;13:39–50. doi: 10.1634/theoncologist.2006-0049. [DOI] [PubMed] [Google Scholar]
- 6.Tabernero J, Van Cutsem E, Diaz-Rubio E, et al. Phase II trial of cetuximab in combination with fluorouracil, leucovorin and oxaliplatin in the first-line treatment of metastatic colorectal cancer. J Clin Oncol. 2007;25:5225–32. doi: 10.1200/JCO.2007.13.2183. [DOI] [PubMed] [Google Scholar]
- 7.Fernandez FG, Ritter J, Goodwin JW, Linehan DC, Hawkins WG, Strasberg SM. Effect of steatohepatitis associated with irinotecan or oxaliplatin pretreatment on resectability of hepatic colorectal metastases. J Am Coll Surg. 2005;200:845–53. doi: 10.1016/j.jamcollsurg.2005.01.024. [DOI] [PubMed] [Google Scholar]
- 8.Vauthey JN, Pawlik TM, Ribero D, et al. Chemotherapy regimen predicts steatohepatitis and an increase in 90-day mortality after surgery for hepatic colorectal metastases. J Clin Oncol. 2006;24:2065–72. doi: 10.1200/JCO.2005.05.3074. [DOI] [PubMed] [Google Scholar]
- 9.Bydder GM, Chapman RW, Harry D, Bassan L, Sherlock S, Kreel L. Computed tomography attenuation values in fatty liver. J Comput Tomogr. 1981;5:33–5. doi: 10.1016/0149-936X(81)90054-0. [DOI] [PubMed] [Google Scholar]
- 10.Kulemann V, Schima W, Tamandl D, et al. Preoperative detection of colorectal liver metastases in fatty liver: MDCT or MRI? Eur J Radiol. 2010 doi: 10.1016/j.ejrad.2010.03.004. doi:10.1016/j.ejrad.2010.03.004. [DOI] [PubMed] [Google Scholar]
- 11.Kodama Y, Ng CS, Wu TT, et al. Comparison of ct methods for determining the fat content of the liver. Am J Roentgenol. 2007;188:1307–12. doi: 10.2214/AJR.06.0992. [DOI] [PubMed] [Google Scholar]
- 12.Ong KO, Leen E. Radiological staging of colorectal liver metastases. Surg Oncol. 2007;16:7–14. doi: 10.1016/j.suronc.2007.04.001. [DOI] [PubMed] [Google Scholar]
- 13.Sheafor DH, Frederick MG, Paulson EK, et al. Comparison of unenhanced, hepatic arterial-dominant, and portal venous-dominant phase helical CT for the detection of liver metastases in women with breast carcinoma. Am J Roentgenol. 1999;172:961–8. doi: 10.2214/ajr.172.4.10587129. [DOI] [PubMed] [Google Scholar]
- 14.Aloysius MM, Zaitoun AM, Beckingham IJ, et al. The pathological response to neoadjuvant chemotherapy with Folfox-4 for colorectal liver metastases: a comparative study. Virchows Arch. 2007;451:943–8. doi: 10.1007/s00428-007-0497-1. [DOI] [PubMed] [Google Scholar]
- 15.Pawlik TM, Olino K, Gleisner AL, et al. Preoperative chemotherapy for colorectal liver metastases: Impact on hepatic histology and postoperative outcome. J Gastrointest Surg. 2007;11:860–8. doi: 10.1007/s11605-007-0149-4. [DOI] [PubMed] [Google Scholar]
- 16.Bilchik AJ, Poston G, Curley SA, et al. Neoadjuvant chemotherapy for metastatic colon cancer: a cautionary note. J Clin Oncol. 2005;23:9073–8. doi: 10.1200/JCO.2005.03.2334. [DOI] [PubMed] [Google Scholar]
- 17.Karoui M, Penna C, Amin-Hashem M, et al. Influence of preoperative chemotherapy on the risk of major hepatectomy for colorectal liver metastases. Ann Surg. 2006;243:1–7. doi: 10.1097/01.sla.0000193603.26265.c3. [DOI] [PMC free article] [PubMed] [Google Scholar]
- 18.Rubbia-Brandt L, Audard V, Sartoretti P, et al. Severe hepatic sinusoidal obstruction associated with oxaliplatin-based chemotherapy in patients with metastatic colorectal cancer. Ann Oncol. 2004;15:460–6. doi: 10.1093/annonc/mdh095. [DOI] [PubMed] [Google Scholar]
- 19.Kruskal JB, Thomas P, Kane RA, Goldberg SN. Hepatic perfusion changes in mice livers with developing colorectal cancer metastases. Radiology. 2004;231:482–90. doi: 10.1148/radiol.2312030160. [DOI] [PubMed] [Google Scholar]
- 20.Leggett DA, Kelley BB, Bunce IH, Miles KA. Colorectal cancer: diagnostic potential of CT measurements of hepatic perfusion and implications for contrast enhancement protocols. Radiology. 1997;205:716–20. doi: 10.1148/radiology.205.3.9393526. [DOI] [PubMed] [Google Scholar]
- 21.Miles KA, Young H, Chica SL, Esser PD. Quantitative contrast-enhanced computed tomography: is there a need for system calibration? Eur Radiol. 2007;17:919–26. doi: 10.1007/s00330-006-0424-x. [DOI] [PubMed] [Google Scholar]
- 22.Kondo H, Kanematsu M, Goshima S, et al. Abdominal multidetector CT in patients with varying body fat percentages: estimation of optimal contrast material dose. Radiology. 2008;249:872–7. doi: 10.1148/radiol.2492080033. [DOI] [PubMed] [Google Scholar]
- 23.Raptopoulos V, Karellas A, Bernstein J, Reale FR, Constantinou C, Zawacki JK. Value of dual-energy CT in differentiating focal fatty infiltration of the liver from low- density masses. Am J Roentgenol. 1991;157:721–5. doi: 10.2214/ajr.157.4.1892025. [DOI] [PubMed] [Google Scholar]
- 24.Li Y, Zhang R, Liang BL, Yuan JP, Ye RX, Zhong JL. Types of liver metastases on MR imaging and characteristics of uncommon types. Chin J Cancer. 2006;25:212–16. [PubMed] [Google Scholar]
- 25.Ng JK, Urbanski SJ, Mangat N, et al. Colorectal liver metastases contract centripetally with a response to chemotherapy: a histomorphologic study. Cancer. 2008;112:362–71. doi: 10.1002/cncr.23184. [DOI] [PubMed] [Google Scholar]
- 26.Scott J, Guthrie A, Arnold P, et al. Dual phase helical ct versus portal venous phase CT for the detection of colorectal liver metastases: Correlation with intra-operative sonography, surgical and pathological findings. Clin Radiol. 2001;56:235–42. doi: 10.1053/crad.2000.0668. [DOI] [PubMed] [Google Scholar]
- 27.Benoist S, Brouquet A, Penna C, et al. Complete response of colorectal liver metastases after chemotherapy: Does it mean cure? J Clin Oncol. 2006;24:3939–45. doi: 10.1200/JCO.2006.05.8727. [DOI] [PubMed] [Google Scholar]
- 28.Van Vledder MG, de Jong MC, Pawlik TM, Schulick RD, Diaz LA, Choti MA. Disappearing colorectal liver metastases after chemotherapy: should we be concerned? J Gastrointest Surg. 2010;14:1691–700/. doi: 10.1007/s11605-010-1348-y. [DOI] [PubMed] [Google Scholar]


