Abstract
Background
Commentaries on the adequacy of insurance coverage for prescription drugs available to Canadians have emphasized differences in the coverage provided by different provincial governments. Less is known about the actual financial burden of prescription drug spending and how this burden varies by province of residence, affluence and source of primary drug coverage.
Methods
We used data from a nationally representative household expenditure survey to analyze the financial burden of prescription drugs. We focused on the drug budget share (defined as the share of the household budget spent on prescription drugs), considering how it varied by province, total household budget and likely primary source of drug insurance coverage (i.e., provincial government plan for senior citizens, social assistance plan or private coverage). We examined both “typical” households (at the median of the distribution of the drug budget share) and households with relatively large shares (in the top 5%). Finally, we estimated the percentage of households with catastrophic drug expenditures (defined as a drug budget share of 10% or more) and the average catastrophic drug expenditures.
Results
Senior, social assistance and general population households accounted for 21.1%, 8.9% and 69.9% of the sample of 14 430 respondents to the 2006 Survey of Household Spending, respectively. The median drug budget share in Canada was 1.1% for senior households (range 0.4% [Ontario] to 3.6% [Saskatchewan]) and 0.1% for both social assistance households and general population households, with little appreciable variation across provinces for these latter 2 categories. The 95th percentile drug budget share in Canada was 7.4% for senior households (range 3.5% [Ontario] to 12.7% [Saskatchewan]), 5.4% for social assistance households (range 2.3% [British Columbia] to 13.0% [Prince Edward Island]) and 2.6% for general population households (range 2.1% [Ontario] to 5.4% [Prince Edward Island]). The interprovincial range of the 95th percentile drug budget share was 10.7 percentage points for social assistance households, 9.2 percentage points for senior households and 3.3 percentage points for general population households.
Interpretation
For most households, the financial burden of prescription drug expenditures appeared to be relatively small, with little interprovincial variation. However, a small number of households incurred catastrophic drug costs. These households were concentrated in the groups that traditionally benefit from provincial government drug plans. It is likely that some households did not purchase needed prescription drugs because of the expense, so our estimates of the financial burden of catastrophic prescription drug expenditures therefore represent a lower bound.
Proposals for a national, publicly financed drug plan continue to be debated in Canada. Proponents point to the large number of studies identifying differences in provincial government drug coverage available to individuals depending on province of residence, age, income and types of drugs needed. For instance, a recent contribution to this burgeoning literature identified a 63-fold interprovincial variation in what an elderly person would be expected to pay out of pocket (OOP) for a medication regimen of antihypertensive drugs.1 Other studies simulating OOP drug costs have focused on differences in coverage available to individuals with different ages and incomes,2-5 individuals with catastrophic drug expenditures6,7 and individuals who lack coverage for specific drugs, such as those used in cancer treatment.8-13
Simulation studies provide useful information about differences in the design of drug plans. However, they do not necessarily reflect what individuals actually pay OOP for prescription drugs. Yet information on the financial burden of prescription drugs is important for policy-making in this area. For several reasons, the reported simulation studies have not necessarily provided policy-relevant information on the actual financial burden posed by prescription drugs. First, simulation studies ignore the fact that beneficiaries of the provincial government plans may have other sources of drug coverage, including Veterans Affairs benefits and spousal coverage. Simulation studies also tend to focus on coverage of so-called “general benefit” drugs, which are reimbursed without restriction. Formulary restrictions imposed on the reimbursement of “limited-use” drugs—which tend to be newer and more costly—are typically not taken into account.
Second, the complexity of design of provincial drug plans can easily lead to errors that will materially affect the results of a simulation study. For example, O’Sullivan14 questioned the assertion of Demers and colleagues1 that a senior resident of New Brunswick with a household income of $45,000 is required to pay an annual premium of $60. O’Sullivan14 indicates that the monthly premium is $89. After correction of this error, OOP costs (depicted in Figure 2 of the study by Demers and colleagues) would increase from $60 to $1,068 (12 × $89). In addition, we note that the maximum OOP costs for Quebec seniors who receive 93% or less of their Guaranteed Income Supplement was $47.51 per month in 2006, not $73.42 as reported by Demers and colleagues. Correcting for both these errors substantively alters the distribution of the interprovincial variations reported by Demers and colleagues, conceivably changing their conclusions.
Third, simulation studies tend to ignore household-level resources in measurement of financial burden. However, welfare economics emphasizes that the household is the relevant decision-making unit, given that household members typically pool resources and make important expenditure decisions collectively.15 Fourth, simulation studies typically do not recognize that individuals adapt to the design of a drug plan in ways that lower their expenditures. For instance, individuals confronted with a fixed fee per prescription can economize by increasing the number of tablets per prescription. Finally, such studies simulate the OOP costs for several types of individuals (distinguished by age, types of drugs used and income) but fail to consider the OOP costs for the entire distribution of individuals.
One way to mitigate these limitations—and provide additional policy-relevant information—is to use nationally representative household-level survey data on household resources and expenditures on prescription drugs. In the study reported here, we used such data to estimate the share of the household budget allocated to prescription drugs and to assess how the drug budget share varied by province of residence and level of affluence for 3 different types of households differing in their primary source of coverage: senior citizens and recipients of social assistance (who are usually beneficiaries of the provincial government drug plan) and all others (who tend to rely on private plans). These survey data allowed us to gain new insights into the distribution of drug budget share. In particular, we focused on households at the median and at the 95th percentile of the distribution of drug budget share. We also estimated the proportion of households that spent 10% or more of their budget on prescription drugs.
Methods
Data sources
Data for this cross-sectional study were obtained from Statistics Canada’s 2006 Survey of Household Spending (SHS). The SHS surveyed a stratified, multistage sample of residential households in the 10 provinces, based on the sampling frame of the Canadian Labour Force Survey.
Face-to-face interviews with respondents were conducted between January and March 2007 to collect information about household expenditures (including prescription drug expenditures not reimbursed by drug insurance plans) and income for the calendar year 2006.16 Extensive efforts were made to ensure the quality of the responses.16 Respondents were asked to consult bills and receipts to confirm reported expenditure information, and household income was carefully reconciled with household expenditures and savings.16
Variables
We defined a household’s drug budget share as the ratio of the household’s out-of-pocket prescription drug expenditures to its total budget. Following the same method as Alan and colleagues,17 we defined the total household budget as its outlays on all goods and services, excluding expenditures on costly durables (cars, trucks and recreational vehicles). Because a household’s annual budget reflects the effects of saving and borrowing, it better reflects the household’s permanent income, including prior savings and anticipated future income, and is less variable than its current income.
We defined the likely source of primary drug coverage according to 3 household types: senior, social assistance and general population. We defined senior households as households for which the reference person was 65 years of age or older, where the reference person is defined as the household member most responsible for the household’s financial affairs, including paying rent and utility bills. We defined social assistance households as non-senior households in which 50% or more of the household income came from government transfers such as unemployment insurance and welfare benefits. The remaining households were defined as general population households (i.e., non-senior households in which the majority of income came from nongovernment sources).
The comprehensiveness of a household’s primary source of drug coverage varies by province. All provincial governments provide drug subsidies to senior citizens and social assistance recipients. General population households typically rely on private drug plans. In some cases in which a general population household lacks comprehensive drug coverage from other sources, the provincial government provides drug coverage. However, provincial coverage for general population households tends to be the least comprehensive, as provincial plans typically cover only those drug expenditures in excess of a deductible, which is determined by household size and income.
The drug budget share bears more than a simple mathematical relation to the size of the household’s budget. Although a direct mathematical relation does exist between the drug budget share and the size of the household’s budget (since drug budget share is defined as the ratio of the household’s out-of-pocket prescription drug expenditures to the total household budget), an indirect relationship between drug budget share and budget size is also likely, since the amount that a household chooses to spend on prescription drugs may be determined, in part, by the overall size of its budget. For example, relative to a household with a small total budget, a household with a large total budget may choose to spend more on prescription drugs because it can spend a smaller share of the budget on necessities such as housing, food and clothing without forgoing basic needs.
Statistical methods
We took 3 approaches to analyzing the data. First, we estimated the median and 95th percentile for household budget, out-of-pocket prescription drug expenditures and drug budget share, by province of residence and household type.
Second, for each combination of household type and province, we estimated the relation between the household’s drug budget share and its total budget. This allowed us to assess the interprovincial variation in the financial burden for drugs faced by households with similar levels of affluence. The relation between drug budget share and budget, known in economics as an Engle curve,17 is also of interest in its own right. The slope of the curve reflects how spending on prescription drugs not covered by a drug plan changes with household affluence and thus yields some insights into the distributional effects of current drug insurance arrangements.
We estimated the Engle curve for households at 2 specific points in the distribution of drug budget shares. In particular, we focused on households with the median (i.e., 50th percentile) drug budget share and the 95th percentile drug budget share. The median drug budget share is the point at which half of households face a lower burden and the other half face a higher burden. The 95th percentile drug budget share reflects the financial burden of households with a large drug budget share (such that only 5% of households face a higher burden) and tends to correspond to households without comprehensive drug coverage.
To estimate the Engle curve for the median and 95th percentile drug budget share, we used a nonparametric kernel conditional quantile estimator.18 This estimation approach has much to recommend it. Perhaps its greatest advantage, however, is that this approach does not require one to assume a particular algebraic form of the Engle curve, as one does for linear regression and other commonly used techniques.
We generated the Engle curves using the predicted values from the kernel conditional quantile estimator over an assumed household budget range of $0 to $60 000 ($0 to $100 000 for general population households). A simple way to interpret different points along an Engle curve is to recall that a 1% budget share represents $200 of a $20 000 household budget and $400 of a $40 000 household budget.
Finally, we examined households with catastrophic out-of-pocket drug expenditures, defined as a drug budget share equal to or greater than 10%. We tabulated the proportion of households with such catastrophic drug expenditures and calculated their average out-of-pocket drug expenditures.
To account for oversampling and undersampling of different geographic regions and demographic groups within the SHS, we used the survey sampling weights provided by Statistics Canada when generating population estimates.16
Results
The 2006 SHS had a response rate of 71.6%, and a sample size of 14 430 households. This sample is intended to be representative of 12.6 million Canadian community dwelling households. We classified 3048 households (21.1%) as senior households, 1291 (8.9%) as social assistance households and 10 091 (69.9%) as general population households.
Descriptive statistics
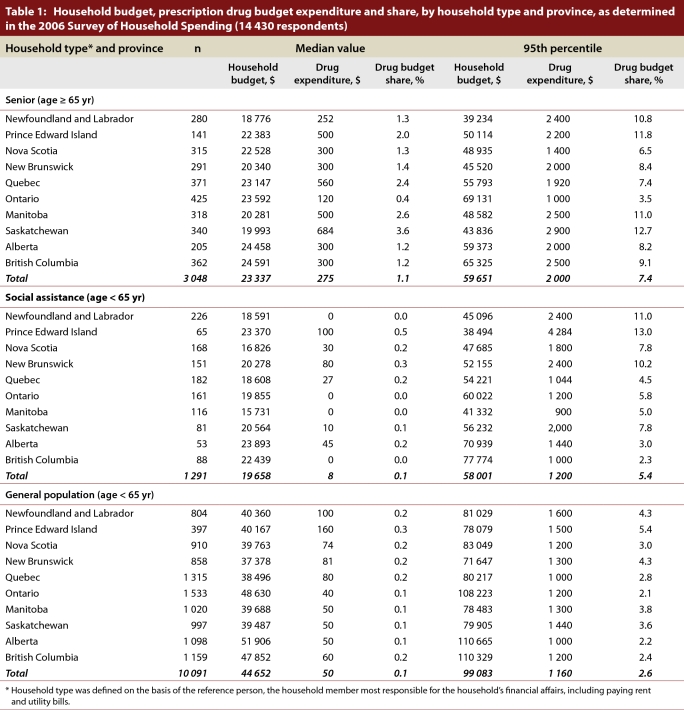
The median household budget in Canada for 2006 was $23 337 for senior households (range $18 776 [Newfoundland and Labrador] to $24 591 [British Columbia]), $19 658 for social assistance households (range $15 731 [Manitoba] to $23 893 [Alberta]) and $44 652 for general population households (range $37 378 [New Brunswick] to $51 906 [Alberta]) (Table 1). The median household out-of-pocket prescription drug expenditure in Canada was $275 for senior households (range $120 [Ontario] to $684 [Saskatchewan]), $8 for social assistance households (range $0 [Newfoundland and Labrador, Ontario, Manitoba, British Columbia] to $100 [Prince Edward Island]) and $50 for general population households (range $40 [Ontario] to $160 [Prince Edward Island]) (Table 1). The median drug budget share in Canada was 1.1% for senior households (range 0.4% [Ontario] to 3.6% [Saskatchewan]) and was considerably lower for social assistance households (0.1%) and general population households (0.1%), with little appreciable variation across provinces (Table 1).
Table 1.
Household budget, prescription drug budget expenditure and share, by household type and province, as determined in the 2006 Survey of Household Spending
The 95th percentile household budget in Canada was $59 651 for senior households (range $39 234 [Newfoundland and Labrador] to $69 131 [Ontario]), $58 001 for social assistance households (range $38 494 [Prince Edward Island] to $77 774 [British Columbia]) and $99 083 for general population households (range $71 647 [New Brunswick] to $110 665 [Alberta]) (Table 1). The 95th percentile household out-of-pocket prescription drug expenditure in Canada was $2000 for senior households (range $1000 [Ontario] to $2900 [Saskatchewan]), $1200 for social assistance households (range $900 [Manitoba] to $4284 [Prince Edward Island]) and $1160 for general population households (range $1000 [Alberta, Quebec] to $1600 [Newfoundland and Labrador]) (Table 1). The 95th percentile drug budget share in Canada was 7.4% for senior households (range 3.5% [Ontario] to 12.7% [Saskatchewan]), 5.4% for social assistance households (range 2.3% [British Columbia] to 13.0% [Prince Edward Island]) and 2.6% for general population households (range 2.1% [Ontario] to 5.4% [Prince Edward Island]) (Table 1). The interprovincial range for the 95th percentile drug budget share was 10.7 percentage points for social assistance households, 9.2 for senior households and 3.3 for general population households. These ranges were noticeably wider than the corresponding interprovincial ranges in median drug budget share for the 3 household types.
Engle curves
For the sake of clarity, we present the Engle curves for only the most populous provinces (Quebec, Ontario and British Columbia) and the province yielding the maximum value of drug budget share. For the sake of brevity, we have not presented the Engle curves at the median drug budget share for the social assistance and general population households, as there was little interprovincial variation in these categories, and the drug budget shares were small (< 0.5%).
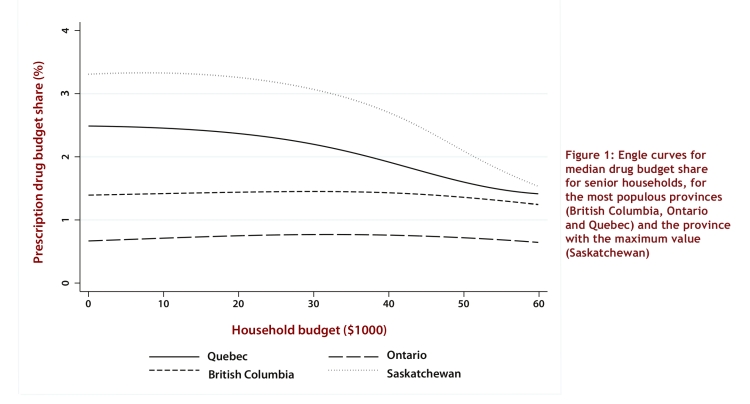
Among senior households with a budget of $10 000, the median drug budget share ranged from under 1% (Ontario) to over 3% (Saskatchewan) (Figure 1, showing Engle curves for Quebec, Ontario, Saskatchewan and British Columbia). As household budget increased, the Engle curves for Ontario and British Columbia remained fairly flat, whereas the Engle curves for Quebec and Saskatchewan sloped downward. At a household budget of $60 000, the interprovincial variation in drug budget share had decreased, and the values ranged from less than 1% (Ontario) to about 1.5% (Saskatchewan).
Figure 1.
Engle curves for median drug budget share for senior households, for the most populous provinces (British Columbia, Ontario and Quebec) and the province with the maximum value (Saskatchewan)
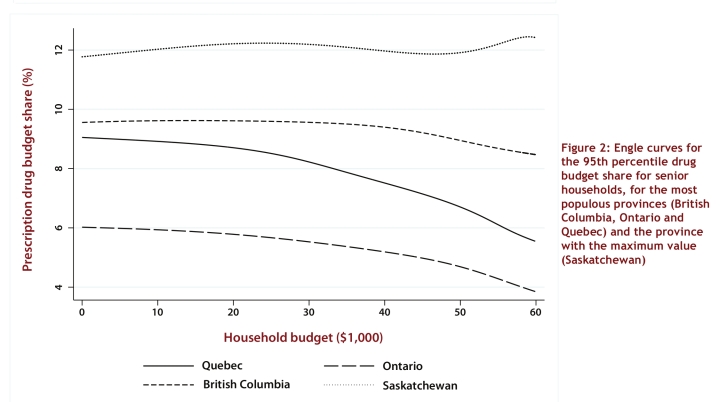
Among senior households with a budget of $10 000, the 95th percentile drug budget share ranged from 6% (Ontario) to more than 12% (Saskatchewan) (Figure 2, showing Engle curves for Quebec, Ontario, Saskatchewan and British Columbia). As household budget increased, the Engle curves for British Columbia, Quebec and Ontario decreased slightly, whereas the Engle curve for Saskatchewan remained fairly flat. At a household budget of $60 000, the interprovincial variation in drug budget share had increased, and the values ranged from 4% (British Columbia) to over 12% (Saskatchewan).
Figure 2.
Engle curves for the 95th percentile drug budget share for senior households, for the most populous provinces (British Columbia, Ontario and Quebec) and the province with the maximum value (Saskatchewan)
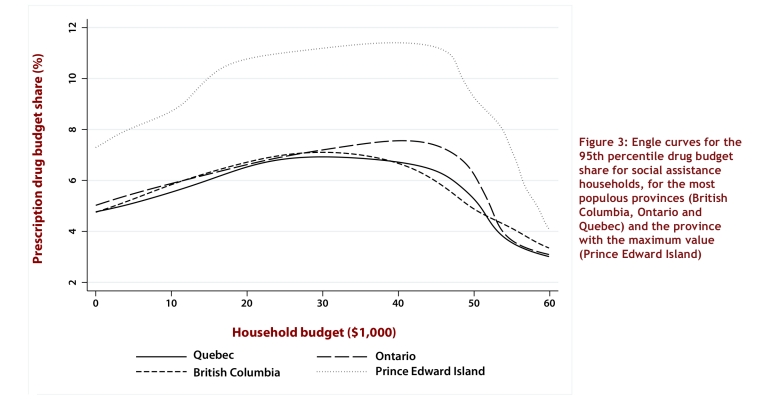
Among social assistance households with a budget of $10 000, the 95th percentile drug budget share ranged from just under 6% (Quebec) to about 9% (Prince Edward Island) (Figure 3, showing Engle curves for Prince Edward Island, Quebec, Ontario and British Columbia). The Engle curves for all provinces tended to increase with household budget up to $40 000, after which the curves tended to decrease again. At a household budget of $60 000, the interprovincial variation in drug budget share had declined, and the values ranged from 3% (Ontario, Quebec) to 4% (Prince Edward Island).
Figure 3.
Engle curves for the 95th percentile drug budget share for social assistance households, for the most populous provinces (British Columbia, Ontario and Quebec) and the province with the maximum value (Prince Edward Island)
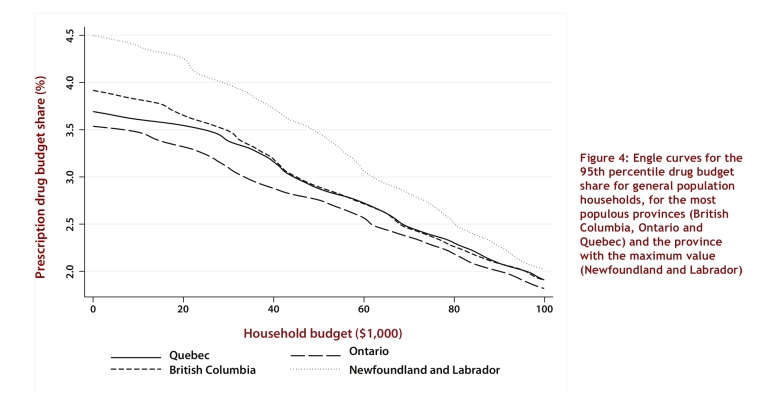
Among general population households with a budget of $10 000, the 95th percentile drug budget share ranged from about 3.5% (Ontario) to about 4.5% (Newfoundland and Labrador) (Figure 4, showing curves for Newfoundland and Labrador, Quebec, Ontario and British Columbia). The Engle curves for all provinces decreased as household budget increased. At a household budget of $60 000, the interprovincial variation in drug budget share had declined, and the values ranged from about 2.5% (Ontario) to 3% (Newfoundland and Labrador). At a household budget of $100 000, the interprovincial variation in drug budget share had declined even further.
Figure 4.
Engle curves for the 95th percentile drug budget share for general population households, for the most populous provinces (British Columbia, Ontario and Quebec) and the province with the maximum value (Newfoundland and Labrador)
Catastrophic drug expenditures
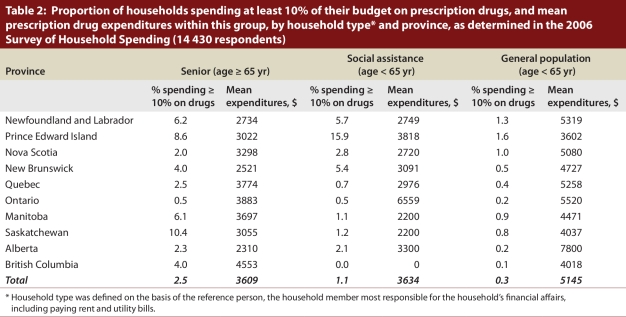
There was marked interprovincial variation in the fraction of senior and social assistance households that incurred catastrophic drug expenses (i.e., at least 10% of the household budget on out-of-pocket prescription drug expenses) (Table 2).
Table 2.
Proportion of households spending at least 10% of their budget on prescription drugs, and mean prescription drug expenditures within this group, by household type and province, as determined in the 2006 Survey of Household Spending
The proportion of senior households with catastrophic drug expenditures was 2.5% for all of Canada (range 0.5% [Ontario] to 10.4% [Saskatchewan]), with mean out-of-pocket catastrophic drug expenditures of $3609 (range $2310 [Alberta] to $4553 [British Columbia]). In most provinces, less than 3% of social assistance households had catastrophic drug expenses. Overall, the proportion of social assistance households with catastrophic drug expenditures was 1.1% (range 0% [British Columbia] to 15.9% [Prince Edward Island]), with mean out-of-pocket catastrophic drug expenditures of $3634 (range $0 [British Columbia] to $6559 [Ontario]). Finally, the proportion of general population households with catastrophic drug expenditures was 0.3% for all of Canada (range 0.1% [British Columbia] to 1.6% [Prince Edward Island]), and the mean out-of-pocket catastrophic drug expenditures for these households was $5145 for all of Canada (range $3602 [Prince Edward Island] to $7800 [Alberta]).
Interpretation
In this study, we found that the financial burden of out-of-pocket prescription drug expenditures for the typical household was relatively small, with little interprovincial variation. The maximum median drug budget share was 3.6% (for senior households in Saskatchewan). Similarly, general population households experiencing a large financial burden had a maximum drug budget share of 5.4% (Prince Edward Island). In short, coverage for prescription drugs appeared to be adequate for the majority of Canadian households, although recent simulation studies have suggested that the opposite is true.
Nonetheless, some Canadian households were purchasing expensive pharmaceutical therapies without the benefit of comprehensive drug insurance. Somewhat surprisingly, such households were concentrated in the groups that traditionally benefit from provincial government drug plans. In particular, 2.5% of senior households and 1.1% of social assistance households in Canada faced catastrophic drug expenditure in 2006, whereas only 0.3% of general population households faced catastrophic expenses. Like previously reported simulation studies, we found substantial interprovincial variation in the prevalence of catastrophic costs among senior and social assistance households. Because of the small number of households in the SHS that incurred catastrophic drug expenses, these estimates should be interpreted with caution. However, the estimates do reflect differences in provincial drug plan coverage and hence appear plausible. In particular, rates of catastrophic drug expenditures for senior households were higher in provinces with less generous coverage. For instance, less than 1% of senior households in Ontario (a province with generous coverage for seniors) incurred catastrophic costs, whereas over 10% of senior households in Saskatchewan (where coverage in 2006 was less generous for senior citizens) incurred catastrophic costs. Notably, Saskatchewan has recently increased drug coverage for seniors, as described by the National Prescription Drug Utilization Information System. In the general population, catastrophic costs were concentrated among less affluent households. This finding could be of practical importance to policy-makers if they consider targeting the benefits of a national pharmacare program at households that incur a large financial burden for out-of-pocket prescription drug expenditures.
It is unclear how a household’s total budget (i.e., affluence) affects its drug budget share. If drug purchase decisions do not depend on affluence, then it follows mathematically that the drug budget share will decline as the total budget increases. However, more affluent households are more likely than less affluent households to be able to afford drugs not covered by insurance. Such uninsured drugs might include drugs used in fertility treatments and biologic drugs used in cancer treatment, as well as various lifestyle drugs, such as those used to treat hair loss or erectile dysfunction. Hence, it is possible the drug budget share may actually increase with total budget. In addition to considerations of affordability, the relation between drug budget share and household budget reflects the effect of affluence on the incidence of disease and, for people with a diagnosed disease, the awareness of households of various therapeutic options.
Although the use of representative national survey data provides a reasonable picture of the financial burden faced by households, this study had a few important limitations. First, our classification of households as senior, social assistance or general population households did not completely control for all types of insurance coverage that each household might have. This limitation might have biased our results, as out-of-pocket prescription drug expenditures would be lower for households with multiple types of insurance coverage. Second, although we controlled for broad types of households (i.e., senior, social assistance and general population households), we cannot control for the exact age or health status of all household members. This limitation might have biased our results because we could not control for potential factors related to increased consumption of prescription drugs. However, such potential bias is likely of little concern, as we focused primarily on interprovincial variation in the financial burden of prescription drugs, and age and health status were presumably not meaningfully different across the 10 provinces. Finally, the drug expenditure data did not reflect “unmet needs.” That is, some prescription drugs are simply unaffordable for some households and hence are not purchased. Indeed, three-quarters of newer cancer drugs taken at home cost over $20 000 annually.19 Our estimates of the financial burden of catastrophic prescription drug expenditures therefore represent a lower bound.
We concur with the First Ministers of Health that some policy intervention is needed to improve the welfare of households who face high drug costs without comprehensive coverage.20
Biographies
Logan McLeod, PhD, is assistant professor at the School of Public Health, University of Alberta, Edmonton, Alberta, Canada.
Basil G Bereza, MSc, CFA, was a graduate student at the Graduate Faculty of Pharmaceutical Sciences, University of Toronto at the time of the study and is currently a health economist with a privately held consulting company.
Minsup Shim, PhD, is a Research Associate at the Leslie Dan Faculty of Pharmacy, University of Toronto, Toronto.
Paul Grootendorst, PhD, is associate professor at the Leslie Dan Faculty of Pharmacy, University of Toronto, Toronto.
Footnotes
Competing interests: None declared.
Contributors: All of the authors contributed substantially to the interpretation of the data, reviewed multiple drafts, revised article critically for important intellectual content, and approved the final version. Minsup Shim acquired the data and Logan McLeod conducted the statistical analysis. Paul Grootendorst and Logan McLeod wrote the protocol and the first draft of the manuscript. Logan McLeod acts as guarantor.
Funding source: Support for this study was provided by the research initiative into the Social and Economic Dimensions of an Aging Population (SEDAP). SEDAP is a multidisciplinary research program funded primarily by SSHRC and centered at McMaster University.
References
- 1.Demers Virginie, Melo Magda, Jackevicius Cynthia, Cox Jafna, Kalavrouziotis Dimitri, Rinfret Stéphane, Humphries Karin H, Johansen Helen, Tu Jack V, Pilote Louise. Comparison of provincial prescription drug plans and the impact on patients' annual drug expenditures. CMAJ. 2008 Feb 12;178(4):405–409. doi: 10.1503/cmaj.070587. http://www.ncbi.nlm.nih.gov/pmc/articles/pmid/18268266. [DOI] [PMC free article] [PubMed] [Google Scholar]
- 2.Grootendorst Paul. Beneficiary cost sharing under Canadian provincial prescription drug benefit programs: history and assessment. Can J Clin Pharmacol. 2002;9(2):79–99. [PubMed] [Google Scholar]
- 3.Grootendorst P, Palfrey D, Willison D, Hurley J. A review of the comprehensiveness of provincial drug coverage for Canadian seniors. Can J Aging. 2003;22:33–44. [Google Scholar]
- 4.Ungar Wendy J, Witkos Maciej. Public drug plan coverage for children across Canada: a portrait of too many colours. Healthc Policy. 2005;1(1):100–122. http://www.ncbi.nlm.nih.gov/pmc/articles/pmid/19308106. [PMC free article] [PubMed] [Google Scholar]
- 5.Kapur Vishnu, Basu Kisalaya. Drug coverage in Canada: who is at risk? Health Policy. 2005;71(2):181–193. doi: 10.1016/j.healthpol.2004.08.006. [DOI] [PubMed] [Google Scholar]
- 6.Drug expenses coverage in the Canadian population: protection from severe drug expenses. Toronto: Fraser Group/Tristat Resources; 2002. [accessed 2010 Mar 2]. http://www.frasergroup.com/downloads/severe_drug_e.pdf. [Google Scholar]
- 7.Coombes M E, Morgan S G, Barer M L, Pagliccia N. Who’s the fairest of them all? Which provincial pharmacare model would best protect Canadians against catastrophic drug costs? Healthc Q. 2004;7(4 Suppl):13. doi: 10.12927/hcq.2004.17236. [DOI] [PubMed] [Google Scholar]
- 8.Menon Devidas, Stafinski Tania, Stuart Gavin. Access to drugs for cancer: Does where you live matter? Can J Public Health. 2005;96(6):454–458. doi: 10.1007/BF03405189. [DOI] [PMC free article] [PubMed] [Google Scholar]
- 9.Anis Aslam H, Guh Daphne, Wang Xiao-hua. A dog's breakfast: prescription drug coverage varies widely across Canada. Med Care. 2001;39(4):315–326. doi: 10.1097/00005650-200104000-00003. [DOI] [PubMed] [Google Scholar]
- 10.Grégoire J P, MacNeil P, Skilton K, Moisan J, Menon D, Jacobs P, McKenzie E, Ferguson B. Interprovincial variation in government drug formularies. Can J Public Health. 2001;92(4):307–312. doi: 10.1007/BF03404967. [DOI] [PMC free article] [PubMed] [Google Scholar]
- 11.MacDonald K, Potvin K. Interprovincial variation in access to publicly funded pharmaceuticals: a review based on the WHO anatomical therapeutic chemical classification system. Can Pharm J. 2004;137(7):29–34. [Google Scholar]
- 12.Morgan Steve, Hanley Gillian, Raymond Colette, Blais Régis. Breadth, depth and agreement among provincial formularies in Canada. Healthc Policy. 2009;4(4):e162–e184. http://www.ncbi.nlm.nih.gov/pmc/articles/pmid/20436800. [PMC free article] [PubMed] [Google Scholar]
- 13.Canadian Institute of Health Information. How common are the provincial/territorial public drug formularies? National Prescription Drug Utilization Information System (NPDUIS) Formulary Bulletin. 2005:1–13. [Google Scholar]
- 14.O'Sullivan JF. Premium free in New Brunswick? CMAJ. 2008. Feb 12, [accessed 2010 May 13]. http://www.cmaj.ca/cgi/eletters/178/4/405#18695.
- 15.Boadway R F, Bruce N. Welfare economics. New York: Basil Blackwell Inc; 1984. [Google Scholar]
- 16.User guide for the public-use microdata file—Survey of Household Spending, 2006. Ottawa: Statistics Canada; 2008. Cat. no. 62M0004XCB. [Google Scholar]
- 17.Alan S, Crossley T F, Grootendorst P, Veall M R. Distributional effects of ‘general population’ prescription drug programs in Canada. Can J Econ. 2005;38:128–148. [Google Scholar]
- 18.Li Q, Racine J S. Nonparametric estimation of conditional CDF and quantile functions with mixed categorical and continuous data. J Bus Econ Stat. 2008;26:423–434. [Google Scholar]
- 19.Cancer drug access for Canadians [Internet] Toronto: Canadian Cancer Society; 2002. [accessed 2010 May 13]. http://www.cancer.ca/canada-wide/about%20us/media%20centre/cw-media%20releases/cw-2009/~/media/CCS/Canada%20wide/Files%20List/English%20files%20heading/pdf%20not%20in%20publications%20section/CANCER%20DRUG%20ACCESS%20FINAL%20-%20English.ashx. [Google Scholar]
- 20.Federal/Provincial/Territorial Ministerial Task Force on the National Pharmaceuticals Strategy. National pharmaceuticals strategy progress report. [accessed 2010 June 16]. http://www.hc-sc.gc.ca/hcs-sss/alt_formats/hpb-dgps/pdf/pubs/2006-nps-snpp/2006-nps-snpp_e.pdf. [Google Scholar]


