Abstract
Caveolae, a class of cholesterol-rich lipid rafts, are smooth invaginations of the plasma membrane whose formation in nonmuscle cells requires caveolin-1 (Cav1). The recent demonstration that Cav1-associated cavin proteins, in particular PTRF/cavin-1, are also required for caveolae formation supports a functional role for Cav1 independently of caveolae. In tumor cells deficient for Golgi β-1,6N-acetylglucosaminyltransferase V (Mgat5), reduced Cav1 expression is associated not with caveolae but with oligomerized Cav1 domains, or scaffolds, that functionally regulate receptor signaling and raft-dependent endocytosis. Using subdiffraction-limit microscopy, we show that Cav1 scaffolds are homogenous subdiffraction-limit sized structures whose size distribution differs from that of Cav1 in caveolae expressing cells. These cell lines displaying differing Cav1/caveolae phenotypes are effective tools for probing the structure and composition of caveolae. Using stable isotope labeling by amino acids in cell culture, we are able to quantitatively distinguish the composition of caveolae from the background of detergent-resistant membrane proteins and show that the presence of caveolae enriches the protein composition of detergent-resistant membrane, including the recruitment of multiple heterotrimeric G-protein subunits. These data were further supported by analysis of immuno-isolated Cav1 domains and of methyl-β-cyclodextrin-disrupted detergent-resistant membrane. Our data show that loss of caveolae results in a dramatic change to the membrane raft proteome and that this change is independent of Cav1 expression. The proteomics data, in combination with subdiffraction-limit microscopy, indicates that noncaveolar Cav1 domains, or scaffolds are structurally and functionally distinct from caveolae and differentially impact on the molecular composition of lipid rafts.
Plasmalemmal proteins and lipids can segregate into different subdomains, forming tightly packed, lipid-ordered phases enriched in specific subsets of proteins. Collectively known as lipid rafts, these structures can be biochemically enriched in a low-density detergent-resistant membrane (DRM)1 fraction (1). This compartmentalization helps to coordinate various activities of raft-associated proteins (2, 3), making the domains a subject of great interest for cell biologists (4) and proteomics scientists alike (5). Formation of caveolae, a subtype of rafts characterized by morphologically distinctive invaginations of the plasma membrane depends on the presence of the protein caveolin-1 (Cav1) (6). Recent comparative proteomic analyses of DRMs from wild-type and Cav1−/− fibroblasts identified PTRF (Polymerase I and transcript release factor) or cavin-1 as a crucial regulator of caveolae formation (7). Other cavin family proteins were subsequently identified with varying roles regulating caveolae formation, dynamics and size (8–11). The requirement for proteins other than Cav1 in caveolae formation argues that Cav1 functions outside of caveolae (6, 14, 15).
Despite these successes, it remains difficult to study the composition of caveolae because of a lack of effective tools; DRM preparations contain not just caveolae but other types of raft domains and many other contaminants, particularly from mitochondria (12, 13). Likewise, detergent-free methods of enriching caveolae are at least as fraught with complications (1). However, combining biochemical methods with genetic manipulation of relevant proteins can be an effective approach to probe the composition of these structures. The Golgi enzyme β-1,6-N-acetylglucosaminyltransferase V (Mgat5) modifies N-glycans, generating high affinity ligands for galectins that then lead to the genesis of another membrane domain, the galectin lattice (16). Mgat5-deficiency reduces mammary tumor growth and metastasis formation but Cav1 expression was inversely proportional to tumor size in Mgat5−/− mice, suggesting that Cav1 expression impacts on tumor growth only in the absence of Mgat5 and the galectin lattice (17, 18). These observations led to the development and characterization of three cell lines: 1) Mgat5+/+ mammary carcinoma cells derived from wild-type tumors that express Cav1 and caveolae; 2) Mgat5−/− cells from small tumors that express Cav1 but no detectable caveolae; 3) Mgat5−/−ESC cells from large tumors that express minimal Cav1 protein and that have escaped (ESC) the growth limitations imposed by the lack of Mgat5 (18). Further characterization revealed that noncaveolar Cav1 in Mgat5−/− cells form high molecular weight oligomers and inhibit Epidermal Growth Factor Receptor (EGFR) signaling and endocytosis, as well as dynamics of the GM1-ganglioside binding raft marker cholera toxin b-subunit (CT-b) (18, 19). Intriguingly, whereas Cav1 inhibits EGFR signaling, EGFR is not associated with caveolae in the absence of ligand (20), suggesting that Cav1 scaffolds may represent a Cav1 regulatory domain (19).
Collectively, these observations suggest a model where caveolae, Cav1 scaffolds, and Cav1-free raft domains represent functionally distinct subtypes of lipid rafts whose expression may explain many of the discordant reports of Cav1 regulation of cellular signaling. However, apart from a few marker proteins, e.g. Cav1 and PTRF, the protein composition of caveolae and Cav1 scaffolds remains uncertain. Here we use super-resolution microscopy to show that Cav1 scaffolds represent homogenous, subdiffraction limit domains whose size and distribution differ from that of caveolae. We also analyzed the DRM proteome of cells containing Cav1/caveolae (Mgat5+/+), Cav1 scaffolds only (Mgat5−/−), or no Cav1 or caveolae (Mgat5−/−ESC) and compared the data with that of DRMs from wild-type and Cav1−/− MEFs (mouse embryonic fibroblasts). Our results show that expression of Cav1 scaffolds but not caveolae significantly depletes proteins, including signaling G proteins, from the raft proteome suggesting that caveolae and Cav1 scaffold expression differentially impacts on the protein composition and signaling potential of lipid raft domains.
EXPERIMENTAL PROCEDURES
Materials and Cell Lines
The following materials were obtained from the indicated commercial sources: Dulbecco's Modified Eagle's Medium (DMEM), l-glutamine, penicillin and streptomycin, BCA assay kit and cell culture trypsin (ThermoFisher, Nepean, Ontario, Canada); Fetal bovine serum, both qualified and dialyzed forms, Alexa-488 coupled secondary antibody, ProGold and Lipofectamine 2000 (Invitrogen, Burlington, Ontario, Canada); l-Lys- and l-Arg-deficient DMEM (Caisson Labs, North Ogden, UT); l-Lys, l-Arg, methyl-β-cyclodextrin (MβCD), isoproterenol, Triton X-100 (Tx-100), sodium deoxycholate (SDC), dithiothreitol, iodoacetamide, lactose, sucrose and Alexa-546 coupled-CT-b (Sigma-Aldrich, St.Louis, MO); 2H4-lysine, 13C6-arginine, 13C615N2-lysine, and 13C615N4-arginine (Cambridge Isotope Laboratories, Cambridge, MA); Sequencing grade modified porcine trypsin (Promega, Madison, WI); Protease inhibitor mixture tablets with EDTA (Roche Diagnostics, Mannheim, Germany); Coomassie Plus kit (Pierce, Nepean, Ontario, Canada); Protein A Sepharose beads (Amersham Biosciences, Sweden); Mouse protein nonspecific IgG (Biomeda, Foster city, CA). Antibodies used and their sources were as follows α-PTRF (BD Transduction, San Jose, CA); α-actin, α-caveolin-1 (Santa Cruz Technology, Santa Cruz, CA). The Mgat5+/+, Mgat5−/−, Mgat5−/−ESC cell lines were cultured as previously described (18).
Cell Culture and SILAC
Both duplex and triplex stable Isotope Labeling by Amino acids in Cell culture (SILAC) labeling was conducted as described previously (13). Before labeling, all Mgat5 cells were maintained in DMEM supplemented with 10% fetal bovine serum (v/v), 1% l-Gln (v/v), and 1% penicillin/streptomycin (v/v) at 5% CO2 and 37 °C then transferred to SILAC medium with dialyzed fetal bovine serum plus Lys and Arg isotopologs; cell populations were amplified 200-fold in the labeling media to achieve complete labeling. Here we refer to the different labels as “0/0” for the normal isotopic abundance Lys and Arg, “4/6” for 2H4-Lys and 13C6-Arg, and “8/10” for 13C615N2-Lys and 13C615N4-Arg. For each analysis, six 15-cm plates of Mgat5 cells were used per condition for detergent-resistant membrane extractions, quantitative co-immunoprecipitations and MβCD treatment experiments. For the MβCD treatment experiment, all 0/0 and 4/6 labeled Mgat5+/+ cells were serum starved for 5 h to deplete free cholesterol before MβCD treatment and DRM extraction. 0/0 cells were treated with 5 mm MβCD for 1 h at 37 °C with 4/6 untouched. WT and Cav1−/− MEFs were maintained in normal DMEM medium as ‘label-free’ samples (7). Two 15 cm plates of MEF cells were used per each cell type for detergent-resistant membrane extraction prepared in parallel.
DRM Preparation
DRMs were extracted from normal or treated SILAC cells as described previously (12, 13). Very briefly, cells were solubilized in lysis buffer (1% Triton X-100, 25 mm 2-(N-morpholino) ethanesulfonate (MES), pH 6.5, Protease Inhibitor Mixture). Relative protein concentrations of cell lysates were determined using Coomassie Plus and equal masses of protein from each SILAC condition were mixed together. From this step, lysates are combined into one sample and adjusted to 45% sucrose by addition of an equal volume of 90% sucrose (in 25 mm MES, 150 mm NaCl, pH 6.5 (MES-buffered saline or MBS)). This is then layered in the bottom of an ultracentrifuge tube, followed by successive layers of 35 and 5% sucrose. These gradients were then centrifuged for 18 h at 166,000 relative centrifugal force (r.c.f.) and the white, light-scattering band appearing between 35 and 5% sucrose is extracted using a needle to puncture the side of the tube and a syringe to draw out the desired layer. This extracted layer is then diluted out ∼threefold with MBS and membranes are pelleted by centrifugation at 166,000 r.c.f. for 2 h. Each plate would typically yield between 10 to 20 μg of DRM protein. All steps above were carried out at 4 °C.
Quantitative Co-immunoprecipitation
Caveolae were precipitated from both detergent and detergent-free extracts of Mgat5+/+ cells. In the detergent method, 0/0 and 4/6 Mgat5+/+ cells were lysed in Tx-100 for 1 h; 4, 8, or 20 μg of Caveolin-1 antibody or protein nonspecific IgG were added to 4/6 and 0/0 lysate respectively. After adding Protein A Sepharose beads, both the lysates were rotated for 2 h at 4 °C, after which the beads were pelleted at 600 r.c.f. for 10 min and, washed three times with ice-cold phosphate-buffered saline buffer. Finally, the beads were solubilized in 100 μl 1% SDC in 50 mm Tris (pH 8.0), heated for 10 min 99 °C with mixing at 1400 rpm; the protein concentration of both the supernatants were measured by BCA assay and combined at a 1:1 protein ratio. In the detergent-free method, cells were scraped in homogenization buffer (250 mm sucrose, 10 mm Tris-HCl, and 0.1 mm EGTA, pH 7.4) with Protease Inhibitor Mixture added fresh, and then lysed by passage through a 25-G needle syringe until >95% of the cells were broken by examining under microscope. All nuclear and cell debris were pelleted at 16,000 r.c.f. for 10 min, and then Tx-100 was added to the supernatant to extract DRMs and allowed to incubate for 1 h. The remainder of the detergent-free procedure was the same as the detergent method except 10 μg of Caveolin-1 ab and IgG were used.
Western Blotting
Ten micrograms of whole cell lysate from Mgat5+/+, Mgat5−/−, and Mgat5−/−ESC were combined with SDS sample buffer, separated by 12% SDS-PAGE, transferred to polyvinylidene difluoride membrane and blocked with 5% milk powder. Primary antibodies were used as follows: α-caveolin-1 diluted 1 in 200 for 1 h; α-PTRF, 1/100 for 1 h and α-actin, 1/100 for 1 h. Horseradish peroxidase conjugated anti-mouse secondary was used at 1/4000 and signal detected with SuperSignalWest PicoChemiluminescent detection system.
Transfection and Immunofluorescence
Mgat5+/+, Mgat5−/−, and Mgat5−/−ESC cells were plated and 24 h later transfected with Gαs-GFP(10) using Lipofectamine 2000. Twenty-four hours after transfection, cells were incubated with or without Alexa-546 coupled-CT-b (1/400) for 20 min at 4 °C and fixed with methanol/acetone (50%/50% v/v) at −20 °C. For the isoproterenol experiments, one hour before treatment, complete media was replaced with serum-free DMEM. Gαs-GFP transfected cells were then incubated with or without Alexa-546 coupled-CT-b as described above. Next, the cells were washed with warm phosphate-buffered saline and incubated with 10 μm isoproterenol for 15 min at 37 °C. The cells were then fixed for 20 min with 4% paraformaldehyde (PFA) at room temperature, and permeabilized with 0.2% Tx-100. In both cases, preparations were extensively washed with phosphate-buffered saline containing 100 μm Ca2+ and 100 mm Mg2+, blocked with 1% bovine serum albumin and then the cover slides were incubated sequentially with the primary and secondary antibodies. Cover slides were mounted in Gelvatol for confocal analysis and images acquired using an Olympus Fluoview 1000 confocal microscope. Pearson's coefficients were calculated from individual cells (11–19 cells) using ImagePro Plus and ImageJ software.
For the stimulated emission depletion microscopy (STED) microscopy, Mgat5 cells were fixed in 3% paraformaldehyde, permeabilized with 0.2% Triton X-100 and blocked with 1% bovine serum albumin before incubation with anti-Cav1. Cells were then incubated with Alexa488 α-rabbit secondary antibody and then mounted in ProGold for confocal STED analysis. Images were acquired using a Leica SP5 STED CW microscope (courtesy of Vladimir Zhukarev, Leica). Signal dynamic range was adjusted for each STED and confocal image acquisition (gain ∼800 V for confocal images and ∼1000 V for STED images) and images processed using a median filter radius of 3 and application of a 30–255 intensity threshold to 8-bit images. Area of Cav1-positive structures was measured with ImageJ software, and the averages of individual cells pooled to obtain the mean of all cells from independent experiments. Statistical analysis was performed on GraphPad Prism software: to determine p values unpaired T tests were performed between two different conditions using 95% confidence intervals.
LC-MS/MS, Database Searching and Data Analysis
All analyses here involved in solution digestions in 1% SDC (50 mm Tris, pH 8) with protein pellets or bead-bound protein in the pull-down experiments being solubilized directly in SDC and then subjected to trypsin digestion. Protein solutions were reduced (1 μg dithiotreitol/50 μg protein), alkylated (5 μg iodoacetamide/50 μg protein) and digested (1 μg trypsin/50 μg protein) as described (22). For each sample, 5 μg (measured by BCA method) of digested peptides were analyzed by liquid chromatography-tandem mass spectrometry (LC-MS/MS) on a LTQ-OrbitrapXL (ThermoFisher, Bremen, Germany). The LTQ-OrbitrapXL was on-line coupled to Agilent 1100 Series nanoflow HPLC instruments using a nanospray ionization source (Proxeon Biosystems) holding columns packed into 15-cm-long, 75-μm-inner diameter fused silica emitters (8-μm-diameter opening, pulled on a P-2000 laser puller from Sutter Instruments) using 3-μm-diameter ReproSil Pur C18 beads. Buffer A consisted of 0.5% acetic acid, and buffer B consisted of 0.5% acetic acid and 80% acetonitrile. Gradients were run from 6% B to 30% B over 60 min, then 30% B to 80% B in the next 10 min, held at 80% B for 5 min, and then dropped to 6% B for another 15 min to recondition the column. The LTQ-OrbitrapXL was set to acquire a full-range scan at 60,000 resolution from 350 to 1500 Th in the Orbitrap and to simultaneously fragment the top five peptide ions in each cycle in the LTQ. In all experiments, digested peptides were also further fractionated by strong cation exchange chromatography into five fractions using 0, 20, 50, 100, and 500 mm of NH4CH3COO or 10 fractions using 0, 10, 20, 50, 75, 100, 150, 200, 350, and 500 mm of NH4CH3COO as described (22) and analyzed as above on an LTQ-OrbitrapXL.
Protein identification and quantification were done using Proteome Discover (v.1.2, ThermoFisher, Bremen, Germany) and Mascot (version 2.3, Matrix Science) to search against the International Protein Index (IPI) Mouse (version 3.69, 110,771 sequences—common serum contaminants and human keratins added and all reversed sequences were concatenated) database with the following criteria: electrospray ionization-ion trap fragmentation characteristics, tryptic specificity with up to one missed cleavages; ±10 parts-per-million and ±0.6 Da accuracy for MS and MS/MS measurements respectively; cysteine carbamidomethylation as a fixed modification; N-terminal protein acetylation, methionine oxidation, deamidation (NQ), duplex (2H4-Lys, 13C6-Arg) or triplex (13C615N2-Lys and 13C615N4-Arg) SILAC modifications as appropriate; peptide false discovery rate was set at 1%. Quantitation was done using a mass precision of 2 ppm (three times the mass precision is used to create extracted ion chromatograms). After extracting each ion chromatogram, Proteome Discoverer runs several filters to check for, among other things, interfering peaks and the expected isotope pattern, and peptides that do not meet all the criteria are not used in calculating the final ratio for each protein. The ratios presented in the various tables are the raw measured ratios, with the exception of the Mgat5−/− versus Mgat5−/−ESC comparison, where the ratios were standardized around a mean of 1.0. We consider proteins identified if at least two peptides were observed. Analytical variability of SILAC data in the types of experiments performed here is typically <30% on average and biological variability was addressed in these experiments by performing at least three independent replicates of each experiment.
Label-free quantitation was performed using Mass Profiler Professional and MassHunter (Agilent) software based on area-under-the-curve method (supplemental Fig. S1). In this procedure, at least four biological replicates of DRMs (4 μg each) from WT and Cav1−/− MEFs were analyzed by LC-MS (i.e. only MS1 spectra acquired) using 160 nl (75 mm * 150 μm) high capacity C18 reverse phase HPLC-chip with 55 min gradient from 0 to 45% acetonitrile on a 1200 Series nano HPLC and Chip-Cube Q-TOF 6510 (Agilent Technologies) with Vcap set at 1850 V and the fragmentor voltage set at 175 V. MassHunter Qualitative Analysis software was used to extract the 1000 most abundant molecular features between 100 and 3200 Th, defined by precursor ion m/z, retention time (RT) and intensity. Statistical analysis of the extracted molecular features was performed using Mass Profiler Professional (Agilent) to generate MS/MS target lists with features significantly up-regulated in either WT or Cav1−/− DRM. The following settings were used in generating the inclusion list: minimum absolute abundance = 1000 counts, minimum # of ions = 2, 2+ or greater charge state required; compound alignment: RT window 0.1% + 0.15 min, mass window 5.0 ppm + 2.0 mDa; flag filter at least four out of eight samples have acceptable value; frequency filter retain entities that appear in at least 100% of samples in at least one condition; p value cut off 0.001, fold-change cut-off of 100; features that only present in one of the two cell types were selected. Inclusion list exportation settings: RT window ±0% + 0.1 min, number of precursor ions per compound limited to 1, minimum ion abundance 1000 counts, export monoisotopic m/z, prefer highest abundance charge state(s). The inclusion lists were imported into MassHunter and the target sample (MEF WT or Cav1−/− DRM) were subjected to targeted MS/MS in which the instrument selects the included m/z at a specific retention time window for MS/MS. This method obviously relies on highly reproducible chromatography so we examined the reproducibility of our Chip-LC-MS system using repeated injections of PC3 DRM samples. Total ion chromatograms (TICs), base peak chromatograms, peptide and protein identifications are all highly reproducible, with the large majority of proteins and peptides identified in all replicates (supplemental Fig. S2). Mass spectra extraction, database searching and quantitative ratios were performed using Spectrum Mill software (Agilent, A03.03) against NCBInr Mouse database (83233 Sequences). Cysteine carbamidomethylation was used as a fixed/mix modification. Other parameters include up to two missed cleavages for trypsin; ±20 ppm and ±50 ppm accuracy for MS and MS/MS measurements respectively. Positive identification required a protein score > 11, peptides with score > 10 and % SPI (Scored Peak Intensity) > 60.
RESULTS
Cav1 Scaffold Domains by STED Microscopy
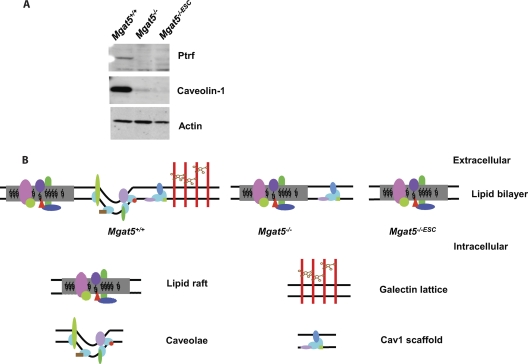
As previously reported (19, 20), Cav1 expression in Mgat5−/− cells is greatly reduced relative to Mgat5+/+ cells and in Mgat5−/−ESC cells it is eliminated essentially completely. Expression of PTRF/cavin-1 is significantly reduced in both Mgat5−/− cell lines (Fig. 1A); this is consistent with its requirement for caveolae formation (7) but also for stable Cav1 expression (24). Thus, Mgat5+/+ cells potentially have caveolae, Cav1 scaffolds and noncaveolar lipid rafts, Mgat5−/− cells have Cav1 scaffolds and noncaveolar lipid rafts and Mgat5−/−ESC only contain noncaveolar lipid rafts (Fig. 1B). This is consistent with the hypothesis that the functional noncaveolar, Cav1-positive domains in Mgat5−/− cells are different from caveolae in Mgat5+/+ cells.
Fig. 1.
The Mgat5 cell lines. A, Western blot showing the Cav1 and PTRF levels in Mgat5 cells, actin as a loading control. B, Model of Mgat5+/+, Mgat5−/−, and Mgat5−/−ESC showing noncaveolar lipid raft, caveolae, galectin lattice, and Cav1 scaffold on the plasma membrane.
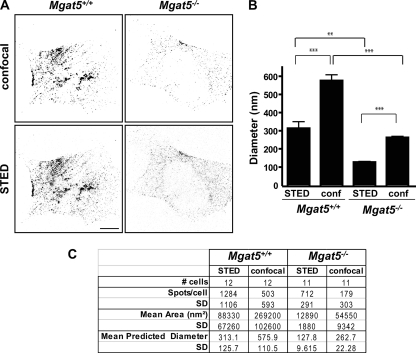
Indeed, confocal images show that Cav1 is distributed in larger clusters in caveolae-expressing Mgat5+/+ cells compared with Mgat5−/− cells (Fig. 2A). Super-resolution imaging of Cav1 in Mgat5+/+ and Mgat5−/− cell lines using STED allows us to resolve many more and much smaller-diameter spots than with conventional confocal microscopy (Fig. 2B and 2C). This state-of-the-art imaging method did not offer a significant advantage when analyzing Mgat5+/+ cells as the spot size hovered around the resolution of diffraction-limited microscopy. However, in Mgat5−/− cells, STED was able to accurately measure what confocal could not: average spot size in these cells was 128 ± 10 nm. Of particular interest, Cav1 in Mgat5+/+ cells presented a highly variable spot size, even in STED images, perhaps because of the presence of both individual caveolae clusters and Cav1 scaffolds. Cav1 spot size in Mgat5−/− cells was highly homogeneous. This suggests that Cav1 scaffolds are uniform suboptical resolution domains smaller than and distinct from caveolae.
Fig. 2.
STED and confocal analysis of Cav1 labeled structures in Mgat5+/+ and Mgat5−/− cells. A, Mgat5+/+ and Mgat5−/− cells were stained for Cav1 and analyzed by confocal and STED microscopy as indicated. Signal dynamic range was adjusted for each STED and confocal image acquisition (gain ∼ 800 V for confocal images and ∼1000 V for STED images) and images processed using a median filter radius 3 and application of a 30–255 intensity threshold to 8-bit images. Bar: 10 μm. B, The mean diameter (±S.E.) of Cav1-positive structures from STED and confocal images for Mgat5+/+ and Mgat5−/− cells was quantified for 11–12 cells from three independent experiments. ** p < 0.05, *** p < 0.005. C, Quantified data for the diameter of Cav1-positive structures from STED and confocal images is presented in table form.
The DRM Proteome of Caveolae and Cav1 Scaffold Expressing Cells
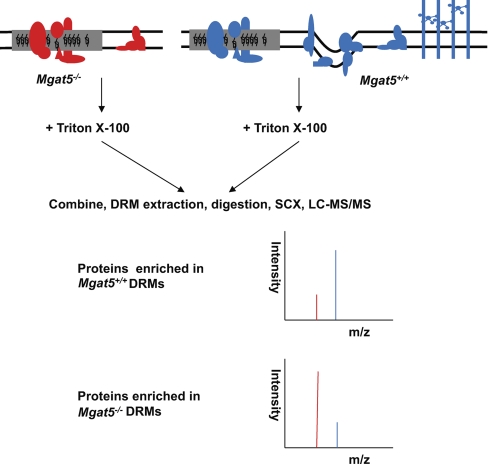
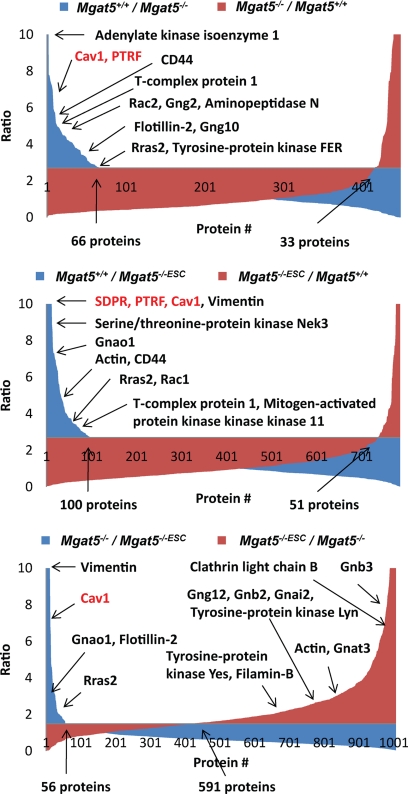
As these cell models appear to have distinct caveolar structures, we then turned to mass spectrometry-based proteomics to characterize the differential protein composition of DRMs from these cells (13, 25, 26). Mgat5+/+ cells were mass encoded with SILAC and then combined with equal masses of protein from light-labeled Mgat5−/− or Mgat5−/−ESC cells; DRMs were subsequently purified and analyzed by mass spectrometry. A high heavy:light ratio for a protein detected in this scheme would suggest that it is enriched in the Mgat5+/+ cell DRMs and therefore potentially associated with caveolae (Fig. 3). To assign a protein as specific to the DRMs of one cell type or another, we opted to use a cut-off set at two population standard deviations away from the mean (x̄ + 2σ) for three or four biological replicates. In a binary comparison of Mgat5+/+ versus Mgat5−/−, this yielded 66 proteins specific to Mgat5+/+ DRMs and 33 proteins specific to Mgat5−/− DRMs, out of more than 400 proteins identified. There was also roughly twice the number of proteins identified in Mgat5+/+ DRMs versus Mgat5−/−ESC (100 versus 51 out of 700 total protein identifications) (Fig. 4). The Mgat5+/+-specific subset includes Cav1, the raft marker protein Flotillin as well as PTRF/cavin-1 and SDPR/cavin-2 (supplemental Tables S1 and S2). Comfortingly, the SILAC ratios validated our immunoblotting (Fig. 1A), with Cav1 showing very large Mgat5+/+/Mgat5−/−ESC and Mgat5+/+/Mgat5−/− ratios. PTRF/cavin-1 showed a 7:1 Mgat5+/+/Mgat5−/− ratio and very large (>10) Mgat5+/+/Mgat5−/−ESC ratio. These proteomic data confirm the graded expression of Cav1 from Mgat5+/+/Mgat5−/−/Mgat5−/−ESC cells as well as the elevated expression of PTRF/cavin-1 in Mgat5+/+ cells relative to both Mgat5−/− and Mgat5−/−ESC cells.
Fig. 3.
The use of SILAC to determine proteins that are differentially expressed in the detergent-resistant membrane of Mgat5 cells. 4/6 labeled Mgat5+/+ cells were compared with 0/0 labeled Mgat5−/− or Mgat5−/−ESC and 4/6 labeled Mgat5−/− with 0/0 labeled Mgat5−/−ESC. Cell lysates were combined at equal mass prior to DRM extraction. Here, the figure showing an example of Mgat5+/+ versus Mgat5−/−. Proteins enriched in Mgat5+/+ are having relative high ratios and are the caveolae proteins; lower ratio ones are proteins enriched in the Mgat5−/− DRMs.
Fig. 4.
Proteins enriched in DRMs or membrane rafts of each of the Mgat5 cells tested and compared. Proteins identified and quantified in each of the comparisons were sorted in decreasing ratio. x̄ + 2σ for Mgat5+/+ versus Mgat5−/− and Mgat5+/+ versus Mgat5−/−ESC was 2.7 and for Mgat5−/− versus Mgat5−/−ESC was 1.5.
Ingenuity Pathways Analysis showed that the proteins enriched in Mgat5+/+ relative to either Mgat5−/− or Mgat5−/−ESC cells were highly relevant to cellular movement and morphology, cellular assembly and organization and cell signaling (supplemental Fig. S3). Supporting this analysis, common proteins enriched in Mgat5+/+ relative to either Mgat5−/− or Mgat5−/−ESC cells include Actin, Cav1, Flotillin, Rac, R-Ras, CD44, Aminopeptidase N and several heterotrimeric G-protein subunits (supplemental Table S1 and Table I). The very high enrichment of heterotrimeric G-proteins suggests that their localization in DRMs depends on caveolae formation and that loss of caveolae results in reduction of this class of proteins from membrane rafts. In order to orthogonally validate the specificity of proteins identified in the SILAC/Mgat5 data, we used a label-free mass spectrometry approach to compare DRMs from WT and Caveolin-1 knock out (Cav1−/−) mouse embryonic fibroblasts (MEFs); reassuringly, there was at least 30% overlap between the caveolae-specific proteins identified between the two methods, which differed in both the cell type and analytical approach (supplemental Table S1).
Table I. Heterotrimeric G protein enrichment in proteomic analyses.
|
Mgat5+/+ vs. Mgat5−/− |
Mgat5+/+ vs. Mgat5−/−ESC |
Mgat5−/−ESCvs. Mgat5−/− |
Quantitative CoIP |
Non treated vs. MβCD treated Mgat5+/+ |
MEF WT/Cav−/− |
|||||
|---|---|---|---|---|---|---|---|---|---|---|
| Names | Ratios | Names | Ratios | Names | Ratios | Names | Ratios | Names | Ratios | Names |
| Gng2a | 4.48 | Gnao1a | 7.33 | Gnb3a | 7.28 | Gng12a | 7.12 | Gnat3a | 10.09 | Gng10a |
| Gnb4a | 3.85 | Gnaqa | 2.76 | Gng10a | 6.08 | Gnb2l1 | 1.78 | Gnb3a | 6.51 | Gnai2a |
| Gnaqa | 3.69 | Gng2 | 2.51 | Gng2a | 4.96 | Gnai2 | 0.75 | Gnb4a | 6.02 | Gnb1a |
| Gna13a | 3.42 | Gna13 | 2.15 | Gnb4a | 2.9 | Gnb2 | 0.72 | Gna11a | 4.35 | |
| Gng10a | 3.36 | Gna11 | 2.14 | Gnb1a | 2.89 | Gnb1 | 0.66 | Gnai2a | 4.03 | |
| Gnao1a | 2.99 | Gnb3 | 1.96 | Gnat3a | 2.7 | Gnb2a | 4.02 | |||
| Gnai2a | 2.95 | Gnb4 | 1.88 | Gnai1a | 2.65 | Gnaqa | 3.96 | |||
| Gnb2a | 2.91 | Gnb2 | 1.84 | Gna11a | 2.58 | Gnai3a | 3.96 | |||
| Gng12a | 2.82 | Gng12 | 1.68 | Gnai3a | 2.5 | Gng10a | 3.43 | |||
| Gnb1 | 2.47 | Gnb1 | 1.62 | Gna13a | 2.41 | Gnb1a | 3.27 | |||
| Gnai3 | 1.91 | Gnai2 | 1.51 | Gnas-1a | 2.39 | Gnas-1a | 3.16 | |||
| Gng5 | 1.68 | Gng5 | 1.25 | Gng12a | 2.38 | Gna13a | 2.98 | |||
| Gna11 | 1.48 | Gnai3 | 1.2 | Gnai2a | 2.37 | Gnas-3a | 2.91 | |||
| Gnas-1 | 0.8 | Gnb2a | 2.37 | Gng12a | 2.73 | |||||
| Gng10 | 0.62 | Gnb2l1a | 2.16 | Gng5a | 2.71 | |||||
| Gnat3 | 0.62 | Gnaqa | 1.97 | Gnao1a | 2.45 | |||||
| Gnai1 | 0.61 | Gng5a | 1.63 | Gnb2l1a | 1.73 | |||||
| Gng7 | 0.74 | Gng2a | 1.72 | |||||||
| Gnao1 | 0.32 | |||||||||
a Indicates which proteins satisfied the requirement for enrichment.
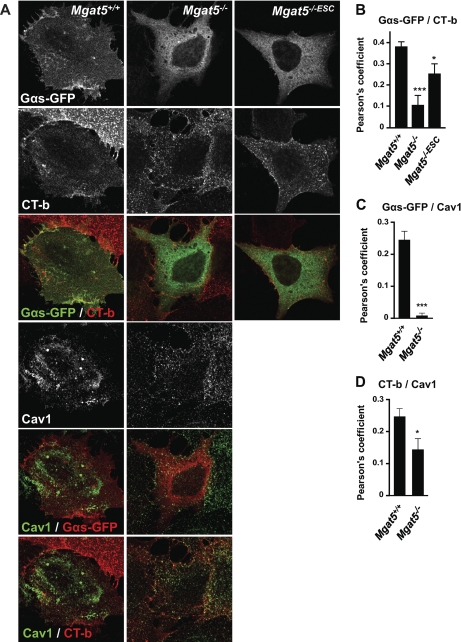
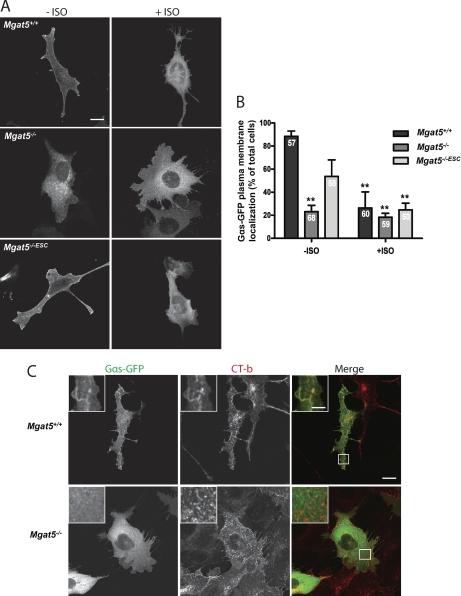
To validate the distribution of heterotrimeric G-proteins in and out of rafts and caveolae, we determined the extent of colocalization of Gαs-GFP with the GM1-ganglioside binding raft marker CT-b and with Cav1. Gαs-GFP shows increased colocalization with CT-b in Mgat5+/+ cells relative to Mgat5−/− or Mgat5−/−ESC cells. It also shows increased colocalization with Cav1 on Mgat5+/+ cells relative to Mgat5−/− (Fig. 5). We further assessed surface Gαs-GFP expression in the cell lines and its response to β-adrenergic receptor activation with isoproterenol (Fig. 6). Consistent with its elevated raft expression in Mgat5+/+ and Mgat5−/−ESC cells, Gαs-GFP showed increased surface distribution in these cells relative to Mgat5−/− cells. Upon treatment with isoproterenol, surface expression in Mgat5+/+ cells was lost and, importantly, partially colocalized with CT-b in internal vesicles, as previously reported (27). This validates the increased expression of heterotrimeric G-proteins seen in the DRM proteomic analysis and suggests that caveolae expression promotes recruitment of heterotrimeric G-proteins to both caveolar and noncaveolar raft domains.
Fig. 5.
Increased colocalization of Gαs-GFP with Cholera Toxin b and Cav1 in Mgat5+/+ cells. A, Mgat5+/+, Mgat5−/− and Mgat5−/−ESC cells were transfected with Gαs-GFP and incubated with Alexa-546 coupled-CT-b before staining for Cav1. Pearson's coefficient revealed the level of colocalization between Gαs-GFP and CT-b (B), Gαs-GFP and Cav1 (C) and Cav1 and CT-b (D). Pearson's colocalization coefficients for Gαs-GFP and CT-b colocalization are shown for Mgat5+/+, Mgat5−/−, and Mgat5−/−ESC cells and colocalization with Cav1 for Mgat5+/+, and Mgat5−/− cells. Graphs represent 10–18 cells from one representative experiment over four independent experiments. * p < 0.05, *** p < 0.005. Bar: 10 μm.
Fig. 6.
Gαs-GFP is internalized upon activation with isoproterenol in Mgat5+/+ and Mgat5−/−ESC cells. A, Mgat5+/+, Mgat5−/−, and Mgat5−/−ESC cells were transfected with Gαs-GFP and incubated with 10 μm isoproterenol (ISO) for 15 min at 37 °C. Representative images of Gαs-GFP in the three cell lines are shown. B, Gαs-GFP expressing cells were scored based on Gαs-GFP plasma membrane expression in the presence and absence of isoproterenol treatment. The total number of cells counted from three independent experiments is shown for each condition (within columns). ** p < 0.01 compared with Mgat5+/+ without isoproterenol. Bar: 10 μm. C, Mgat5+/+ and Mgat5−/− cells were transfected with Gαs-GFP and incubated with Alexa-546 coupled-CT-b at 4 °C for 20 min. Next, DMEM containing 10 μm isoproterenol was added to the cells for 15 min at 37 °C before fixation with PFA. Confocal images of Gαs-GFP (green) and Ct-b (red) are shown. Bar: 10 μm, zoom bar: 3 μm.
A dramatic bias was observed in the Mgat5−/− versus Mgat5−/−ESC, with almost 600 proteins expressed dominantly in the Mgat5−/−ESC cell rafts and only 56 in Mgat5−/− (Fig. 4, supplemental Table S2). This suggests that whereas caveolar Cav1 expression recruits proteins to rafts, noncaveolar Cav1, or Cav1 scaffolds, restricts the DRM proteome. Indeed, Gαs-GFP association with CT-b-labeled rafts was increased in Mgat5−/−ESC cells relative to Mgat5−/− cells (Fig. 5). Supported by the proteomics data, 17 out of the 19 heterotrimeric G-proteins identified in Mgat5−/− versus Mgat5−/−ESC meet the (x̄ + 2σ) criteria and are therefore enriched in the Mgat5−/−ESC DRMs (Fig. 4 and Table I). Moreover, many of the proteins (e.g. Actin, Filamin-B, Tyrosine kinase Yes) enriched in the caveolae-containing Mgat5+/+ DRMs were also identified with high ratios here, meaning they are restored in the Mgat5−/−ESC DRM when there is no Cav1 expression in the cell. Ingenuity Pathways Analysis showed that Mgat5−/−ESC DRMs are enriched in proteins involved in signaling, growth, assembly and cell movement as well as proteins related to cancer and cell death (supplemental Fig. S3). That we were only able to detect 33 proteins enriched in the Mgat5−/− DRM proteome versus Mgat5+/+ and 57 versus Mgat5−/−ESC cells suggests that Cav1 scaffolds interact with a narrower set of proteins than whole caveolae. The dramatic enrichment of DRM proteins in Mgat5−/−ESC cells, in which loss of Cav1 scaffolds restores EGF signaling and CT-b movement and endocytosis (19, 20), suggests that Cav1 may indirectly regulate raft composition. These observations are unlikely to be explainable by the lack of a galectin lattice in Mgat5−/− or Mgat5−/−ESC versus Mgat5+/+ because interfering with lattice integrity in Mgat5+/+ cells with lactose actually results in more proteins in the DRMs (Boscher et al., in preparation).
Cav1 and Cholesterol-dependence of the Caveolar DRM Proteome
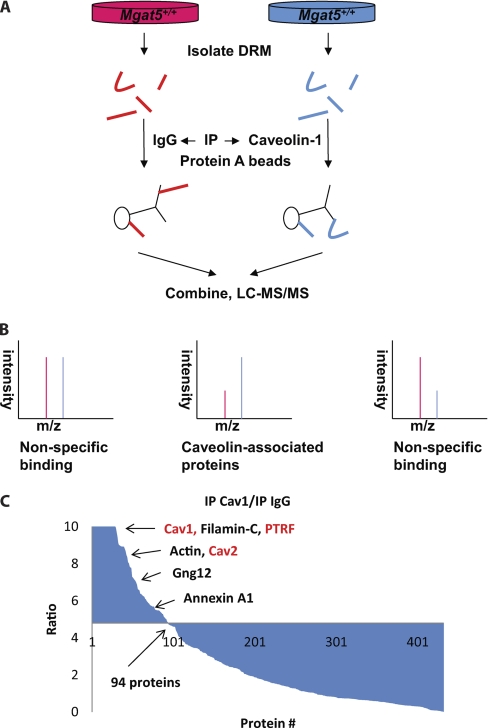
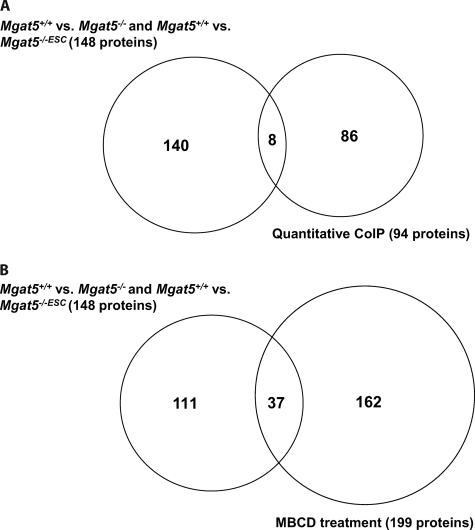
To complement the subcellular fractionation approach above, we also immunoisolated Cav1-containing structures from DRMs of Mgat5+/+ cells and quantitatively compared the composition of this preparation versus a nonspecific IgG control using SILAC (Fig. 7A and 7B). Of more than 400 proteins identified and quantified from four independent experiments, 94 proteins exceeded (x̄ + 2σ); these include Cav1 and Cav2 with the highest ratios and most peptides identified, PTRF/cavin-1, heterotrimeric G-proteins, Filamin, and Actin (Fig. 7C). Among the 94 Cav1-associated proteins, eight of them were also identified to be caveolae-associated in the Mgat5+/+ versus Mgat5−/− and Mgat5+/+ versus Mgat5−/−ESC comparisons (148 caveolae proteins identified in total, either present in Mgat5+/+ versus Mgat5−/− and/or Mgat5+/+ versus Mgat5−/−ESC) (Fig. 8A), meaning some of the DRM-associated proteins in caveolae-expressing cells associate with Cav1 (supplemental Table S1 and S3). The presence of heterotrimeric G-protein subunits and other signaling proteins supports the role of caveolae formation in the recruitment of these proteins to lipid rafts by Cav1 but also suggests that raft association of G proteins may occur independently of Cav1 and caveolae (Table I).
Fig. 7.
Co-immunoprecipitation of caveolin-1 associated proteins in Mgat5+/+ DRMs. A, Mgat5+/+ cells were labeled 0/0 and 4/6 and then DRMs were extracted from the two separately. 0/0 DRMs were IP with nonspecific IgG and 4/6 with Caveolin-1 antibody. Finally, the two pull-downs were combined as one sample. B, Spectra of caveolin-1 associated proteins are ones with high ratios and nonspecific binding partners are having low ratios or relative equal ratios. C, Result of the quantitative co-IP experiment showing ratios in decreasing order over protein numbers. x̄ + 2σ = 4.8.
Fig. 8.
Overlap of protein identifications. A, Proteins identified to be enriched in Mgat5+/+ rafts relative to Mgat5−/− or Mgat5−/−ESC were compared with proteins identified to be associated with protein caveolin-1 in the quantitative co-IP experiment. B, Proteins identified to be enriched in Mgat5+/+ rafts relative to Mgat5−/− or Mgat5−/−ESC were compared with proteins showed to be sensitive to MβCD treatment.
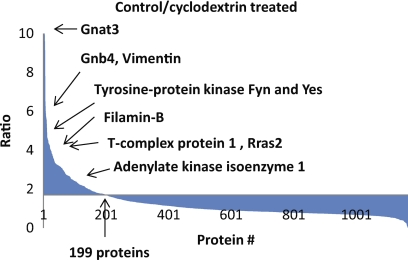
In order to test how many of the caveolae proteins identified are actually components of lipid rafts or raft-dependent proteins, we next measured the cholesterol-dependence of the caveolae proteins identified here (13). Three biological replicates of DRM analyses from MβCD-treated versus untreated Mgat5+/+ cells identified more than 1000 proteins with nontreated and treated ratios ranging from over 10 to less than 1. Of the 199 proteins depleted by MβCD, 37 of them were previously identified as caveolae proteins from the DRM comparison experiments (Fig. 8B) and 47 are in caveolae and/or Cav1-associated (supplemental Table S1 and S3), when taking into account the Cav1 immunoisolating experiments. Consistent with the raft enrichment of heterotrimeric G-proteins in Mgat5+/+ cells, all 18 heterotrimeric G-protein subunits identified have high ratios, indicative of their cholesterol-dependent raft localization (Table I). Similarly, other signaling proteins (e.g. Tyrosine kinase Fyn and Yes, R-Ras) and Vimentin and Filamin were strongly affected by MβCD, consistent with a previous study (14) (Fig. 9).
Fig. 9.
MβCD treatment for identifying cholesterol sensitive lipid raft proteins in Mgat5+/+. Results showing the ranking of proteins' sensitivity toward MβCD treatment over protein numbers. x̄ + 2σ = 1.7.
DISCUSSION
Rafts have fascinated cell biologists for over twenty years and proteomicists for almost half that time. Although it is clear that multiple distinct classes of rafts exist, as opposed to a continuum of sizes and compositions, it is equally clear that existing biochemical methods are insufficient to tease apart these subtleties. Cav1 is a critical regulator of raft domains and here we have taken advantage of the distinct states of caveolin and caveolae in a series of cell lines derived from wild-type and Mgat5−/− mammary tumors to identify how caveolar and noncaveolar Cav1 impact on the protein composition of detergent-resistant membranes in cells. To our knowledge, all previous biochemical preparations of rafts and/or caveolae have contained nonraft contaminants that complicate any interpretation of the data without resorting to biased selection of “real” raft proteins (28). Two recent studies have used Cav1−/− cells (7, 25) to identify some of the proteins in caveolae but other than Cav1 itself and members of the cavin family of proteins, none of the other reported proteins seem likely to be functional components of caveolae. Beyond simply extending the catalogue of caveolar proteins, our identification here of many signaling proteins in DRMs reinforces the role of rafts as cellular signaling platforms and reveals that caveolae and rafts seem to be particularly enriched for heterotrimeric G protein subunits.
In a similar fashion to the data presented here (Figs. 5, 6), Cav1 knockdown in C6 glioma cells reduces Gαs association with lipid rafts and reduces Gαs-GFP internalization in response to β-adrenergic receptor activation with isoproterenol (27). Our results further suggest that Cav1 expression independently of caveolae, i.e. Cav1 scaffolds, is particularly associated with reduced lipid raft association of G proteins. Cav1 regulation of GPCR and G protein signaling therefore appears to be associated not just with Cav1 expression but also by the relative expression of caveolae and Cav1 scaffolds. Reduced expression of Cav1 and of PTRF, as shown here in Mgat5−/− cells, will result in Cav1 scaffold expression. However, impairment of endothelial VEGF signaling by transgenic expression of Cav1 independently of increased caveolae (29) suggests that caveolae and Cav1 scaffolds can co-exist and function independently in the same cell to regulate signaling. Indeed, the extent to which caveolin-cavin expression and stoichiometry impacts on relative expression of caveolae, Cav1 scaffolds and noncaveolar lipid rafts and their regulation of signaling pathways, including but not limited to G proteins, remains to be determined.
Intriguingly, our data also suggest that caveolin expression is not the only determinant of protein composition of caveolar domains, which is in agreement with other reports that cavin proteins also play a major role in caveolae formation (7–9, 11). In Mgat5−/− cells where Cav1 is found at the cell surface but where caveolae do not form, more than twice as many proteins come out of DRMs as go in, indicating that the caveolae structure itself has a dramatic impact on caveolae and membrane raft composition. This is consistent with STED measurements suggesting that the Cav1 scaffolds at the membrane of these cells exist as much smaller domains than whole caveolae in wild-type cells. Minimal Cav1 oligomers have been reported to consist of ∼15 Cav1 monomers whereas caveolae have been proposed to contain ∼144 Cav1 molecules (30, 31). Although we cannot predict the precise size of Cav1 scaffolds, the highly homogeneous and reduced size of Cav1 staining in Mgat5−/− cells lacking caveolae suggests that Cav1 scaffolds might correspond to minimal Cav1 oligomers that subsequently combine to form caveolae. The fact that Cav1 scaffolds restrict the raft proteome to a greater extent than caveolae suggests that recruitment to caveolae impacts on Cav1 interaction with proteins and its regulation of raft domains.
Our data allow us to resolve one class of rafts, i.e. caveolae, away from the others found in DRMs and demonstrate the existence of distinct Cav1-associated subtypes. Because the set of proteins enriched in Cav1 IPs and the set impacted by Mgat5−/− or Mgat5−/−ESC cells (Fig. 4 versus Fig. 7) do not completely overlap, it suggests that the proteins that copurify with Cav1 but that are not affected by caveolae disruption may represent a subclass of Cav1 domains distinct from classical caveolae. At the same time, however, the immunoisolation of Cav1-containing structures has some caveats. Although we tried to enrich membranes before detergent extraction and subsequent Cav1 immunoisolation, some typically nuclear and cytosolic proteins clearly remain: whether this reflects the real composition of Cav1-containing structures or simply copurifying contaminants will require more study. As a general comment, we have found that it can be very difficult to obtain sufficient enrichment of the desired targets when immunoisolating membranes from detergent solubilized cells. Immunoisolation is used frequently and effectively to enrich vesicles and other membrane-bound organelles so we suspect that the presence of detergents and the associated micelles result in more nonspecific interactions.
Using a panel of cell types with varying caveolae statuses, as well as subdiffraction limit microscopy and conventional confocal microscopy, we show that caveolae and Cav1 scaffolds differ in size and impact differently on the protein composition of lipid raft domains. Together with noncaveolar raft domains, these therefore represent functionally distinct subtypes of lipid rafts. Differential raft protein composition in Cav1 scaffold expressing Mgat5−/− cells argues that both Cav1 and its cavin-dependent ability to form caveolae impact on raft composition and function defining novel biological roles for caveolae.
Acknowledgments
We thank the other members of our respective groups for fruitful discussions. We are particularly grateful to Vladimir Zhukarev (Leica), who provided us with access to a Leica SP5 STED CW microscope and assisted us with acquisition of the images; Rob Parton for providing the MEF cells; Tom Hennessy from Agilent for software help, and Nick Stoynov for his help with Proteome Discover.
Footnotes
* This work was supported by the Canadian Institutes of Health Research Operating Grant MOP-77688 to LJF and MOP-43938 to IRN and a Prostate Cancer Canada grant to LJF and IRN. YZZ is supported by a University of British Columbia Four-year Fellowship, MF by a Michael Smith Foundation for Health Research Fellowship, and LJF is the Canada Research Chair in Quantitative Proteomics. The mass spectrometry facilities used in this study were supported, in part, by the Canada Foundation for Innovation, the BC Knowledge Development Fund, and the BC Proteomics Network. MMH is supported by Australian National Health and Medical Research Council Career Development Fellowship APP569512.
 This article contains supplemental Figs S1 to S3 and Tables S1 to S3.
We have declared no conflict of interest.
1 The abbreviations used are:
- Cav1
- Caveolin-1
- PTRF
- Polymerase I and transcript release factor
- Mgat5
- Golgi β-1,6N-acetylglucosaminyltransferase V
- STED
- Stimulated Emission Depletion microscopy
- SILAC
- Stable Isotope Labeling by Amino acids in Cell culture
- DRMs
- Detergent-resistant membranes
- EGFR
- Epidermal Growth Factor Receptor
- CT-b
- Cholera toxin b-subunit
- MEFs
- Mouse embryonic fibroblasts
- SDC
- Sodium deoxycholate
- Tx-100
- Triton X-100
- MβCD
- Methyl-β-cyclodextrin
- LC-MS/MS
- Liquid chromatography-tandem mass spectrometry
- SDPR
- Serum deprivation protein response
- IPA
- Ingenuity Pathways Analysis.
REFERENCES
- 1. Zheng Y. Z., Foster L. J. (2009) Biochemical and proteomic approaches for the study of membrane microdomains. J. Proteomics. 72, 12–22 [DOI] [PubMed] [Google Scholar]
- 2. Simons K., Ikonen E. (1997) Functional rafts in cell membranes. Nature. 387, 569–572 [DOI] [PubMed] [Google Scholar]
- 3. Brown D. A., Rose J. K. (1992) Sorting of GPI-anchored proteins to glycolipid-enriched membrane subdomains during transport to the apical cell surface. Cell. 68, 533–544 [DOI] [PubMed] [Google Scholar]
- 4. Lajoie P., Nabi I. R. (2010) Lipid rafts, caveolae, and their endocytosis. Int. Rev. Cell Mol. Biol. 282, 135–163 [DOI] [PubMed] [Google Scholar]
- 5. Foster L. (2006) Mass spectrometry outgrows simple biochemistry: new approaches to organelle proteomics. Biophys. Rev. Lett. 1, 163–175 [Google Scholar]
- 6. Parton R. G., Simons K. (2007) The multiple faces of caveolae. Nat. Rev. Mol. Cell Biol. 8, 185–194 [DOI] [PubMed] [Google Scholar]
- 7. Hill M. M., Bastiani M., Luetterforst R., Kirkham M., Kirkham A., Nixon S. J., Walser P., Abankwa D., Oorschot V. M., Martin S., Hancock J. F., Parton R. G. (2008) PTRF-Cavin, a conserved cytoplasmic protein required for caveola formation and function. Cell. 132, 113–124 [DOI] [PMC free article] [PubMed] [Google Scholar]
- 8. McMahon K. A., Zajicek H., Li W. P., Peyton M. J., Minna J. D., Hernandez V. J., Luby-Phelps K., Anderson R. G. (2009) SRBC/cavin-3 is a caveolin adapter protein that regulates caveolae function. EMBO J. 28, 1001–1015 [DOI] [PMC free article] [PubMed] [Google Scholar]
- 9. Bastiani M., Liu L., Hill M. M., Jedrychowski M. P., Nixon S. J., Lo H. P., Abankwa D., Luetterforst R., Fernandez-Rojo M., Breen M. R., Gygi S. P., Vinten J., Walser P. J., North K. N., Hancock J. F., Pilch P. F., Parton R. G. (2009) MURC/Cavin-4 and cavin family members form tissue-specific caveolar complexes. J. Cell Biol. 185, 1259–1273 [DOI] [PMC free article] [PubMed] [Google Scholar]
- 10. Allen J. A., Yu J. Z., Donati R. J., Rasenick M. M. (2005) Beta-adrenergic receptor stimulation promotes G alpha s internalization. Mol. Pharmacol. 67, 1493–1504 [DOI] [PubMed] [Google Scholar]
- 11. Hansen C. G., Bright N. A., Howard G., Nichols B. J. (2009) SDPR induces membrane curvature and functions in the formation of caveolae. Nat. Cell Biol. 11, 807–814 [DOI] [PMC free article] [PubMed] [Google Scholar]
- 12. Nabi I. R. (2009) Cavin fever: regulating caveolae. Nat. Cell Biol. 11, 789–791 [DOI] [PubMed] [Google Scholar]
- 13. Foster L. J., De Hoog C. L., Mann M. (2003) Unbiased quantitative proteomics of lipid rafts reveals high specificity for signaling factors. Proc. Natl. Acad. Sci., U.S.A. 100, 5813–5818 [DOI] [PMC free article] [PubMed] [Google Scholar]
- 14. Zheng Y. Z., Berg K. B., Foster L. J. (2009) Mitochondria do not contain lipid rafts, and lipid rafts do not contain mitochondrial proteins. J. Lipid Res. 50, 988–998 [DOI] [PMC free article] [PubMed] [Google Scholar]
- 15. Head B. P., Insel P. A. (2007) Do caveolins regulate cells by actions outside of caveolae? Trends Cell Biol. 17, 51–57 [DOI] [PubMed] [Google Scholar]
- 16. Lajoie P., Goetz J. G., Dennis J. W., Nabi I. R. (2009) Lattices, rafts, and scaffolds: domain regulation of receptor signaling at the plasma membrane. J. Cell Biol. 185, 381–385 [DOI] [PMC free article] [PubMed] [Google Scholar]
- 17. Dennis J. W., Lau K. S., Demetriou M., Nabi I. R. (2009) Adaptive regulation at the cell surface by N-glycosylation. Traffic. 10, 1569–1578 [DOI] [PubMed] [Google Scholar]
- 18. Granovsky M., Fata J., Pawling J., Muller W. J., Khokha R., Dennis J. W. (2000) Suppression of tumor growth and metastasis in Mgat5-deficient mice. Nat. Med. 6, 306–312 [DOI] [PubMed] [Google Scholar]
- 19. Lajoie P., Partridge E. A., Guay G., Goetz J. G., Pawling J., Lagana A., Joshi B., Dennis J. W., Nabi I. R. (2007) Plasma membrane domain organization regulates EGFR signaling in tumor cells. J. Cell Biol. 179, 341–356 [DOI] [PMC free article] [PubMed] [Google Scholar]
- 20. Lajoie P., Kojic L. D., Nim S., Li L., Dennis J. W., Nabi I. R. (2009) Caveolin-1 regulation of dynamin-dependent, raft-mediated endocytosis of cholera toxin-B sub-unit occurs independently of caveolae. J. Cell. Mol. Med. 13, 3218–3225 [DOI] [PMC free article] [PubMed] [Google Scholar]
- 21. Sigismund S., Woelk T., Puri C., Maspero E., Tacchetti C., Transidico P., Di Fiore P. P., Polo S. (2005) Clathrin-independent endocytosis of ubiquitinated cargos. Proc. Natl. Acad. Sci., U.S.A. 102, 2760–2765 [DOI] [PMC free article] [PubMed] [Google Scholar]
- 22. Rogers L. D., Foster L. J. (2007) The dynamic phagosomal proteome and the contribution of the endoplasmic reticulum. Proc. Natl. Acad. Sci., U.S.A. 104, 18520–18525 [DOI] [PMC free article] [PubMed] [Google Scholar]
- 23. Chan Q. W., Foster L. J. (2008) Changes in protein expression during honey bee larval development. Genome Biol. 9, R156. [DOI] [PMC free article] [PubMed] [Google Scholar]
- 24. Liu L., Brown D., McKee M., Lebrasseur N. K., Yang D., Albrecht K. H., Ravid K., Pilch P. F. (2008) Deletion of Cavin/PTRF causes global loss of caveolae, dyslipidemia, and glucose intolerance. Cell. Metab. 8, 310–317 [DOI] [PMC free article] [PubMed] [Google Scholar]
- 25. Dávalos A., Fernández-Hernando C., Sowa G., Derakhshan B., Lin M. I., Lee J. Y., Zhao H., Luo R., Colangelo C., Sessa W. C. (2010) Quantitative proteomics of caveolin-1-regulated proteins: characterization of polymerase i and transcript release factor/CAVIN-1 IN endothelial cells. Mol. Cell. Proteomics 9, 2109–2124 [DOI] [PMC free article] [PubMed] [Google Scholar]
- 26. Zheng Y. Z., Foster L. J. (2009) Contributions of quantitative proteomics to understanding membrane microdomains. J. Lipid Res. 50, 1976–1985 [DOI] [PMC free article] [PubMed] [Google Scholar]
- 27. Allen J. A., Yu J. Z., Dave R. H., Bhatnagar A., Roth B. L., Rasenick M. M. (2009) Caveolin-1 and lipid microdomains regulate gs trafficking and attenuate Gs/adenylyl cyclase signaling. Mol. Pharmacol. 76, 1082–1093 [DOI] [PMC free article] [PubMed] [Google Scholar]
- 28. Foster L. J., Chan Q. W. (2007) Lipid raft proteomics: more than just detergent-resistant membranes. Subcell. Biochem. 43, 35–47 [DOI] [PubMed] [Google Scholar]
- 29. Bauer P. M., Yu J., Chen Y., Hickey R., Bernatchez P. N., Looft-Wilson R., Huang Y., Giordano F., Stan R. V., Sessa W. C. (2005) Endothelial-specific expression of caveolin-1 impairs microvascular permeability and angiogenesis. Proc. Natl. Acad. Sci. U.S.A. 102, 204–209 [DOI] [PMC free article] [PubMed] [Google Scholar]
- 30. Monier S., Parton R. G., Vogel F., Behlke J., Henske A., Kurzchalia T. V. (1995) VIP21-caveolin, a membrane protein constituent of the caveolar coat, oligomerizes in vivo and in vitro. Mol. Biol. Cell 6, 911–927 [DOI] [PMC free article] [PubMed] [Google Scholar]
- 31. Pelkmans L., Zerial M. (2005) Kinase-regulated quantal assemblies and kiss-and-run recycling of caveolae. Nature 436, 128–133 [DOI] [PubMed] [Google Scholar]


