Abstract
The absolute need to improve the separating power of liquid chromatography, especially for multi-constituent biological samples, is becoming increasingly evident. In response, over the past few years, there has been a great deal of interest in the development of two dimension liquid chromatography (2DLC). Just as 1DLC is preferred to 1DGC based on its compatibility with biological materials we believe that ultimately 2DLC will be preferred to the much more highly developed 2DGC for such samples. The huge advantage of 2D chromatographic techniques over 1D methods is inherent in the tremendous potential increase in peak capacity (resolving power). This is especially true of comprehensive 2D chromatography wherein it is possible, under ideal conditions, to obtain a total peak capacity equal to the product of the peak capacities of the first and second dimension separations. However, the very long timescale (typically several hours to tens of hours) of comprehensive 2DLC is clearly its chief drawback. Recent advances in the use of higher temperatures to speed up isocratic and gradient elution liquid chromatography have been used to decrease the time needed to do the second dimension LC separation of 2DLC to about 20 seconds for a full gradient elution run. Thus fast, high temperature LC is becoming a very promising technique. Peak capacities of over 2000 and rates of peak capacity production of nearly 1 peak/s have been achieved. In consequence, many real samples showing more than 200 peaks with signal to noise ratios of better than 10:1 have been run in total times of under 30 minutes. This report is not intended to be a comprehensive review of 2DLC, but is deliberately focused on the issues involved in doing fast 2DLC by means of elevating the column temperature; however, many issues of broader applicability will be discussed.
1. INTRODUCTION
“All scientific progress is progress in a method.”
-- M. S. Tswett
1.1 2DLC: Concept, Instrumentation and Applications
The term “two dimensional liquid chromatography (2DLC)” refers to the technique in which two independent liquid phase separation systems are applied to the sample. 2DLC can be done by transferring either only the interesting portion of the first dimension effluent onto the second dimension, this is referred to as “heartcutting” chromatography, or by sequentially transferring the entirety of the first dimension effluent, in many small aliquots, onto the second dimension; this is known as “comprehensive” 2D chromatography (see below for more details). From an analytical perspective it is very fruitful to think of the second column and its associated detector as comprising a very chemically selective detector for the separation on the first column. The simple block diagram of a generalized 2DLC system in Fig. 1 shows all of the components contained by the dashed box effectively act as a chemically selective detector for peaks as they elute from the first dimension column (see below for additional comments).
Figure 1.

Block diagram of instrumentation for 2DLC. The dashed box indicates that the second dimension of the system effectively acts as a chemically selective detector for the peaks that elute from the first dimension column.
Karger, Snyder, and Horvath [1], and later Giddings [2] and Guiochon [3] pointed out the value of a true comprehensive two-dimensional separation (see Fig. 2) lies in the idea that under ideal circumstances (see below) the overall peak capacity (nc,2D) should be equal, not to the sum, but rather to the product of the individual peak capacities of the first and second dimension separations (1nc and 2nc, respectively):
| (1) |
Figure 2.
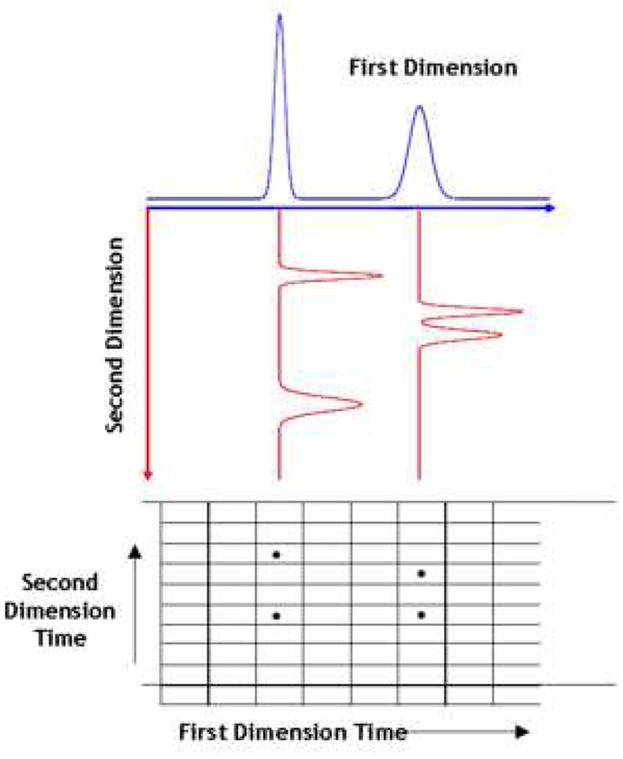
Illustration of the multiplicative relationship between the peak capacities of the independent first and second dimensions in comprehensive two-dimensional separations.
The history of the development of the theory and practice of multi-dimensional liquid chromatography was carefully reviewed by Schure [4]. Work on “online” comprehensive 2DLC was initiated by Erni and Frei in 1978 [5]. In 1990, Jorgenson and coworkers [6] utilized comprehensive 2DLC for protein separations; the full separation took six hours. By the early part of this century various forms of 2D liquid phase separation methods had become a mainstay of proteomics research [7-9]. In 2006, Stoll and Carr [10] used supra-ambient temperatures (110 °C) and high linear velocities (> 3 cm/s) on the second dimension column to speed up second dimension gradient elution separations to about 20 s, and thereby greatly shortening the overall comprehensive 2DLC separation to about 30 min. A schematic of the instrumentation used for this work is shown in Fig. 3. This opened a new era in the fast, routine use of 2DLC. A comparison of the separating ability demonstrated in Jorgenson’s initial work of 1990 and this lab’s work in 2006 is given in Fig. 4. While Jorgenson’s first work achieved a peak capacity production rate of 0.36/min, the latest work has a peak capacity productivity of 33/min, a nearly 100-fold improvement.
Figure 3.
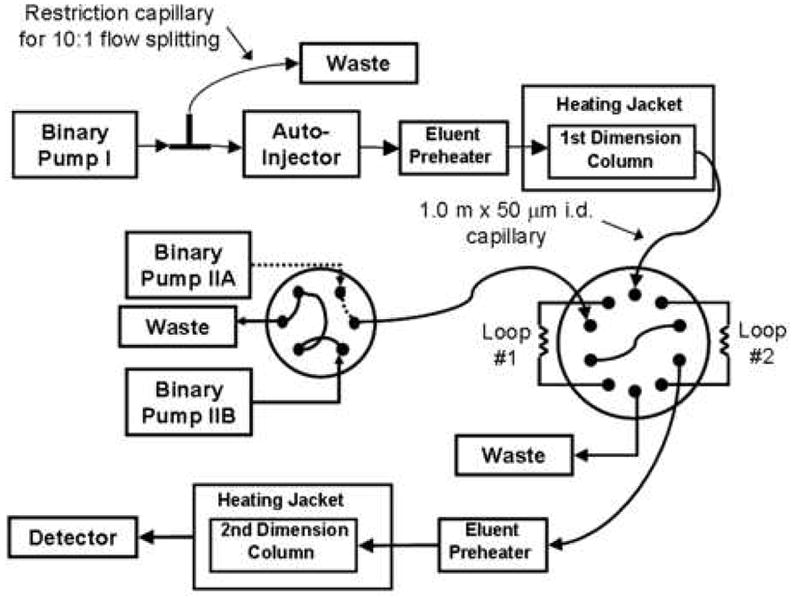
Schematic of instrumentation used for comprehensive, fast 2DLC using high temperature and high velocity to achieve high speed. From ref. [10].
Figure 4.
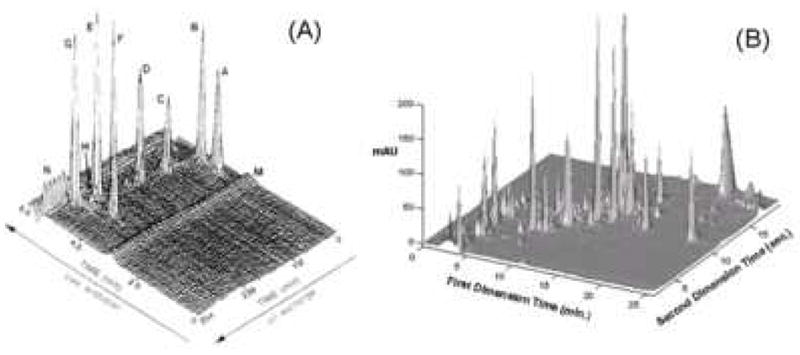
Comparison of (A) Jorgenson et al.’s 2D- and (B) Carr et al.’s 2D-separation chromatograms. Conditions: (A) protein sample, 5 μL/min, 0% to 100% buffer B from 20 to 260 mins; buffer A, 0.2 M NaH2PO4, pH 5; buffer B, 0.2 M NaH2PO4/0.25 M Na2SO4, pH 5. Detection at 215 nm. (B) corn seedling extract, First Dimension, 50 mm × 2.1 mm i.d. Discovery HS-F5; 0.10 mL/min; 5 to 70% B from 0 to 23 mins; buffer A, 20 mM NaH2PO4, 20 mM NaClO4, pH 5.7; solvent B, acetonitrile; 40 °C; Second Dimension, 50 mm × 2.1 mm i.d. ZirChrom-CARB; 3.00 mL/min; 0 to 70% B in 17.4 s; buffer A, 20 mM HClO4 in water; solvent B, acetonitrile; 110 °C; detection at 220 nm. Fig. 3(A) from ref. [6], fig 3(B) from ref. [10]. Note the huge differences in times scales in A and B.
Because of its high resolving power, 2DLC has received a great deal more attention during the past few years, especially by those dealing with complex samples. Table 1 presents a synopsis of some of the leading recent reviews of multidimensional separations, including 2DGC, 2DLC and other 2D combinations. Our group has successfully developed fast 2DLC based on a single pair of two judiciously selected RPLC phases for the separation of a number of complex mixtures, including corn seedling extracts (Fig. 4B), coffee (Fig. 5A), red wine (Fig. 5B) and human urine (Fig. 5C). Samples derived from proteomic [12,13] and metabolomic [14,15] research represent two of the more complex but common types of samples which require multi-dimensional liquid chromatography for the successful resolution of a large number of constituents. Proteomics is the large-scale study of proteins as expressed in biological systems. Metabolomics is the study of the low molecular weight compounds present in organisms which participate in the metabolism required for growth, maintenance and normal functioning. Typically proteomic and metabolomic samples contain thousands of constituents whose concentrations are widely different [12-15]. Fig. 6 and 7 illustrate some possibilities of what can be learned when a single 1DLC peak was subjected to a second very different separation mechanism. Fig. 6 shows the limited resolving power of a 1D-separation, wherein one peak in the first dimension produced nine peaks in the second dimension. Fig. 6 shows the serious dynamic range problem wherein the peaks of low abundance species are obscured in the 1D-separation by a single dominant peak of much higher concentration in the 1D-separation. We will refer to this as the “dynamic range problem” in this review. In both cases, the separation requires high resolving power, that is, in chromatographic terms both problems require high peak capacities.
Table 1.
Major reviews of 2DGC, 2DLC and other two-dimensional separations.
| Year | Main Author(s) | Title | Topical Description | Number of refs. | Ref. | |
|---|---|---|---|---|---|---|
| 2DGC | 2006 | M. Adahchour, J. Beens, et al. | Recent developments in comprehensive two - dimensional gas chromatography (GC × GC). Introduction and instrumental set-up. | Introduction and instrumentation | 280 | [16] |
| 2006 | M. Adahchour, J. Beens, et al. | Recent developments in comprehensive two - dimensional gas chromatography (GC × GC). II. Modulation and detection. | Sampling and detection | 280 | [17] | |
| 2006 | M. Adahchour, J. Beens, et al. | Recent developments in comprehensive two - dimensional gas chromatography (GC × GC). III. Applications for petrochemicals and organohalogens. | Application | 280 | [18] | |
| 2006 | M. Adahchour, J. Beens, et al. | Recent developments in comprehensive two-dimensional gas chromatography (GC × GC) - IV. Further applications, conclusions and perspectives | Application | 280 | [19] | |
| 2005 | J. Beens, et al. | Comprehensive two-dimensional gas chromatography-a powerful and versatile technique. | Application | 27 | [20] | |
| 2002 | P.J. Marriott, et al. | A review of basic concepts in comprehensive two-dimensional gas chromatography. | Theory | 35 | [21] | |
| 2DLC | 2006 | R.A. Shellie, et al. | Comprehensive two-dimensional liquid chromatography. | Instrumentation | 36 | [22] |
| 2006 | P. Jandera | Column selectivity for two-dimensional liquid chromatography | Theory: orthogonality | 156 | [23] | |
| 2006 | R.A. Shalliker, et al. | Concepts and practice of multidimensional high-performance liquid chromatography. | Theory and application | 88 | [24] | |
| 2004 | J.W. Jorgenson, et al. | Multidimensional LC-LC and LC-CE for high-resolution separations of biological molecules. | Theory and application to biomolecules | 62 | [25] | |
| 2005 | H.J. Issaq, et al. | Multidimensional separation of peptides for effective proteomic analysis | Application: proteomics | 69 | [13] | |
| 2006 | S.P. Dixon, et al. | Comprehensive multi-dimensional liquid chromatographic separation in biomedical and pharmaceutical analysis: a review | Application: biomedical and pharmaceutical | 97 | [26] | |
| Others | 2000 | M.L. Lee, et al. | Comprehensive two-dimensional separations using microcolumns. | Theory | 48 | [27] |
Figure 5.
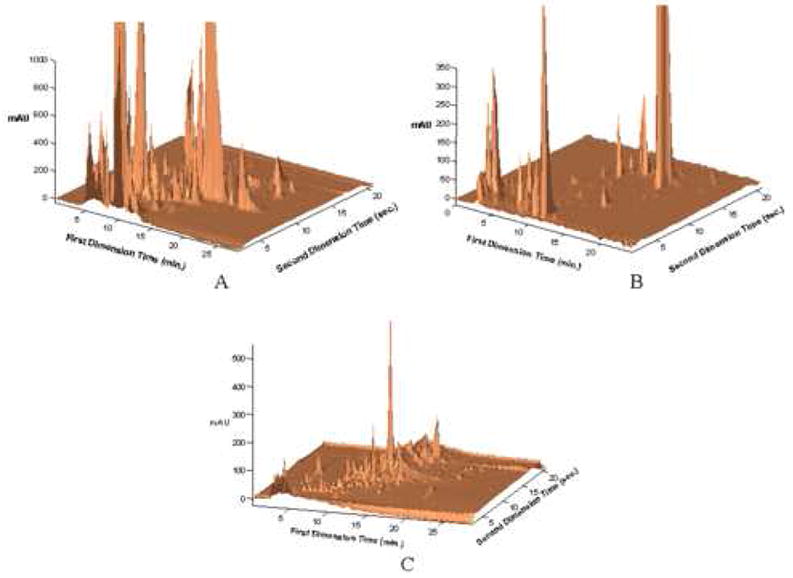
2DLC chromatograms of (A) urine; (B) coffee; (C) red wine. Conditions: Second Dimension – Flow rate, 3.00 mL/min.; Gradient elution from 0-85 %B from 0-21 seconds, where A is 10 mM perchloric acid in water, and B is acetonitrile; injection volume, 34 μL, Temperature, 110 °C, 33 mm × 2.1 mm i.d. ZirChrom-CARB (8% carbon (w/w)). First Dimension-, Urine - Flow rate, 0.10 mL/min.; Gradient elution from 0-50 %B from 0-30 minutes, where A is 20 mM sodium dihydrogen phosphate, 20 mM sodium perchlorate, pH 5.7, and B is acetonitrile ; injection volume, 20 μL, Temperature, 35 °C, 200 mm × 2.1 mm i.d. Discovery HS-F5; Coffee - Flow rate, 0.10 mL/min.; Gradient elution from 0-40 %B from 0-30 minutes, where A is 20 mM sodium dihydrogen phosphate, 20 mM sodium perchlorate, pH 5.7, and B is acetonitrile ; injection volume, 20 μL, Temperature, 35 °C, 100 mm × 2.1 mm i.d. Discovery HS-F5; Red Wine - Flow rate, 0.10 mL/min.; Gradient elution from 0-50 %B from 0-23 minutes, where A is 20 mM sodium dihydrogen phosphate, 20 mM sodium perchlorate, 0.2 mM EDTA, pH 5.7, and B is acetonitrile ; injection volume, 20 μL, Temperature, 35 °C, 100 mm × 2.1 mm i.d. Discovery HS-F5. From ref. [11].
Figure 6.
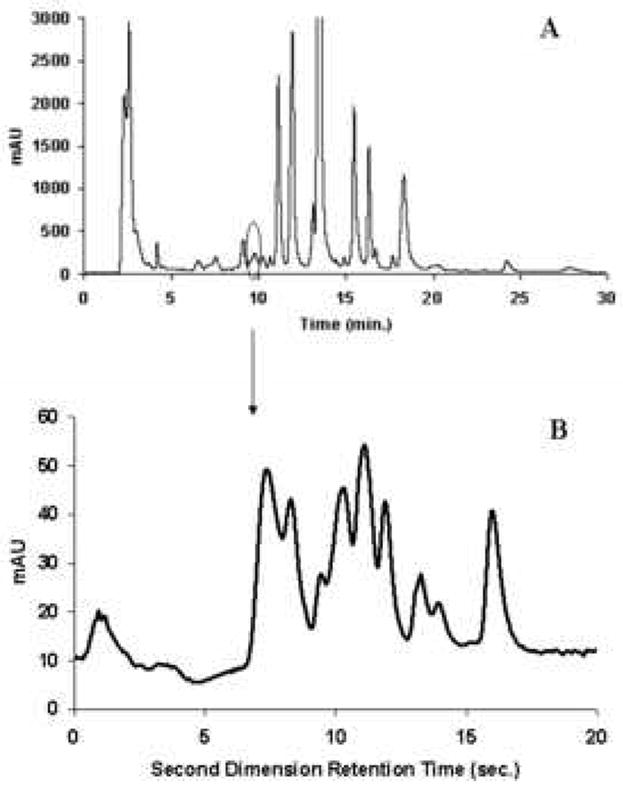
First (A) and second (B) dimension chromatograms of corn seedling separation in Fig. 4A, where the second dimension chromatogram is obtained from 9.80-10.15 min in the first dimension From ref. [10].
Figure 7.
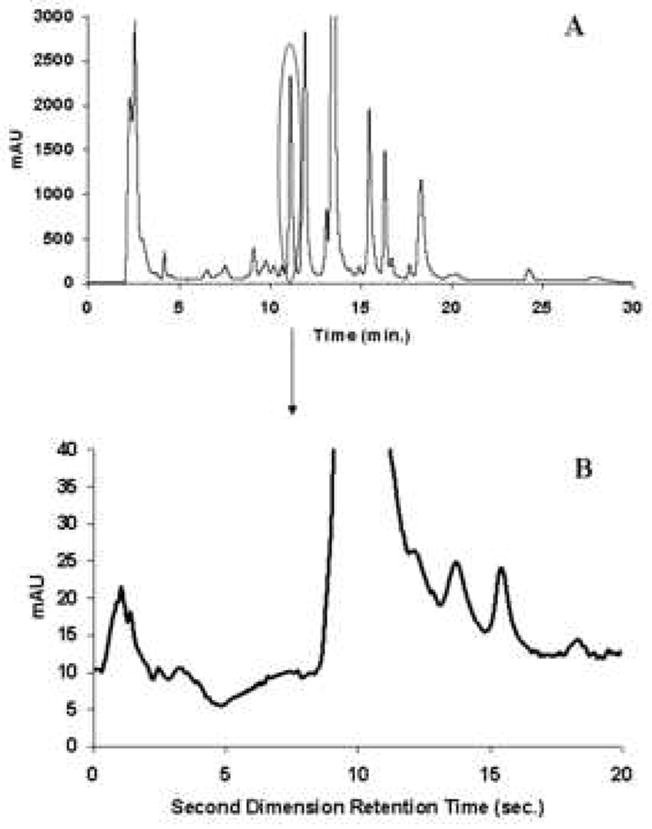
First and second dimension chromatograms of corn seedling separation in Fig. 4A, where the second dimension chromatogram is obtained from 11.55-11.90 min in the first dimension. From ref. [10].
1.2 Scope of 2DLC as an Analytical Tool
The capabilities of different variations of the liquid chromatography technique range quite widely from dealing with very simple samples containing a few unique chemical constituents, to very complex samples containing literally thousands of constituents. The ability to deal with increasingly complex samples invariably comes at the cost of increased analysis times. Fig. 8 shows the historical view of the role of 2DLC relative to other modes of LC including isocratic and gradient elution 1DLC; indeed, until very recently 2DLC has been a niche technique accessible to only a handful of research laboratories. Fig. 8 also indicates a number of ways that fundamental research to improve the performance of LC separations has impacted the scope of different modes of LC. The general trend has been to improve existing modes of LC to handle increasingly complex samples in less and less analysis time.
Figure 8.
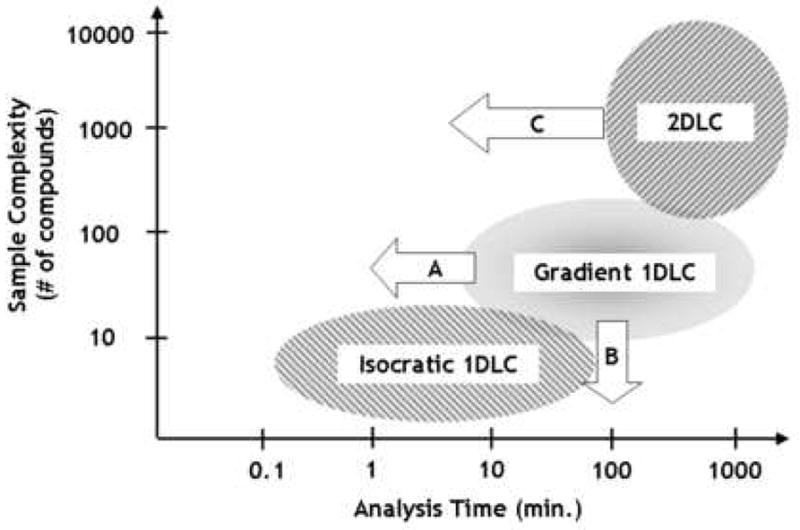
Domain of various LC modes as a function of sample complexity and analysis time. The elipses indicate the historical domains of the different modes; the arrows indicate changes in the perceived limits of these domains as a result of recent fundamental research in these areas.
A few areas of improvement are worth mentioning here. Schellinger and coworkers [28] studied the factors limiting the speed of gradient elution 1DLC and found that the historical view that column sets the re-equilibration time and thus the speed of gradient elution 1DLC is misguided, and that in most cases the design of instruments used for these separations is the biggest limiting factor. This finding has resulted in a significant reduction in the limiting analysis time of gradient elution 1DLC, as indicated by arrow ‘A’ in Fig. 8; this trend will likely continue to even shorter times.
The improvement in the speed of gradient elution 1DLC discussed above has also led to a systematic comparison of the performance of gradient vs. isocratic elution 1DLC for the analysis of rather simple samples [29]. It was found that gradient elution 1DLC can be very effective in the analysis of mixtures containing less than ten chemical constituents; historically this type of mixture has been thought to be best separated using isocratic elution. This change in mindset is represented by arrow ‘B’ in Fig. 8.
The advances in the speed and performance of gradient elution 1DLC discussed above have contributed considerably to the improvement of the speed of 2DLC when gradient elution is performed in both dimensions, as in our own work [10]. This improvement in the speed of 2DLC without sacrificing resolving power is represented by arrow ‘C’ in Fig. 8. We also expect this trend to continue in parallel with the continually improving performance of 1DLC methods.
1.3 2DGC
Two-dimensional gas chromatography (2DGC) has a much longer history than 2DLC and provides the basis for many insights relevant to 2DLC. The reader is referred to an excellent recent review for more detailed discussions of various aspects of the technique [16-19]. The technique was invented by John Phillips over a decade ago [30,31]. A clear review of 2DGC’s history and development will help us obtain a better picture of 2DLC’s present status and perhaps guide its future development. 2DGC has been successful in handling complex mixtures of volatile compounds, such as pesticides [32], petroleum derived materials [33], and environmental samples [34]. There are several requirements which much be met to achieve a successful separation. First, as for almost any hyphenated technique, the second dimension has to be fast. This requirement for much faster separation of the second dimension than the first was realized in 2DGC a relatively long time ago. Fortunately, high speed gas chromatography has been well-known for many years and is relatively easier to implement in GC than in LC from both theoretical and practical perspectives. Phillips’s cryogenic modulation technique enables fast cooling and heating during sample transfer from the first to the second dimension [35]. The way in which each second dimension separation is carried out in 2DGC (see section 3.2.3 for a detailed discussion and comparison to 2DLC) does not require thermal re-equilibration between successive runs. This is an inherent advantage in terms of the speed of 2DGC over 2DLC in those cases where gradient elution is used in each second dimension LC separation; this comprises a majority of 2DLC separations using RPLC in the second dimension (see section 3.2.2). Unlike liquid chromatography, the flow velocity in gas chromatography is not limited by pressure; furthermore diffusion and hence inter-phase mass transfer are much faster in GC than in LC. It is not difficult to generate peaks which are significantly less than one second wide in GC; peak widths of only tens of milliseconds have been achieved with fast temperature gradients and short columns [36].
Second, the requirement of retention “orthogonality” between the first and second dimension separations and maximal usage of the “separation space” to achieve the highest possible “conditional peak capacity” [37] are easily accomplished in 2DGC. It must be realized that dispersion (London) interactions are the dominant type of interaction in all forms of gas-liquid partition chromatography [38] and as a consequence of this fact log k’ vs. log k’ plots for any two GC columns are inherently rather strongly correlated for two columns as different as a permethylsilicone and Carbowax (Fig. 9), even for a highly variegated set of probe solutes [38]. Phillips et al. [39] showed that to create orthogonality in GC, some factor that controls selectivity of the second dimension column must be readily tunable. For gas chromatography, temperature tuning is easily achieved [39] and serves as an effective method for creating an “orthogonal” separation. As shown in Fig. 10, excellent orthogonality and coverage can be achieved in 2DGC. The fact that a high degree of orthogonality can be produced in GC suggests that 2DLC might be feasible with two reversed-phase columns. Typically 2DLC has been done by combining very different modes of LC such as ion exchange and reversed-phase or size exclusion and reversed-phase. The third requirement involves fast detection and data handling. More details on these basic requirements are given below.
Figure 9.
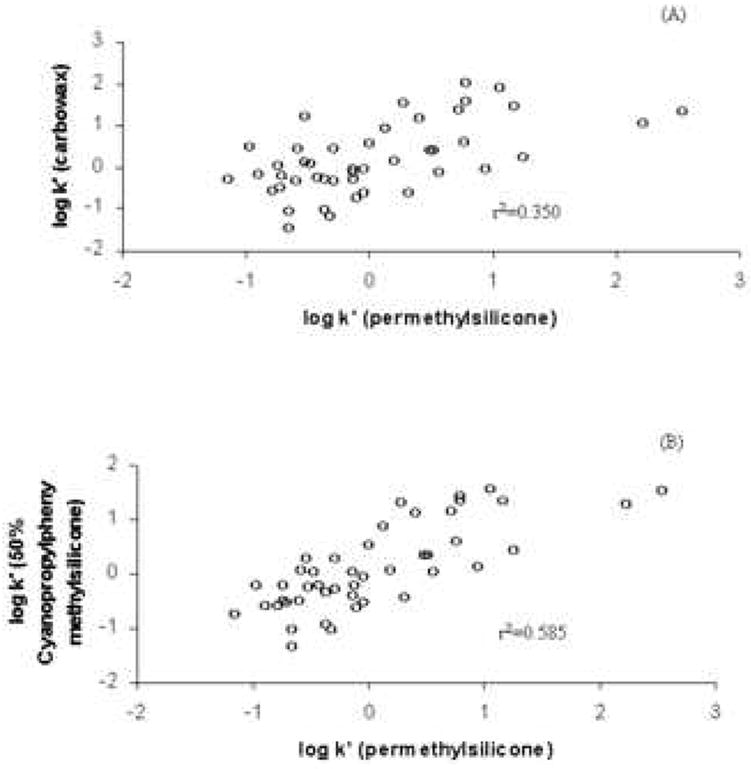
(A) Plot of log k’ vs. log k’ of carbowax and permethylsilicone phases, (B) Plot of log k’ vs. log k’ of 50% cyanopropylphenyl methylsilicone and permethylsilicone phases. Both show a significant lack of orthogonality. Data re-plotted from ref. [38].
Figure 10.
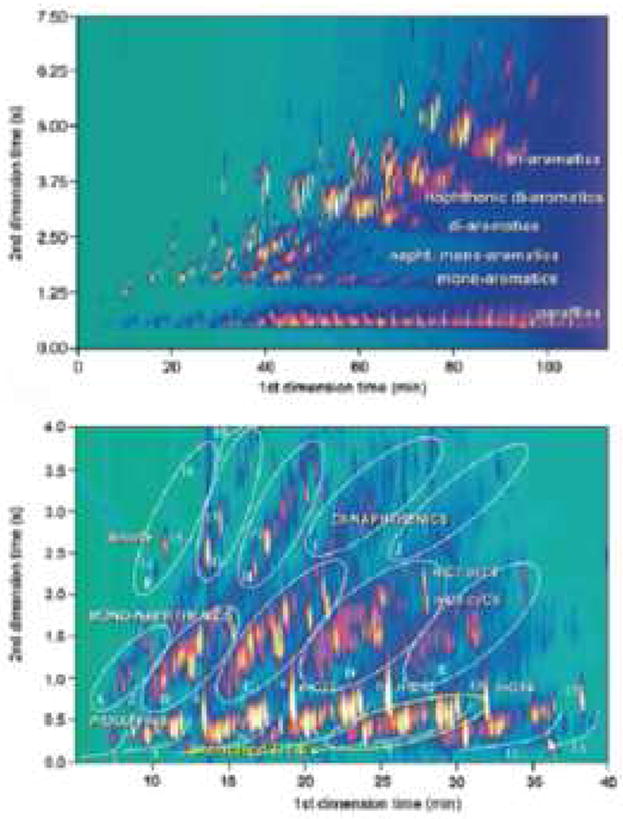
2DGC chromatogram of a light cycle oil using a (25 m × 0.25 mm DB-1) × (1.5 m × 0.1 mm OV-1701) column combination (top), and a non-aromatic hydrocarbon solvent using a (10 m × 0.25 mm CP Sil-2 CB) × (2.5 m × 0.1 mm BPX-50) column combination (bottom). 1 through 13: alkanes; 1: branched C10s; 2: n-C10, 3: branched C11s; 4: n-C11, 5: branched C12s; 6: n-C12; 7: branched C13s; 8: n-C13; 9: branched C14s; 10: n-C14; 11: branched C15s; 12: n-C15; 13: branched C16s; 14: unknown; 15: trans-decalin; 16: cis-decalin;17: trans-methyl-decalins; 18: cis-methyl-decalins; A through E: mono-naphthenes C10 through C14; F through J: di-naphthenes C10 through C13. From ref. [40].
2. THEORETICAL BACKGROUND FOR MULTI-DIMENSIONAL CHROMATOGRAPHY
2.1 The Need for High Peak Capacity and the Theory of Statistical Model of Peak Overlap (SMO)
The well known Davis-Giddings Statistical Model of Overlap (SMO) [41] provides the theoretical basis for the absolute necessity of two dimensional separations when dealing with multi-constituent mixtures. This theory suggests that one-dimensional chromatography is frequently ineffective and usually has too low a peak capacity for dealing with complex, multi-constituent mixtures; two-dimensional chromatography is a powerful technique which can generate peak capacities that are roughly an order of magnitude higher than 1D separations given sufficient analysis times (data not shown).
The key milestones in the development of SMO theory are summarized in Table 2. This theory was first developed by Davis and Giddings [41] using Poisson statistics as the basis for the random distribution of retention times across the chromatogram to approximate the behavior of peaks in a “real” chromatogram. Davis and Samuel [42] argued that the peak capacity of 1D separations is woefully inadequate for the separation of complex mixtures in a comparison of predictions of the numbers of observable peaks to the numbers of observed peaks in simulated gas chromatograms of a variety of mixtures (i.e., PCB’s, PAH’s, fragrances, etc.) A simplified interpretation of their model for 1D separations (the reader is referred to ref. [42] for a more detailed discussion) which is adequate for the purpose of this discussion shows that on average the maximum fraction of the total peak capacity that can be manifested as chromatographic peaks is only 37%. A peak is simply a maximum in the signal and is comprised of the detector response to one or more chemical constituents. Also on average the maximum fraction of the peak capacity that will be observed as pure, single constituent peaks is only 18%. In other words, in a separation of 100 constituents using a 1D separation having a peak capacity of 100, on average the maximum number of peaks that will be seen is just 37. For samples containing much more than about 10-20 constituents, the predictions of the SMO lead to the analytically dreadful conclusion that many of the observed peaks in a given chromatogram will be comprised of two or more overlapping single-constituent peaks. Later work on the peak overlap problem by Guiochon [43] produced a model of overlap that accounted for the boundary condition that peaks cannot overlap at the edges of the chromatographic separation space. This effect is trivial for high peak capacity separations of large numbers of constituents. A significant aspect of Guiochon’s work is that it is better able to deal with highly saturated chromatograms (i.e., when the number of constituents in the sample exceeds the peak capacity of the method) than the early models of Davis. Later work by Davis corrected his original model of overlap in one-dimensional separations [44] to more accurately predict the number of observed peaks in highly saturated chromatograms.
Table 2.
SMO Theory development
| Key papers | Main points | Ref. |
|---|---|---|
| Davis, Giddings (1983) | Original SMO theory developed using Poisson statistics with random distribution of peak position | [41] |
| Nagels, Creten, Heverbeke (1985) | Random distribution of peak height considered, difficulty of good analysis in complex mixtures addressed | [46] |
| Martin, Herman, Guiochon (1986) | New model for peak overlap problem, takes into account the probability distributions of resolvable peaks and limited number of constituents | [43] |
| Davis, (1997) | Extension of 1D model to handle highly saturated chromatograms | [44] |
| Davis, (2000) | Test of 1D model by application to GC separations of several mixtures | [51] |
| Davis, (2005) | Extension of 2D model to account for edge effects and separations of variable aspect ratio | [49] |
| Davis, (2006) | Extension of 2D model to handle highly saturated chromatograms | [50] |
| Davis, (1994) | Review of SMO Theory | [53] |
Nagels and coworkers [45-47] carried out a very important analytically relevant series of studies of the effect of random placement of species whose relative amounts were distributed over a wide range in concentration on the ability to obtain accurate analysis based on apparent peak size. In order to simulate a real system they used a model of the size distribution based on experimental data from the separation of plant extracts. Not surprisingly but very importantly their results show that as the range in concentrations was increased, the peak capacity required to obtain accurate analyses increased substantially. Given that in some biological samples the range in concentration can exceed nine or ten orders of magnitude [15], this effect is extremely important.
SMO theory makes it clear that extremely high peak capacities are needed to separate complex samples containing hundreds to thousands of constituents. It is extremely difficult with current 1DLC technology (i.e., 600 bar pressure limit) to generate peak capacities above 500 for peptide mixtures [37] in a reasonable period of time, say 30-60 minutes, and even less peak capacity can be generated for small non-peptide molecules (typically, 200-300). Table 3 compares the 1D peak capacities generated in some recent studies which were aimed at maximizing peak capacity. Clearly 1D peak capacities in excess of 500 are rare and take a great deal of time to develop. We will return to the issue of 1D peak capacity and the difficulty in getting higher values in more detail in a later section. The limitations implied by SMO theory strongly motivate the need for two dimensional separations to generate even higher peak capacities.
Table 3.
Comparison of peak capacities in gradient elution one-dimensional liquid chromatography.
| Method | nc**a | tG (min) | ΔP (MPa) | Peak Width Based On | nc**/tGb | nc **/ΔPc | nc**/(tGΔP)d | |
|---|---|---|---|---|---|---|---|---|
| Carr 2006e | High temperature | 500 | 120 | 32 | Selected averagef | 4.2 | 15.8 | 7.9 |
| Carr 2006e | High temperature | 440 | 120 | 32 | Averageg | 3.7 | 13.8 | 6.9 |
| Carr 2006e | High temperature | 470 | 120 | 32 | Medianh | 3.9 | 14.6 | 7.3 |
| Carr 2006e | High temperature | 1100 | 120 | 32 | Narrowesti | 9.5 | 35.7 | 17.9 |
| Jorgenson 2003j | High pressure | 500 | 170 | 360 | Averageg | 2.9 | 1.4 | 0.5 |
| Smith 2002k | High pressure | 1100 | 200 | 70 | Singlel | 5.5 | 15.7 | 4.7 |
| Smith 2005m | High pressure | 1500 | 2000 | 140 | Averageg | 0.8 | 10.7 | 0.3 |
| Smith 2005n | Monolith | 420 | 260 | 35 | Singlel | 1.6 | 12.0 | 2.8 |
Peak capacity (see section 2.4).
Peak capacity per unit time (peak per minute).
Peak capacity per unit pressure (peak per MPa).
Peak capacity per unit time per unit pressure (peak per hour MPa).
Results reported in [37] by using 60 cm long column with 5 μm pellicular particles.
Peak width is calculated using the average value of 30 selected peaks.
Peak width is calculated using the average value of all integrated peaks.
Peak width is calculated using the median value of all integrated peaks.
Peak width is calculated using the narrowest value of all integrated peaks.
Results reported by Jorgenson et al. [54] by using 38 cm long column with 1 μm nonporous porous particles.
Results reported by Smith et al. [55] by using 87 cm long column with 3 μm fully porous particles.
Peak width is calculated using the peak width of a single peak.
Results reported by Smith et al. [56] by using 200 cm long column with 3 μm fully porous particles.
Results reported by Smith et al. [57] by using 70 cm long silica monolith column.
Relative to 1D separations the prediction of the number of observable peaks in 2D separations is complicated by the fact that the ratio of the peak widths, i.e., the aspect ratio, in the direction of the two axes of the separation has a significant effect on the effectiveness of 2D separations in producing peaks at a given peak capacity and number of constituents. An initial model of overlap in 2D separations was introduced by Davis in 1991 [48] and subsequently corrected to deal with: 1) edge effects [49], 2) separations having high aspect ratios [49], and 3) highly saturated 2D separations [50].
At various points in the development of Davis’ model of overlap, the theory has been tested through analysis of experimental chromatograms. The most recent of these tests used the most refined 1D model in predicting numbers of observable peaks in gas chromatograms of a variety of mixtures of organic compounds on two different stationary phases. Good agreement was observed between the numbers of peaks observed by experiment and predicted from SMO theory based on the known number of constituents in each mixture [51].
Finally, as a word of caution we would like to point out that peak overlap theory predicts that 2D separations are less effective at producing peaks in complex separations on a per unit peak capacity basis than 1D separations [52]. Unfortunately the magnitude of the difference in effectiveness of 1D and 2D separations is non-linear and depends heavily upon how the crowded the chromatograms are. From a practical perspective this means that the performances of 1D and 2D separations should be compared not only on a peak capacity basis, but also by the number of peaks observed in experimental chromatograms, unless then number of constituents in the sample of interest is known.
2.2 The Murphy-Schure-Foley Criterion
A major theoretical consideration for realizing the ideal 2D peak capacity in comes from the seminal work of Murphy, Schure and Foley (M-S-F) [58] which tells us how often the first dimension effluent must be sampled so that the resolution gained in the first dimension is not partially lost due to the sampling process which needed to do the second dimension separation. The most significant practical consequence of their work is that the effluent must be sampled at least three or four times over the 8σ width of a first dimension peak to avoid significant loss of 2D resolution between a pair of peaks when the first dimension separation contributes heavily to the overall resolution. We refer to this guideline as the M-S-F sampling criterion. Note this is a very reasonable result. For two peaks that are separated in the first dimension with a Rs = 1 it is more or less equivalent to the Nyquist sampling criteria of Fourier signal reproduction [59]. Even at this sampling rate some peak capacity is lost.
The work of Murphy et al. was extended by Seeley [60], who studied the undersampling problem in situations where the duty cycle of the sample acquisition device is less than 100%; that is, in those cases where the fraction of constituents transferred from the first to the second dimension is consistent in time, but less than 100%. Seeley’s results for the 100% duty cycle case fully corroborated the initial findings of Murphy et al.
It is perhaps best to think of a two dimensional separation as a three step process. These steps are shown in the block diagram of Fig. 1. The first step is the first dimension separation, the second is the “sampling” of the first dimension and the third is the second dimension separation. Each of these operations contributes to the overall 2D resolution. Choosing the proper sampling time is a major decision that must be made in designing a comprehensive 2DLC separation method. We believe that not nearly enough thought has been put into this issue despite the fact that Murphy et al. [58] and others [60,61] have studied the issue in some detail. As will become clear there are tremendous interactions between the operational variables in the two dimensions, especially in 2DLC. Furthermore, the peak capacity in gradient elution LC depends very strongly on the experimental conditions, especially gradient time. The gradient time of the second dimension separation cannot exceed the sampling interval of the first dimension separation unless one uses a set of parallel second dimension columns. This limitation was included in the considerations in the M-S-F paper. In their study they used the resolution (Rs) of a single pair of peaks as the key metric of performance to measure the effect of the first dimension sampling rate on the quality of the 2DLC separation. Rs is defined and easily calculated as:
| (2) |
where P is the peak to valley ratio, defined as f/g and shown in Fig. 11. For neighboring constituents of equal concentration, a Rs of 0.5 is required to observe a valley between the adjacent peak maxima. However, in separations of real mixtures, the average Rs required to observe a valley between two adjacent peak maxima is on the order of 0.7-0.8 [50] because of the large range in constituent concentrations which have been found to be approximately exponentially distributed in some real samples [45,62-64].
Figure 11.
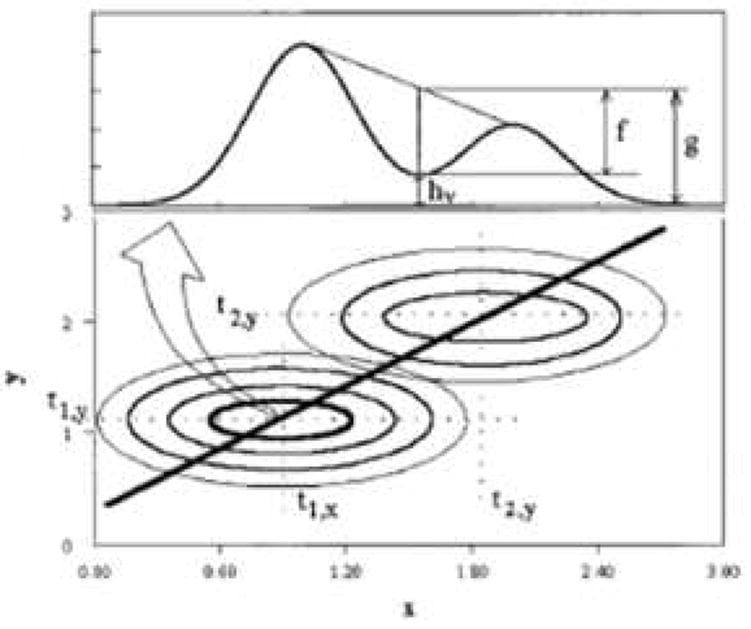
Schematic representation of the two-dimensional resolution measurement using a 2D contour (bottom) and the corresponding slice for resolution determination. From ref. [58].
M-S-F used Giddings’ approximation that the resolution of a pair of peaks in the two dimensional space (x,y) is related to the resolution on the first and second dimensions as the Pythagorean average:
| (3) |
This is an immensely important result as far as thinking about how fast the first dimension must be sampled. The reader should understand that a 2D chromatogram is simply a way of displaying a lengthy series (perhaps as many as 50 to 100) of sequential chromatograms obtained on the second column. This concept is well conveyed in the excellent figure (see Fig. 12) from Part I of the recent review of 2DGC by Adahchour et al. [16], which clearly shows the sequential nature of the second dimension chromatograms and the way the information can be restructured into various representations of a 2D chromatogram. As mentioned above (see Fig. 1) the combination of the second column and detector can be most simply considered as just a unique type of chemically selective detector of what comes out of the first column. The peak widths observed on the second column will be completely independent of the sampling time used in the first dimension as long as the second column is not overloaded by sample mass or sample volume.
Figure 12.
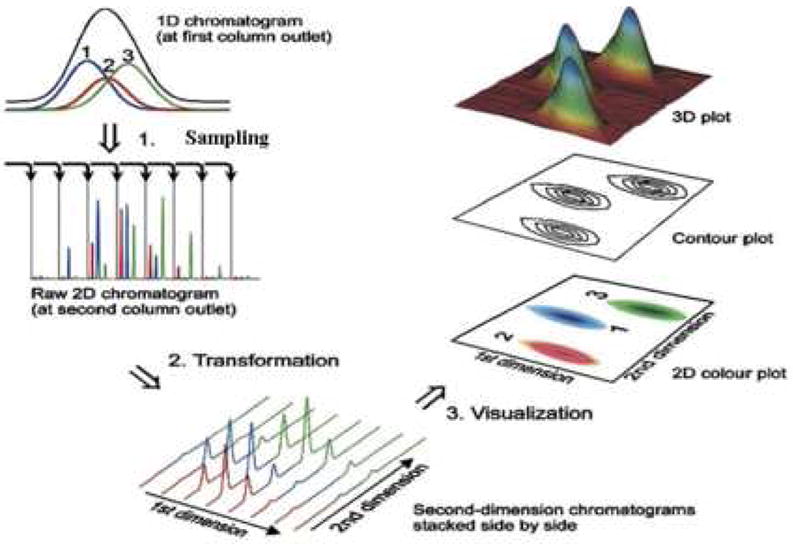
Diagram of the flow of information as it is collected and analyzed in a comprehensive 2D separation experiment. Step 1 shows that the collection and transfer of aliquots of first dimension column effluent and subsequent separation in the second dimension column produces a series of sequential second dimension chromatograms collected as one string of data. Steps 2 and 3 show how the sequential second dimension chromatograms can be reshaped to produce a variety of different representations of the 2D chromatogram. Adapted from ref. [16].
Let’s suppose that a two constituent mixture which is completely unresolved on the first column is injected into the second column which, due to its very different selectivity, does a superb job of separating the two analytes. In this case Rs,2D is dominated by Rs,y and thus Rs,2D will be essentially independent of the first dimension sampling rate. Now consider the opposite extreme. Suppose the same mixture is only partially separated on the first dimension, say Rs,x = 0.8, but that the two analytes completely co-elute on the second dimension. Here Rs,y is zero and Rs,2D will be dominated by Rs,x. Rs,2D will now depend very strongly on the sampling rate. As M-S-F showed even if the inherent peak widths of the first dimension are quite narrow the effective width of these peaks as they enter the second dimension will depend on the sampling time unless the sampling time is rather less than the inherent peak width of the first dimension peak. Consider, as shown in Fig. 13, the series of second dimension chromatograms resulting from increasing the sampling time from 30 seconds (corresponding to 4 samples across the 8σ width of the peak) to 120 seconds (corresponding to 1 sample across the 8σ peak width). We note that the resolution of the two right most peaks is initially so poor that only a single peak maximum will be seen in the 2D chromatogram when N = 2 although 2 peaks will be seen when N = 4. Ultimately when N = 1 the initially observed three peaks merge into a single “blob”. This is precisely what Giddings meant when he warned that the resolution gained in the first separation must not be lost when doing the second separation.
Figure 13.
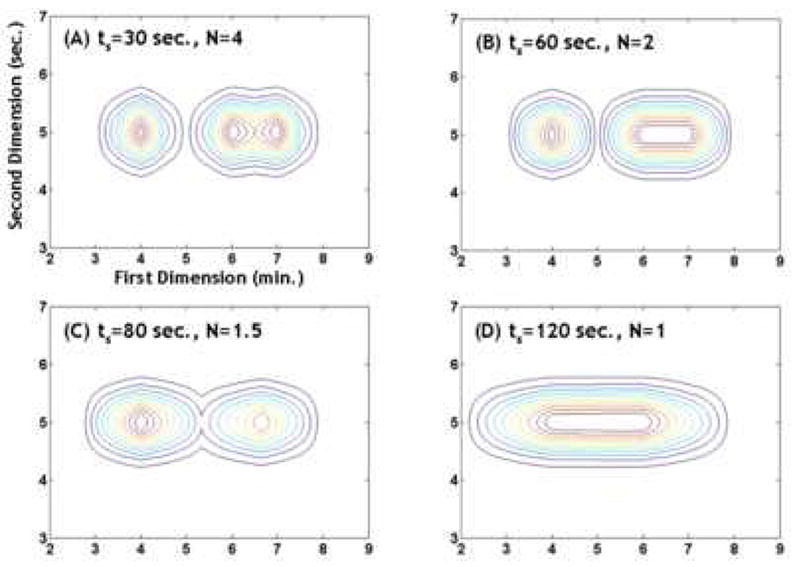
Simulated demonstration of the effect of the first dimension sampling time (ts) on the first dimension peak capacity. Simulated condition: first dimension peak standard deviation before sampling is 0.25 min, second dimension peak standard deviation is 0.25 sec, the first dimension retention times are 4, 6, 7 min, the second dimension retention times are 5, 5, 5 sec, peak heights are uniform. Note that as ts increases one first sees a loss in the more poorly resolved peak and then a loss in the better resolved peak.
As yet we are not fully satisfied with how to properly account for the loss in average 2D peak capacity for realistically positioned peaks that will result from the effect of undersampling; this is currently a focus of some of the authors of this paper [65]. We believe that many reports of huge experimental 2D peak capacities are excessively optimistic on this basis. The effective peak capacity is frequently much lower than the ideal peak capacity.
At this point it is worth re-visiting Fig. 14 which is from Murphy’s 1998 paper [58] to gain a sense of the severity of the sampling broadening effect at different sampling rates. The curve labeled B in Fig. 14 shows the average ratio of the first dimension peak standard deviation before (σ) and after (σs) broadening as a function of the number of samples (N) taken across the 8σ first dimension peak width. When N = 4, σ/σs averages about 1.3, indicating that the sampling process broadens the first dimension peak by 30 %. Further increasing the first dimension sampling rate beyond four samples per 8σ width does not significantly reduce the amount of broadening of the first dimension peaks. When N <= 1, which is more representative of actual range in sampling rates in the 2DLC literature, then σs is about three times σ.
Figure 14.
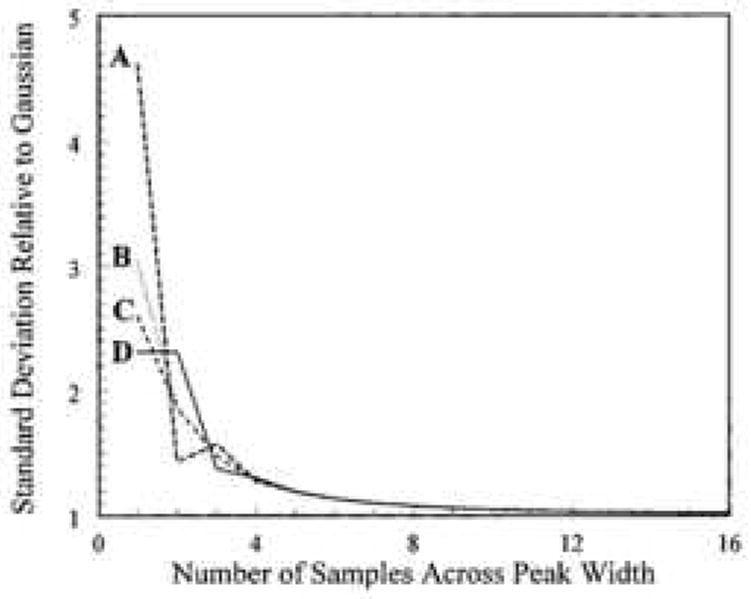
Quantity σs/σ as a function of N. (A) sampling is 4σ/N prior to t0 = t̄ – 4σ; (B) the average σs/σ; (C) sampling is 2σ/N prior to t0 = t̄ – 4σ; (D) sampling is in phase (starts at t0 = t̄ – 4σ). From ref. [58].
When N is less than 4, many authors estimate the first dimension peak capacity by simply counting the number of fractions of first dimension effluent that are delivered to the second dimension during the course of the 2DLC separation. This approach to the calculation of the first dimension peak capacity and the results of Murphy and coworkers are clearly not compatible. In other words, when the sampling time exceeds the first dimension peak width, the first dimension peak capacity cannot possibly be any larger, although it can be less, than the total number of samples of first dimension effluent taken during the course of the 2D separation. In reality the effective first dimension peak capacity must be less than this theoretical maximum, but the simplicity of this estimate serves our purpose well here in showing the deleterious effect of slow sampling in first dimension peak capacity. Fig. 15 shows the sampling limited first dimension peak capacity compared to the ideal first dimension peak capacity estimated for the separation of a diverse mixture of peptides using the method of Wang et al. [66]. These simple calculations using the best available estimates of peak capacity for 1D gradient elution RP separations of peptides show the seriousness of the effect that undersampling the first dimension has on the first dimension peak capacity, and therefore on the total peak capacity of the 2DLC separation. In many papers this has led to overly optimistic conclusions about the performance of 2DLC separations compared to the optimized 1D counterparts.
Figure 15.
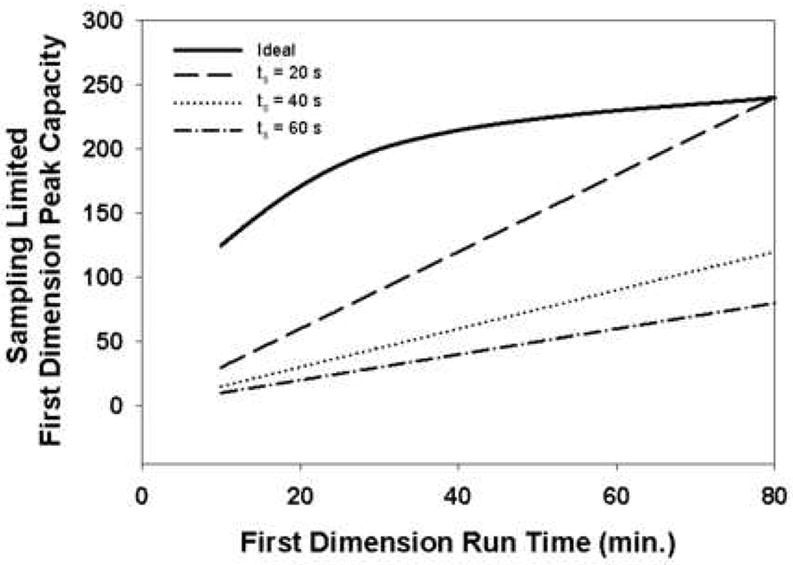
Effect of slow first dimension sampling compared to first dimension peak width on first dimension peak capacity. The ideal first dimension peak capacity (——) is calculated for a diverse mixture of peptides using the method of Wang et al. [66] at 40 °C and assumes no effect of undersampling. The other three curves are calculated by simply dividing the analysis time by the sampling time (ts).
2.3 Degree of Orthogonality and Coverage of the Separation Space
The tremendous interest in 2DLC results from the predicted multiplicative relationship between the peak capacity of the 2D separation and the peak capacities of its constituent 1D separation (see Eq. 1). However, realization of this potential strictly requires that the retention mechanisms of the two separation dimensions be completely uncorrelated. Achieving this condition has been extremely rare in practice, Giddings [2] described in great detail how nc,2D effectively ranges from a maximum of 1nc × 2nc down to a minimum of 1nc depending on the extent of correlation between the two retention mechanisms. The practical consequence of this fact is that if a 2D separation is conducted in such a way that a high correlation exists between the retention times of analytes in the two separation dimensions, the full potential that is promised by Eq. 1 is not fully realized, and the analyst might just as well be met by doing an optimized 1D separation instead of wasting time with a poorly executed 2D separation.
In a later theoretical work Giddings [67], introduced the “sample dimensionality” concept which has significant implications for the design of multi-dimensional separation systems. The basic idea is that the retentions of analytes in a particular sample arise from a linear combination of discrete solute dependent factors which he calls ‘dimensions’ of the sample. For example, the retentions of a homologous series of alkylbenzenes are dominated by one primary factor, namely carbon number, and we say that such a sample is uni-dimensional. On the other hand, a mixture of peptides has at least two dominant dimensions, molecular size (volume or surface area) which correlates very strongly with hydrophobicity and net charge. Giddings then states that increasing the dimensionality of a separation system (i.e., moving from 1D RPLC to 2D IEC × RPLC) can only result in increased resolving power if the sample dimensionality is greater than or equal to the dimensionality of the separation system and the separation system is sensitive to the various constituents of the samples dimensionality. For example, it would be a complete waste of effort to subject a mixture of alkylbenzene homologs to separation by a 2DLC system using IEC and RPLC because this sample is uni-dimensional; only the RPLC dimension of the separation will provide selectivity, while the IEC dimension adds nothing at all. On the other hand, if we consider again the mixture of tryptic peptides which we know to vary in at least two sample dimensions this sample is very well suited to analysis by a 2DLC IEC × RPLC system because both the sample and the separation have at least two dominant and complementary dimensions. While the practical application of this concept becomes more difficult as sample complexity increases, it does provide a useful conceptual framework to guide the efficient development of multi-dimensional separation systems.
Several approaches have been taken to quantify the extent of correlation between the actual retentions of analytes in the two dimensions of various 2DLC systems as a means of assessing the amount of deviation from the ideal 2D peak capacity. Two recent reviews [22,24] have covered some of these in detail, so we will only briefly mention them here. Liu and coworkers [68] used a highly geometric approach along with factor analysis of observed retention patterns to describe the coverage of the separation space and calculate a ‘practical peak capacity’, accounting for the fraction of the separation space that is used.
It is unfortunate that the word “correlation” was used in this context originally by Giddings because many workers have attempted to use the mathematical correlation coefficient as a means of measuring the degree of departure from the ideal 2D peak capacity. In our view what really matters is not the correlation coefficient but the fraction of the 2D separation space (area), which is occupied by chromatographic peaks. The simple example in Fig. 16 shows that the correlation coefficient is not an appropriate predictor of the fraction of the separation space that is actually occupied by peaks. It is possible to have a very low correlation coefficient with only a small fraction of the separation space occupied by peaks (panel B). The desired situation is shown in panel A where the entire separation space is occupied by peaks; in this instance there also happens to be a low correlation coefficient.
Figure 16.
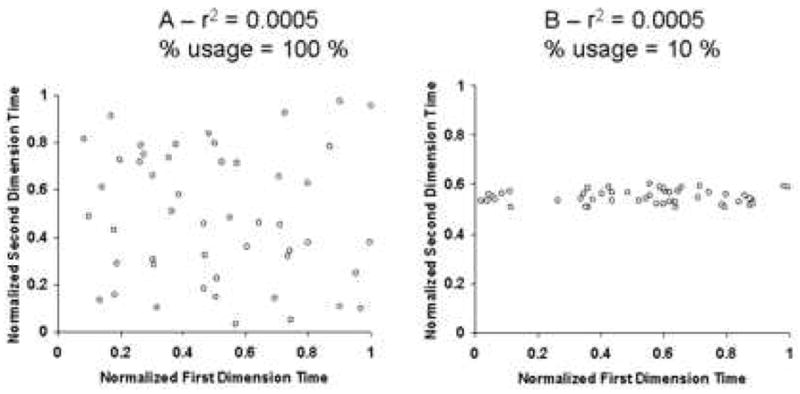
Demonstration of the weakness of the correlation coefficient as a metric of separation space utilization in 2DLC systems.
Recognizing the inadequacy of the correlation coefficient in this context several groups have discussed other approaches to calculating the fraction of the 2D separation space that is occupied by peaks. Slonecker and coworkers [69,70] have used information theory to describe the predicted distribution of constituents across the separation spaces of a variety of projected 2D separations based on 1D separation data. More recently, Gilar and coworkers [71] hit upon a simple but very effective approach which amounts to casting a grid onto the separation space and then determining the fraction of the bins that contain peaks (see Fig. 17). This fraction allows subsequent corrections to the ideal 2D peak capacity computed from Eq. 1. A similar approach has been discussed in the context of 2DGC, although much more qualitatively, by Ryan and coworkers [72].
Figure 17.

The geometric orthogonality concept. Hypothetical separation of 100 analytes in a 10 × 10 normalized separation space. (A) Nonorthogonal system, 10% area coverage represents 0% orthogonality. (B) Hypothetical ordered system, full area coverage. (C) Random, ideally orthogonal, system, area coverage is 63% representing the 100% orthogonality. From ref. [73].
The majority of studies concerned with the utilization of the 2D separation space have focused on the effect of separation mode (e.g., reversed-phase, ion-exchange, hydrophilic interaction, size exclusion) [24,69,73,74] or type of stationary phase within a given separation mode (e.g. amide vs. C18 in reversed-phase mode) [75]. While the organic composition of the eluent [76] is sometimes thought to be the most influential factor in controlling retention in RPLC it is now known that changing the stationary phase produces the largest changes in selectivity at least for non-ionic species [77]. However, the effects of changing the mobile phase chemistry and pH have been shown to be very powerful for separating cationic solutes in RPLC [73].
2.4 Peak Capacity in One-Dimensional Separations
The peak capacity depends strongly on whether one does an isocratic or a gradient elution separation. There is no doubt that in 1DLC gradient elution, when it can be applied, gives much better peak capacity. Attempts to understand the peak capacity of 2DLC and how it can be enhanced require a thorough understanding of the factors that control peak capacity in gradient elution 1DLC. Peak capacity is a very useful and commonly used metric of resolving power. It was first introduced by Giddings in 1967 [78] and was defined as “the maximum number of separated peaks that can be fit (with adjacent peaks at some specified resolution value taken as 1.0 in all equations below) into the path length or space provided by the separation method” [79]. In isocratic/isothermal chromatography, Giddings showed that peak capacity (nc), for the case that R = 1, can be expressed as [78]:
| (4) |
where N is the plate number, t1 and tn are the retention times of the first and the last peak (not the dead time and some arbitrary upper limit), respectively. Horvath and Lipsky [80] extended Giddings’ work to temperature programmed GC and gradient elution LC. They gave the following expression for the corresponding peak capacity based on the assumption that all peaks have the same width and that the resolution is unity:
| (5) |
Due to the logarithmic dependence in Eq. 4, peak capacities obtained under isocratic conditions are substantially lower than those obtained under gradient conditions (see Eq. 5) with the same analysis time [81]. Therefore, gradient elution is almost exclusively used for the analysis of very complex samples, in which high peak capacities are needed.
Grushka [82] showed that the increment in peak capacity (for Rs = 1.0) during an infinitesimal time increment is given by:
| (6) |
where 4σ is the peak base width at time t. By integrating Eq. 5 assuming that σ. is independent of retention time, as is approximately true in gradient elution [83,84], Grushka derived Eq. 7:
| (7) |
where W is the fixed peak width (4σ). However, in contrast to others Grushka arbitrarily chose to define tA as the column dead time and tn as the retention time of the last peak. By his use of tA, not the time of the first peak as per Giddings, it is evident that Grushka modified the peak capacity concept although he did not comment on the difference between his equation and Giddings’.
Since the time in which a solute can elute under gradient conditions actually extends from t0 to t0 + tD + tG (t0 is the column dead time including extra-column volume, tD is the dwell time and tG is the gradient time), Snyder [85], in contrast to Giddings and Horvath, approximated the time window as tG, assuming that tD was negligible, and thus computed the maximum possible peak capacity as:
| (8) |
However, realizing that a real sample generally occupies only a fraction of the maximum possible time window (tG), Snyder [85] returned to the use of a time window based on the first real and last real peak as initially formulated by Giddings and Horvath and then went on to define what he termed a “sample peak capacity” (nc**):
| (9) |
where tR,n and tR,1 are the same as tn and t1 in Eq. 4 and 5, respectively. Clearly, tG is the maximum possible time window that a real sample can occupy. Therefore, the peak capacity calculated from Eq. 8 is a hypothetical maximum possible peak capacity; it is always larger than the peak capacity calculated from Eq. 9.
In one-dimensional separations, even the highest peak capacities reported (400 – 1000, see Table 3) [54,55,86,87] compare poorly to the number of constituents in many biological samples (e.g. ≫ 1000). As a result, only a small fraction of the observed peaks contain a single analyte. In this context, the Davis-Giddings statistical theory of overlap [41] makes it clear that one must increase the peak capacity to decrease the degree of peak overlap. In addition, the resolution of the worst resolved solute pair is not of interest; instead, the average resolution (Rs,avg) of all adjacent solute pairs is the key metric for the optimization [37,66].
In practice, the peak capacity calculated using Eq. 8 (nc) is more frequently used by chromatographers to evaluate the resolving power of gradient separations and to guide the optimization of experimental conditions [56,57,88-91]. However, it is very important to note that as the separation conditions (e.g. temperature, gradient steepness) are varied, both the retention window and the peak width change. Therefore, peak capacity computed via Eq. 8 usually does not reflect the change in the true resolving power since the gradient time (tG) is a fixed operational parameter, independent of temperature, flow rate, etc., while the retention window (tR,n – tR,1) is strongly affected by many other variables (e.g. eluent strength, temperature).
Recently, Wang et al [37,66] studied the optimization of peak capacity for peptide separations in gradient elution RPLC and critically compared the two distinctly different expressions for peak capacity. They showed that the peak capacity computed via Eq. 9 (nc**) is proportional to the average resolution of all adjacent solute pairs in a sample mixture. It is obvious that Eq. 8 has nothing to do with the average experimental resolution. Simple algebra shows that:
| (10) |
where Rs,i,i+1 is the resolution for a given solute pair, n is the number of constituents and Wavg is the approximated constant peak width. This is supported by data shown in Fig. 14 in which peak capacities calculated using both Eq. 9 (nc**) and Eq. 8 (nc) were plotted against the calculated average resolution for a mixture of eleven peptides over 2000 different separation conditions chosen by a Monte Carlo search of the separation variable space. It is clear that the peak capacities via Eq. 9 correlate very well with the average resolution while a very poor correlation between the peak capacities via Eq. 7 and the average resolution was observed. Since the average resolution has the most practical importance for optimizing the separation of complex samples, the peak capacity computed via Eq. 9 (nc**) is the most important separation metric to be optimized for a real sample and thus we strongly recommend that it be used as the basis for optimization in 2DLC when one or more of the dimensions is a gradient separation.
2.5 Optimization of Peak Capacity in Gradient Optimization
Gradient elution optimization is a very complicated process due to the large number of variables that affect the separation and the strong interactions between them. For a given column, one can vary the flow rate (F), temperature (T), initial and final eluent strengths (ϕ0 an ϕf), and gradient time (tG). Ideally, in order to find the globally optimal conditions, one needs to fully search the multidimensional space of all variables. However, this is technically challenging and time consuming.
Wang et al. developed a peak capacity model for a mixture of eleven peptides based on the linear solvent strength theory of gradient elution and studied the effect of the individual operational variables (tG, F, T and ϕf) on the peak capacity [37,66]. For instance, Fig. 19 shows the effect of gradient time on peak capacity at different flow rates at fixed T, ϕ0 and ϕf. In general, longer gradient times always produce higher peak capacities although peak capacity tends to approach an asymptotic limit at longer gradient times. However, the rate of increase in peak capacity with tG is substantially different at different flow rates and this clearly shows the strong interaction between flow rate and gradient time. Note this study was not conducted to optimize the very short gradient times used on the second dimension of 2DLC but based on these results we must expect the peak capacity to be a strong function of gradient time when tG is less than 1 minute. They also found that the peak capacity maximizes at intermediate flow rates when the gradient time is fixed (see Fig. 20). Nevertheless, under the conditions of this study the optimal flow rate varied from 0.90 to 0.30 mL/min when tG was increased from 15 to 120 min. This further confirmed the strong interaction between gradient time and flow rate and shows that one should not attempt to reach the highest peak capacity simply by working at the flow rate which maximizes the isocratic plate count; this conclusion will be counterintuitive to most chromatographers familiar with more mature approaches to optimization of isocratic separations.
Figure 19.
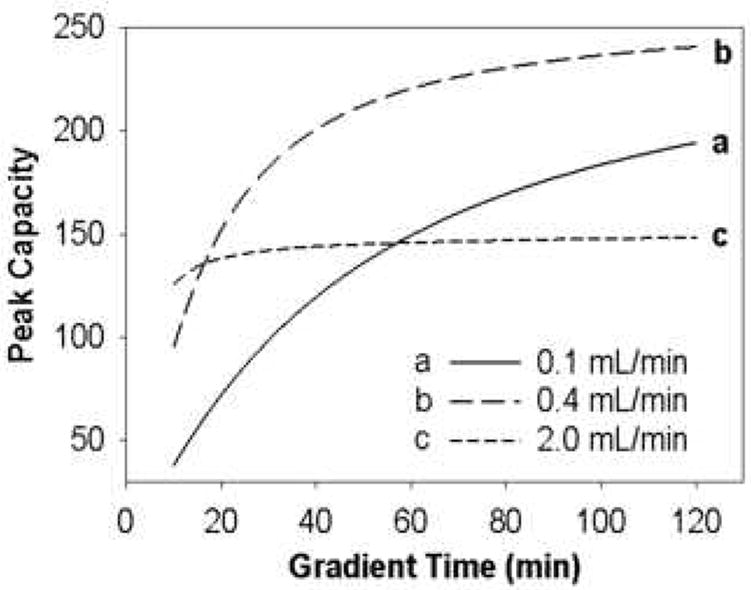
Effect of gradient time on peak capacity of eleven peptides at various flow rates. From ref. [66].
Figure 20.
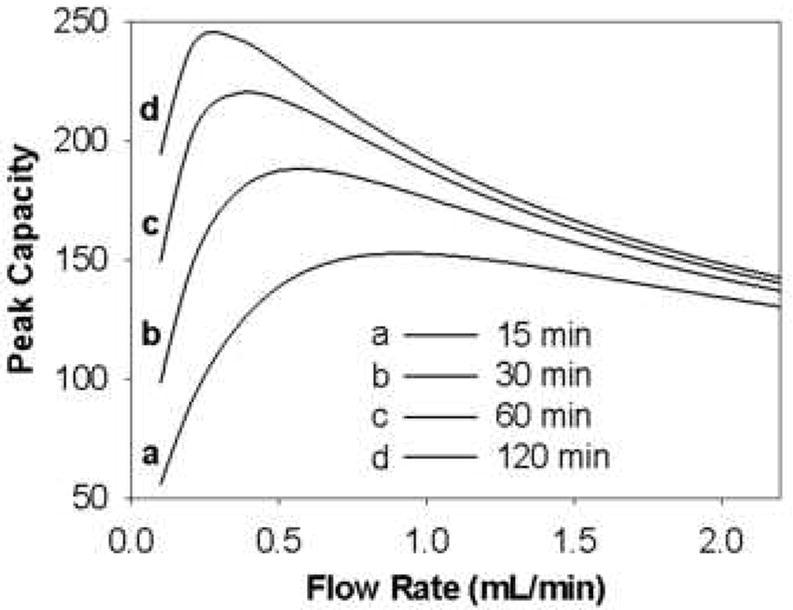
Effect of flow rate on peak capacity of eleven peptides at various gradient times. From ref. [66].
Strong interactions were also observed between flow rate and temperature as evident in Fig. 21 where peak capacity is plotted against the temperature at different flow rates. This is mainly due to the fact that temperature influences the isocratic plate count much more strongly at higher flow rates where the van Deemter C-term is dominant. Due to these strong interactions, a simple, sequential univariate optimization of the peak capacity is likely not going to find the global optimum. Therefore, one really needs to simultaneously optimize all variables. This is further supported by Fig. 22 which shows the effect of temperature on peak capacity for three cases. Only when the final eluent strength and flow rate are simultaneously optimized as temperature is increased, does the peak capacity increase monotonically with increasing temperature.
Figure 21.
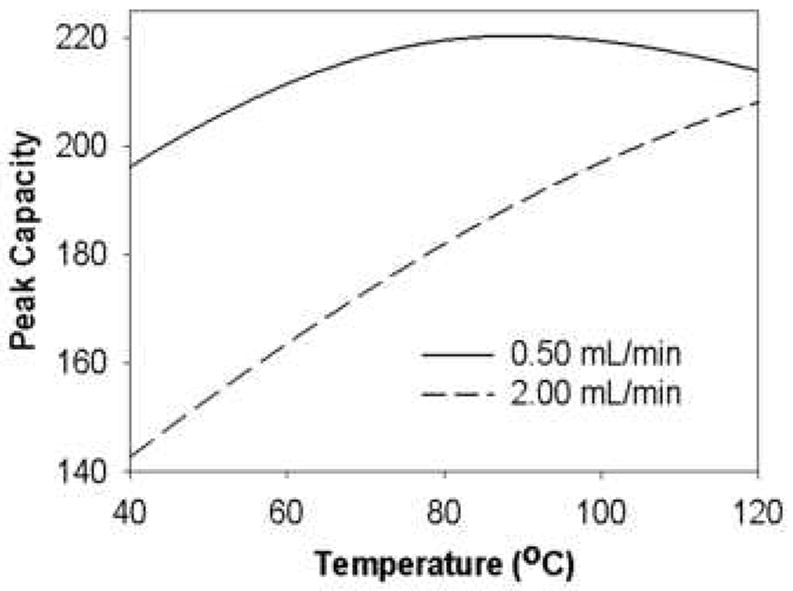
Effect of temperature on peak capacity of eleven peptides at two flow rates. From ref. [66].
Figure 22.
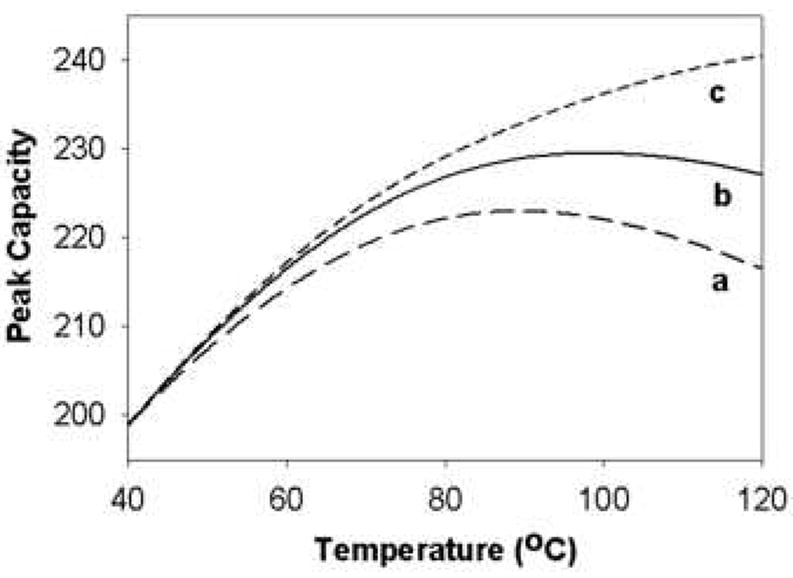
Effect of temperature on peak capacity of eleven peptides in three cases. Case a: ϕf is kept constant at 0.409 (– –); Case b: ϕf is optimized by Solver to maximize peak capacity (—); Case c: Both ϕf and flow rate are simultaneously optimized by Solver to maximize peak capacity (----). From ref. [66].
All of the above studies were done with a fixed column format. That is the column diameter, length and particle size were fixed. In a follow-up study Wang [37] examined the effect of column length and compared different types of particles (pellicular vs. fully porous). The most important finding from their study, for the purposes of fast 2DLC, is that peak capacity, under conditions of fully optimized separation, increased only with the square root of the column length. Moreover, to achieve the increase in peak capacity with column length the gradient time must be increased nearly in proportion to the column length. What this means is that under fully optimized (flow, temperature, gradient time, and initial and final compositions) conditions of gradient elution chromatography a doubling of peak capacity can only be purchased at the price of a four fold increase in column length and four fold increase in analysis time thus each doubling of the desired peak capacity is a non trivial matter. As will be shown below use of multi-variate detectors, even one as common as the DAD, can easily double the effective peak capacity and a mass spectrometric detector can increase the effective peak capacity by factors of thousands and tens of thousands.
2.6 Fast Liquid Chromatography
It is obvious that to do fast 2DLC one must speed up the separation on the second dimension column since this separation is repeated many times and thus it is effectively the rate controlling step (see below for more detail). Almost since the inception of modern liquid chromatography in the late ‘60s its sluggishness relative to gas chromatography was evident and there has always been “pressure” to increase its speed. Many groups, most notably those headed by Guiochon, Knox, Horvath and Poppe, [92-101] have made very important contributions to our understanding of the factors that limit speed in HPLC. One of the most important yet simple equations which govern the analysis time (tanalysis) seems to have been first presented by Guiochon [92]:
| (11) |
Where N is the required column efficiency, k’ the retention factor of the last eluting peak, Dm the analyte’s diffusion coefficient in the mobile phase, h and υ̣ the reduced plate height and reduced velocity respectively and dp the packing material particle diameter.
Eq. 11 makes the role of the diffusion coefficient and particle diameter clear. If we are interested in the limiting value of the time per plate then in terms of the Knox equation:
| (12) |
| (13) |
Clearly we should focus on h/υ̣ as υ becomes quite large. We assume that one can reach velocities such that the last term in Eq. 13 is dominant. This is probably not a good assumption as the maximum pressure available, especially when small particles (dp < 3 micron) very likely preclude reaching such velocities.
| (14) |
The equation suggests that the time needed to generate a plate decreases in proportion to the square of the particle diameter. A decrease in particle diameter under otherwise fixed conditions (column length, eluent linear velocity, column temperature, etc.) can only be accomplished by increasing the applied pressure. In fact the highest linear velocity allowable, which is what sets the analysis time, is directly proportional to maximum allowable pressure and inversely proportional to the particle diameter squared. It is clearly correct to say that speed in LC increases with an increase in the maximum pressure used and with a decrease in particle diameter [102]. It is not at all correct to say that maximum plate count is achieved with small particles. In fact the maximum possible plate count when time and detection are not of interest is achieved with a very long column packed with very big particles (see below).
2.7 Understanding Speed in HPLC Through Poppe Plot Analysis
The dependence of speed on particle size is very clearly shown in what have rightfully become widely known as “Poppe” plots. The interested reader is advised to look carefully at such constructions [94] and related kinetic plots by Desmet and coworkers [103,104]. The “Poppe plot” is an elegant approach to assess the compromise between isocratic efficiency and speed [94]. A classical Poppe plot is a plot of the ratio of column dead time to N on the vertical axis vs. N on the horizontal axis. The chromatographic conditions such as particle diameter, maximum pressure, and temperature are set. One then fixes the dead time and maximizes N by choosing the linear velocity and column length consistent with the maximum pressure drop. The dead time is incremented and the optimization repeated. This produces the plot shown in Fig. 23. The Poppe plot is particularly useful for the selection of appropriate column formats (e.g. particle size and column length) at specified separation conditions (e.g. maximum N at a given analysis time).
Figure 23.
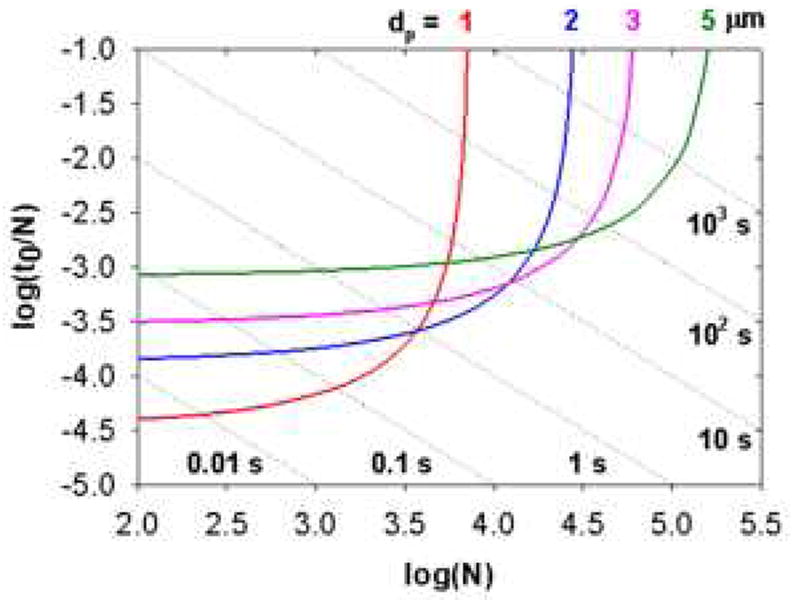
Isocratic Poppe plot for packed bed columns with different particle sizes. Conditions: ΔP = 400 bar, T = 40 °C, ϕ = 500, η = 0.69 cPoise, Dm = 1 × 10⁻⁵ cm2/sec. Coefficients in reduced van Deemter equation were measured on a 50 × 2.1 mm 3.5 μm Zorbax SB-C18 column using heptanophenone in 40 % acetonitrile (v/v) at 40 °C (k’ = 20): A = 1.04, B = 15.98, C = 0.033. Each dotted line represents a constant column dead time. From ref. [105].
To make reading easier, one plots a series of diagonal lines to indicate reference dead times. Inspection of the plots shows that very fast separations can only be achieved by sacrificing N. The fastest separations occupy the lower left quadrant of the graph; conversely very large N values can only be achieved at long analysis time. The fact that the curves for different size particles show a cross-over tells us that fast separations are achieved with small particles, short columns and high linear velocity but high N separations are achieved with large particles, long columns and a very low linear velocity. The curves in Fig. 23 were computed without consideration of extra-column effects which will become dominant at high speed with short columns. It must be understood that the various curves in Fig. 23 are not computed at constant resolution. In fact the highest resolution is obtained at the highest value of N. There is a very strong trade-off that must be made between analysis time and resolution (see below), that is, increases in resolution under isocratic conditions are very expensive in terms of analysis time.
2.8 Poppe Plots in Gradient HPLC
The application of Poppe plots in gradient elution, which are essential for generating high peak capacities, is much less straightforward. First, under gradient conditions we are more interested in peak capacity instead of column efficiency as the measure of resolving power. Second, the gradient time (tG) is much more meaningful than the column dead time (t0) to assess the speed of the separation. Finally, the optimal operating conditions for the peak capacity in gradient elution can deviate substantially from the optimal conditions for isocratic efficiency [37,66].
By applying the concept of isocratic Poppe plots, Wang et al. [37,105] introduced the gradient peak capacity Poppe plots by plotting the logarithm of the “peak capacity time” (i.e., tG/nc) against the logarithm of the peak capacity (nc) at a given pressure limit. The horizontal axis (i.e., nc) represents the resolving power of the separation. The vertical axis (i.e., tG/nc) is inversely proportional to the peak capacity production rate, which is of great importance in the optimization of the second dimension separation of a 2DLC system [10,37,66]. Such plots can greatly facilitate the selection of the optimal column format that provides the best compromise between peak capacity and speed.
Fig. 24 shows a gradient peak capacity Poppe plot for a set of peptides representative of a typical tryptic digest of a protein. Each dashed line on the plot corresponds to a different gradient time. Moving toward the right along the curve results in a longer column, a lower flow rate and a lower final eluent strength to maximize the peak capacity at each gradient time. It is obvious that this plot resembles a conventional isocratic Poppe plot. It suggests that larger particles are desired to achieve separations with high peak capacities but faster separations with low peak capacities and high peak capacity production rates favor the use of smaller particles. The main differences in gradient peak capacity Poppe plots from the isocratic Poppe plots are that 1) at the high nc end on the right, the asymptotes are not vertical and this suggests that higher peak capacities can be achieved by sacrificing analysis time, although the gain becomes very slight as described above; 2) at the low tG/nc end on the left, the asymptotes have positive slopes and this means that one can gain better peak capacity production rate by further reducing the gradient time.
Figure 24.
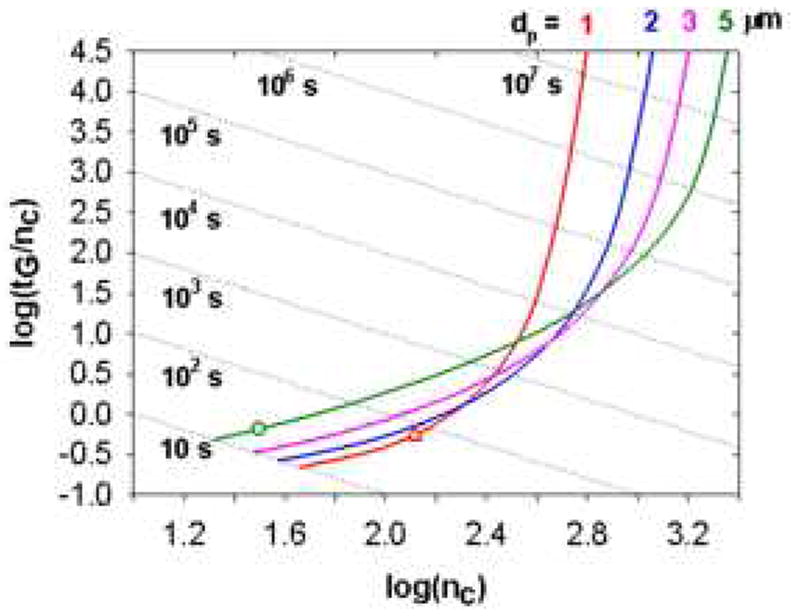
Effect of particle size on gradient elution Poppe plots. Sample was a mixture of eleven representative peptides. Conditions: ΔP = 400 bar, T = 40 °C, ϕ = 500, η = 0.69 cPoise. Diffusion coefficients of the peptides were estimated using the Wilke-Chang equation. Coefficients of the reduced van Deemter equation were measured on a 50 × 2.1 mm 3.5 μm Zorbax SB-C18 column using heptanophenone in 40 % acetonitrile (v/v) at 40 °C (k’ = 20): A = 1.04, B = 15.98, C = 0.033. Open triangles represent the points where the column length is 1.0 cm and open circles represent the points where the flow rate is at 5.0 mL/min. Each dotted line represents a constant gradient time. From ref. [105].
The effects of temperature and maximum pressure on peak capacity and analysis speed were also assessed using gradient peak capacity Poppe plots (see Fig. 25). Temperature has a much bigger impact on the fast separation side as compared to the high peak capacity side. When tG is shorter that 100 seconds, elevating the temperature from 40 to 100 °C can substantially improve both the peak capacity and its production rate. On the other hand, maximum operating pressure has a greater effect on the slow but high peak capacity side while the gain in peak capacity production at short analysis time by increasing the pressure from 400 to 1000 bar is much smaller. Thus the most effective way to speed up gradient elution separations of peptides is to use higher temperatures not higher pressures. We believe that the same will be true for the separation of small molecules as encountered in metabolomics studies but this has not yet been proven and may not be true as peptides have rather high values of the Snyder solvent strength parameter (i.e., S) which is critically important to the generation of peak capacity in gradient elution [83].
Figure 25.
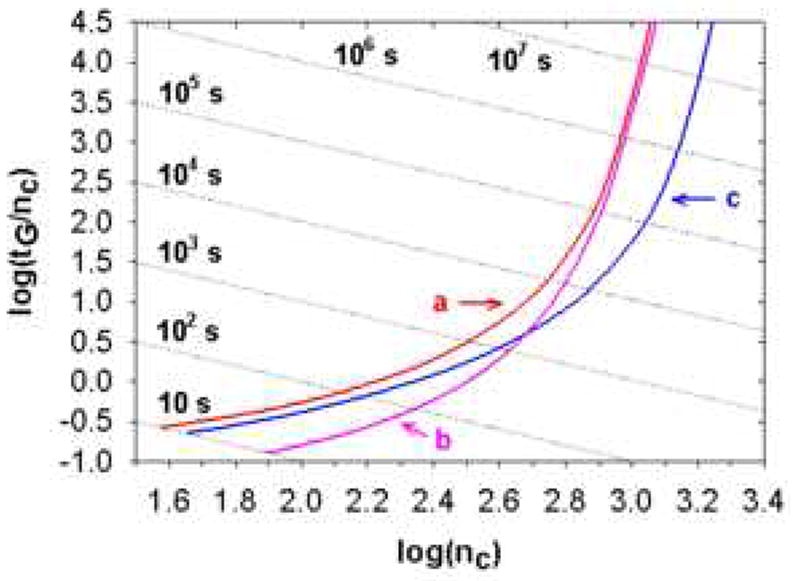
Effect of operating temperature and maximum pressure drop with 2 μm particles on gradient Popple plots for packed beds. Curve a: T = 40 °C, ΔP = 400 bar (normal temperature and typical maximum pressure). Curve b: T = 100 °C, ΔP = 400 bar. Curve c: T = 40 °C, ΔP = 1000 bar. Other conditions are the same as Fig. 19. From ref. [105].
2.9 Effect of Elevated Temperature on Speed in HPLC
Eq. 13 also points to the analyte’s diffusion coefficient as a major factor in explaining why gas chromatography is faster than liquid chromatography as made quite clear by Giddings in his classic paper in 1965 [106]. In our opinion an easily overlooked fact is that the speed of analysis is also rather dependent on the systems temperature. Indeed, Horvath [107] made this quite clear over a decade ago.
The strong relationship between diffusion coefficient and eluent viscosity (η) is evident in the Stokes-Einstein equation:
| (15) |
where R, T, r, and NAv are the gas constant, temperature (Kelvin), radius of the diffuser (assumed spherical), and Avogadro’s number, respectively. Lumping all temperature independent terms into a single constant (=1/Ω) gives:
| (16) |
The fact that eluent viscosity is strongly dependent on eluent composition and temperature is well known (see Fig. 26). When aqueous-organic mixtures are used there is always a maximum in the plot of viscosity vs. composition and this can cause very high pressure drops. Horvath showed, at least theoretically, that increases in column temperature at constant plate count, retention and pressure drop result in very considerable increases in speed (Fig. 27). Subsequent experimental work (Fig. 28) by Yan et al. [108] showed that Horvath’s predictions of a significant decrease in the limiting slope of a plot of H vs. velocity (at constant retention factor) does in fact take place.
Figure 26.
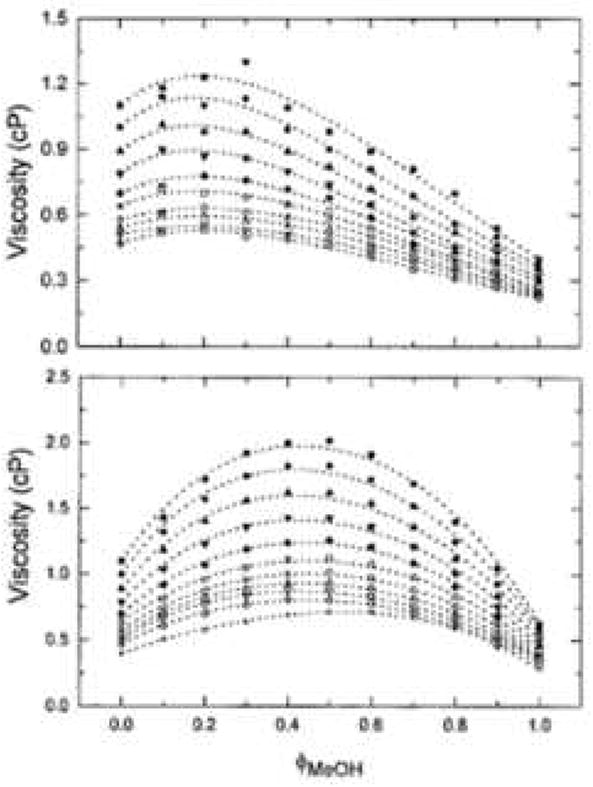
Effect of mobile phase composition and temperature on viscosity. Experimental data and fitted curves for the viscosity of (A) acetonitrile/water, (B) methanol/water mixtures at different temperatures. Symbols, temperature (°C, top to bottom): 15; 20; 25; 30; 35; 40; 45; 50; 55; 60. From ref. [109].
Figure 27.
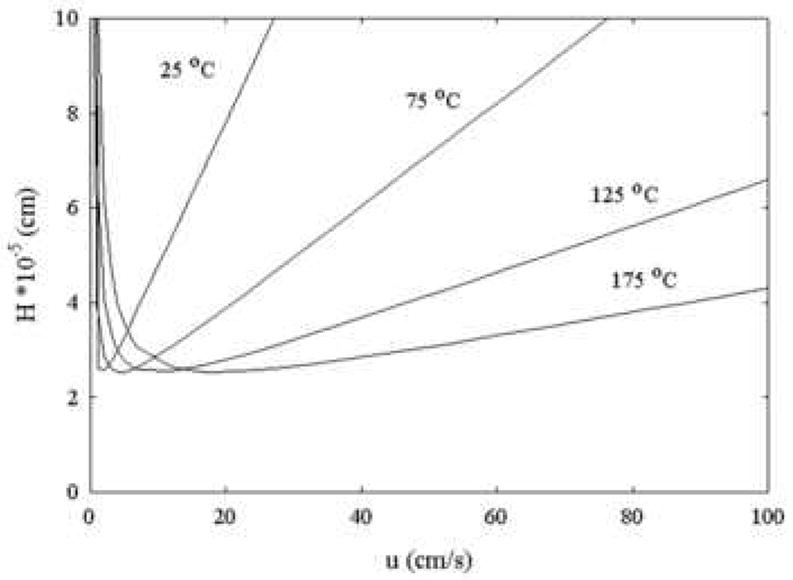
Theoretical effect of temperature on a plot of HETP vs. linear velocity. Conditions: The particle diameter is taken as 3 μm and the reduced linear velocity is based on diffusion at a fixed temperature ((Dm at 25 °C = 6*10-7 cm2/s). The linear velocity (u) is increased and the reduced plate height is calculated from a modified Knox equation: at each velocity and temperature. Fast desorption kinetics are assumed (Ea = 20 kJ/mol, ko = 1*1013s). From ref. [97].
Figure 28.
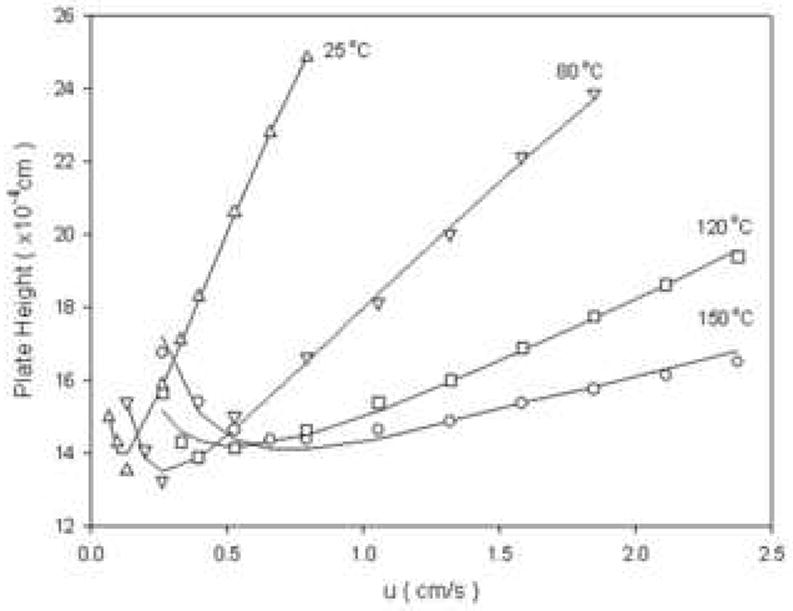
Experimental effect of temperature on column dynamics. Conditions: 25 °C (decanophenone, k’ = 12.2);, 80 °C (dodecanophenone, k’ = 7.39);, 120 °C (tetradecanophenone, k’ = 12.3);, 150 °C (tetradecanophenone, k’ = 7.00). From ref. [109].
It is a mistake to think that increasing temperature can improve the optimum column efficiency. It is evident in both of the above figures that this does not happen. What in fact happens is that an increase in temperature allows one to access higher eluent velocities through its effect on viscosity which impacts both the pressure needed to drive the fluid and the diffusion coefficient and thus improves the C-term.
Additionally Horvath showed that the fear of the use of higher temperatures in LC as a cause of on-column analyte decomposition has been, from a theoretical perspective, vastly exaggerated. The whole point of increasing the column temperature is to enable an increase in linear velocity and thus a decrease in on-column residence time. Thompson [101] has shown that even some rather thermally labile pharmaceuticals can be analyzed and elevated temperatures with excellent precision and little evidence of decomposition. Yang [57] has shown that peptides are really quite thermally refractory and can withstand high temperatures for a long time with no sign of amide hydrolysis under typical acidities (0.1% trifluoroacetic acid) used in peptide RPLC. Clearly fast 2DLC is an ideal venue for use of higher temperatures as the goal is to do the second dimension separation as fast as possible certainly in less than one minute.
A most important consideration in implementing high temperature LC is that the thermal mismatch broadening effect discovered by Poppe and Kraak [110] must be avoided. It is not altogether obvious but if one generates a radial temperature gradient in a column by either allowing a fluid held at a temperature other than the column temperature to enter the column, or by generating the temperature difference inside the column by viscous heating, peaks become distorted. Our work [108] shows that the problem becomes significant when the temperature difference is 5 °C or greater. In principle the problem can be avoided by using pre-column thermostating tubing of sufficient length; however, this length can be excessive from the perspective of extra-column broadening. In fact it is very easy to ascertain when peak broadening is due to thermal mismatch; all one need do is inject a homolog series. As the enthalpy of retention and thus the sensitivity of retention to temperature increases as one increases the homolog number, at least in RPLC, one sees that the better retained peaks and not the early peaks are more distorted and broadened. Quite the opposite is observed when one injects too large a volume of sample or there is excessive extra-column volume or detector time constant. The key to controlling thermal mismatch is to use a narrow-bore column. As Thompson [99] showed the change in thermal mismatch induced broadening upon decreasing the column diameter from a 4.6 mm to a 2.1 mm id column at the same linear velocity can be profound (see Fig. 29).
Figure 29.
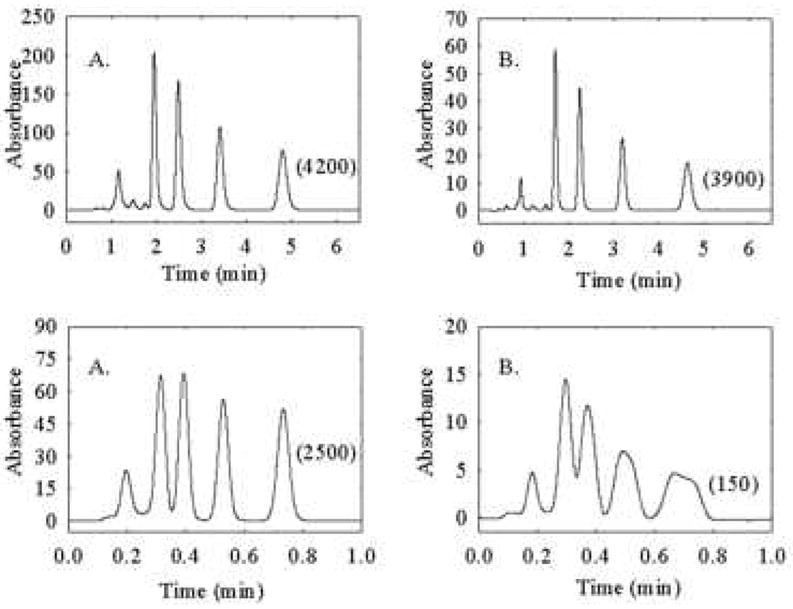
Effect of column diameter on thermal mismatch broadening. Top chromatograms for (A) 2.1 mm i.d. × 50 mm and (B) 4.6 mm i.d. × 50 mm columns. The columns were thermostated at 27 °C and the column linear velocity is 0.25 cm/s. Bottom chromatograms show the effect of temperature mismatch broadening on peak shape as a function of column diameter at elevated temperature. Column linear velocity is 1.75 cm/s. Preheater (5 cm × 0.005-in. i.d.) and column are in a stirred oil bath at 60 °C. Mobile-phase compositions were adjusted to 55:45 and 60:40 acetonitrile/water (v/v) for the narrow- and conventional-bore columns, respectively. Solutes are (1) toluene, (2) ethylbenzene, (3) propylbenzene, and (4) butylbenzene. Numbers in parentheses are the efficiencies of butylbenzene. From ref. [99].
It is evident that acetonitrile-water mixtures generally have lower viscosities than methanol-water mixtures and thus it would seem, at first blush, that acetonitrile should be the preferred eluent for fast HPLC where the pressure limits of the pump are approached. However, it must be held in mind that acetonitrile-water at a given volume fraction of organic modifier is generally speaking a stronger eluent than is methanol-water of the same volume fraction. In fact, it was an open question as to whether one should work at low volume fraction and high temperature or high volume fraction and low temperature to achieve the same retention at the lowest possible viscosity. The work of Thompson has settled the issue [101], at least for non-polar solutes and acetonitrile-water mixtures. The data in Table 5, which are based on the measured effect of composition and temperature on retention of alkylbenzenes shows that the viscosity is always lowest using the highest temperature and weakest eluent to achieve the same retention factor. This was a very important result confirming the ideas of Antia and Horvath [97].
Table 5.
Effect of temperature and the percent acetonitrile on retention and eluent viscositya. From ref. [109].
| k’a | % ACN (v/v) | T (C) | ηb (cP) | η(T)/ η(25 °C) |
|---|---|---|---|---|
| 1 | 84.4 | 25 | 0.44 | 1.00 |
| 1 | 76.9 | 100 | 0.26 | 0.60 |
| 1 | 72.1 | 150 | 0.19 | 0.43 |
| 1 | 67.5 | 200 | 0.14 | 0.32 |
| 5 | 69.4 | 25 | 0.55 | 1.00 |
| 5 | 58.6 | 100 | 0.29 | 0.53 |
| 5 | 51.7 | 150 | 0.20 | 0.36 |
| 5 | 44.9 | 200 | 0.14 | 0.25 |
| 10 | 63.0 | 25 | 0.60 | 1.00 |
| 10 | 50.7 | 100 | 0.30 | 0.51 |
| 10 | 42.8 | 150 | 0.20 | 0.33 |
| 10 | 35.2 | 200 | 0.14 | 0.23 |
The table gives the value of ϕACN and T required to obtain the indicated k’ for n-butylbenzene on a Zorbax ODS phase
Eluent viscosity calculated at the indicated ϕACN and T.
Another important result from Thompson’s work that is extremely relevant and fortuitously compatible with the needs of fast 2DLC is the fact that when one uses an elevated temperature to speed up LC the stationary phase should be as retentive as possible. This seems counterintuitive but one can almost always compensate for the higher intrinsic retention by increasing the column temperature or increasing the amount of modifier in the eluent which according to Fig. 26 both act to decrease viscosity. Later we will discuss additional reasons why it is so beneficial in 2DLC to use a highly retentive column as the second column. We also note in passing that in gradient elution the most important viscosity is at the eluent composition where the viscosity is a maximum. Unpublished work shows that temperature has its maximum effect at the composition of maximum viscosity. Thus increasing temperature is somewhat more beneficial in gradient elution than in isocratic elution.
2.10 Other Ways to Increase Speed
It is sometimes said that one can speed up an analysis by using a shorter column. As long as the initial separation gives higher resolution (Rs) for the critical pair than is needed then this is true. It is easily shown based on Eq. 16 that:
| (17) |
Consequently, it should be clear that once the other terms in this equation are fixed a decrease in analysis time can only be obtained at a rather high cost in resolution. It is evident that C, α, k’, dp and Dm are all independent of column length. Thus as the column is shortened to decrease tR Rs must decrease.
There are other mechanisms for increasing the speed of HPLC. From the mobile phase point of view, lowering mobile phase viscosity enables the increase of speed with reasonable pressure drop. Olesik et al. utilized carbon dioxide and other species as additives in methanol-water mobile phases to decrease mobile phase viscosity significantly [111,112]. From the column point of view, these approaches include the use of monolithic columns [113], non-porous stationary phases [114], superficially porous stationary phases [115], ultra-high pressure, short columns, small particles [116] and using several parallel second dimension columns [117,118]. These are not the subject of the present review, although this is a very active area of research. It is not at all clear at this point that any one approach will be superior to the others for use as a fast second dimension in all applications of 2DLC. Many of these approaches are not incompatible. For example there is no reason why one could not combine both high temperature and ultra high pressure to achieve very fast separations.
3. PRACTICAL ASPECTS OF HIGH TEMPERATURE 2DLC
3.1 Thermally Stable RP-phases
Although use of high temperatures is an effective way to speed up the second dimension separation in LC, a thermally stable phase is an absolute necessity for success. There are many thermally stable normal phases with silica, alumina, zirconia or titania as the substrate, and there are some thermally stable SEC phases, such as polystyrene, unfortunately, there are not many commercially available thermally stable RPLC columns. We summarized their properties in Table 6.
Table 6.
Summary of Thermally Stable RPLC Phases
| Name of phase | Particle size (μm) | Thermo-Chemicala Stability | Efficiency | Selectivityb vs. C18 | Thermal-Mechanicalc Stability |
|---|---|---|---|---|---|
| Agilent SB | 1.8, 3.5, 5 and 7 | + | ++ | Similar | + |
| Agilent Extend | 1.8, 3.5, 5 and 7 | + | ++ | Similar | + |
| Waters X-bridge | 2.5, 3.5, 5 and 10 | + | ++ | Similar | + |
| Zirchrom PBD, PS | 2.5, 3.5, 5 and 10 | ++ | ++ | Different | + |
| Zirchrom Carb | 3, 5, 10 and 25 | ++ | 0 | Different | + |
| Zirchrom Diamondbond | 3, 5, 10 and 25 | ++ | + | Different | + |
| Thermo Electron Hypercarb | 3, 5 and 7 | + | 0 | Different | - |
| Hamilton Polymer reversed phases | 3, 10 and 12-20 | + | - | Different | - |
| Selerity Blaze | 3 and 5 | + | ? | Similar | + |
This refers to the chemical integrity of the column under the stress of elevated temperature specifically the loss of the retentive phase or modification of the column. Basically, how constant is retention.
This refers to how similar retention order is relative to a typical octodecyl-like silane bonded phase.
It is found that repeated heating and cooling of hot column and imposition of eluent gradients can cause a grievous decrease in column efficiency, even though there is no decrease in retention. This has been found to be especially problematic with narrow bore (2.1 mm) column.
3.2 Combinations of Separation Modes
3.2.1 Intermolecular interactions and mode of separation
Separations come about in chromatography due to differential intermolecular interactions between the various analytes with the mobile and stationary phases and thus are dependent on the different kinds of intermolecular forces. These forces include: dispersion, dipole-induced dipole, dipole-dipole, hydrogen bonding and ionic (Coulombic) interactions. The different modes of separation (RPLC, NPLC, ion exchange, etc.) in liquid chromatography are mainly based on these different types of interactions. The reversed-phase mode is by far the most popular mode of HPLC and it is especially useful in biological studies and the separation of pharmaceuticals. Its separating power is mainly based on nonpolar (hydrophobic, lipophilic) selectivity, involving the nonpolar stationary phase, polar mobile phase and relatively nonpolar parts of the solutes [119-123].
Much of the chemistry of RPLC can be rationalized through the use of general linear solvation energy relationship (LSER). A review of the use of LSERS [124] in chromatography appeared recently. The equation takes one of two forms depending on the kind of chromatography:
| (18) |
where Pi, Ai, Bi and Ri represent the solute’s dipolarity, hydrogen bond donor acidity, hydrogen bond acceptor basicity and excess molar polarizability. The parameter Vi is a measure of solute molecular volume and it is present in the LSER to account for both the cavity formation processes and dispersive interactions. In GC Vi is replaced with Li16 which is the logarithm of the gas to hexadecane partition coefficient because much better fits are so obtained. The use of Li16 in GC and SFC is based on the stronger contribution of dispersive interactions in GC and SFC as compared to RPLC. The various solute molecular parameters are precisely what Giddings had in mind when talking about sample dimensionality. The various coefficients for several representative forms of chromatography are given in Table 7.
Table 7.
Various coefficients for representative forms of chromatography. From ref. [124].
| Type of System | s | a | b | r | l | v |
|---|---|---|---|---|---|---|
| RPLC on an ODS phase in 83/17 MeOH/Water | -0.07 | -0.25 | -1.37 | 0.11 | --- | 1.03 |
| RPLC on Hypercarb in 83/17 MeOH/Water | 1.39 | -0.62 | -1.42 | --- | --- | 2.23 |
| NPLC on alumina | 4.6 | 8.2 | 5.8 | --- | --- | 1.51 |
| NPLC on silica | 4.0 | 3.0 | 8.05 | --- | --- | 0.95 |
| GC on polydimethyl silicone at 80 °C | 0.32 | 0.22 | 0.00 | -0.15 | 0.63 | --- |
| GC on carbowax at 115 °C | 1.69 | 1.94 | 0.00 | 0.00 | 0.45 | --- |
As shown by comparing the data in Table 7 for RPLC to that for the NPLC mode it is clear that NPLC is dominated by polar interactions such as dipole—dipole and hydrogen bonding and that molecular size has minimal impact on retention. Hydrophilic interaction liquid chromatography (HILIC) is different from both normal phase and reversed phase chromatography in that it involves a fairly polar stationary phase as does normal phase but employs eluents based on mixtures of water with organic solvents as does reversed-phase. The compatibility of HILIC eluents with RPLC systems suggests the combination of these two modes in 2DLC; however, HILIC has not been used extensively yet. Size-exclusion chromatography (SEC) separates molecules based purely on their size. Ion-exchange chromatography (IEC) separates molecules based on electrostatic (Coulombic) interactions in addition to other factors such as polarizability, hydrophobicity and how close the charged group of the solute can approach the fixed charge of the ion exchanger. It can be used for almost any kind of charged molecules, including small inorganic ions, proteins, nucleotides and amino acids. Affinity chromatography is a technique where the stationary phase is modified with a bio-specific receptor [125,126]. There are many forms of affinity chromatography in which the receptor binds to a broad class of targets [127]. Carbohydrate binding lectins such as concanavalin-A [128] may prove to be very useful as the first dimension in proteomics and metabolomics targeted isolation of specific glycosylated solutes.
3.2.2 Overview of successful combinations
As discussed previously, orthogonality and coverage are the main issues to consider when choosing a useful pair of phases and eluent conditions for successful 2DLC. So far, there have been a number of successful mode combinations, such as SEC × RP [129], SEC × NP [130], RP × NP [131], RP × RP [10], and IEC × RP[132]. In addition, some LC × CE [133] and LC × GC [134] combinations have been attempted The advantages and disadvantages of these combinations are surveyed in Table 8. Prior literature on different mode combinations is reviewed in Table 9. All available information about the mode combinations, columns and mobile phases used and analysis times are reported.
Table 8.
Comparison of mode combinations in 2D-LC × LC
| Mode combination | Application | Advantage | Disadvantage |
|---|---|---|---|
| IEC and RP | proteomics, peptidomics, | orthogonality | low peak capacity |
| SEC and RP | polymers, proteomics | orthogonality | low peak capacity |
| NP and RP | polymers, pharmaceuticals, oils, | orthogonality | solvent incompatibility, limited application |
| RP and RP | peptidomics, metabolomics, pharmaceuticals, foods, cosmetics | miscible solvents, broadest application, fast speed, gradient elution on both dimensions, highest peak capacity | orthogonality, strongly depend on the column choice or mobile phase choice |
| Affinity and RP | proteomics | orthogonality | off-line, low peak capacity |
| SEC and NP | polymers | orthogonality | low peak capacity |
| SEC and IEC | proteomics | orthogonality | low peak capacity |
Table 9.
Survey of LC×LC literature.
| Mode combinations | Columns | Mobile phases | Analysis time (min) | Applications | Ref | |
|---|---|---|---|---|---|---|
| RP and RP | RP × RP | CN × monolith C18 | Gradient methanol × stepped acetonitrile | 220 | Pharmaceutical: constituents in Adinandra nitida | [135] |
| RP × RP | HS-F5 × carbon clad zirconia | Gradient acetonitrile × gradient acetonitrile | 30 | Corn metabolomics | [10] | |
| RP-temperature gradient interaction chromatogra phy (RP-TGIC) × RP (LC-CC) | C18 × C18 | Isocratic CH2Cl2/CH3CN | - | Branched polystyrenes (PS) | [136] | |
| RP × RP | Monolith C18 × monolith C18 | Isocratic (gradient) water and tetrahydrofuran (THF) × isocratic (gradient) water and methanol | 60 | Aromatic compounds | [137] | |
| RP × RP | C5 × C18 | Gradient acetonitrile (TFA) × gradient formic acid, IPA, methanol, acetonitrile | - | peptide Purification | [138] | |
| RP × RP | X-terra C18 × SB-Phenyl | Gradient acetonitrile, TFA | 20 | proteomics | [139] | |
| RP × RP | ODS-AQ × monolith C18 | Gradient acetonitrile, TFA | 40 | mixture of some aromatic amines and non-amines | [140] | |
| RP × RP | C18 × carbon clad zirconia (CCZ) | Methanol × acetonitrile | 250 | complex mixt. of oligostyrenes | [141] | |
| RP × RP | CN × C18 | Gradient methanol × step acetonitrile (TFA) | 200 | Pharmaceutical: traditional Chinese medicines | [142] | |
| NP and RP | NP × RP | microbore silica × monolithic C18 | Gradient n-hexane and ethyl alcohol × gradient 2-propanol, acetonitrile, water | > 160 | Orange essential oil and juice carotenoids | [143] |
| RP × NP (HILIC) | C18 microbore × aminopropyl silica | gradient acetonitrile × isocratic ethanol-dichloromethane-water | 120 | Polymers: ethylene oxide-propylene oxide (EO-PO) (co)oligomers | [144] | |
| NP × RP | microbore silica × monolithic C18 | Isocratic n-hexane/ethylacetate × gradient water/ACN | 50 | Lemon oil | [145] | |
| RP and IEC | RP × IEC (SCX) | C18 × parallel 48-plexed SCX | Gradient acetonitrile (TFA) × gradient acetonitrile (phosphate, KCl) | - | Proteomics | [146] |
| IEC (SCX) × RP | SCX micro-trap × Poroshell 300SB-C18 | Acetonitrile, water, TFA | - | Proteomics: phosphopeptides enrichment | [147] | |
| IEC (SCX) × RP | PO4-zirconia × SB-C18 | Gradient sodium phosphate × gradient acetonitrile (TFA) | 20 | Tryptic peptides | [132] | |
| IEC (SAX) × RP | PL-SAX × polystyrene-divinylbenzene (PS-DVB) RP | pH gradient × pH gradient | - | Proteomics: | [148] | |
| (IEC) SCX × RP | PolyLC-SCX × C18 on chip | Stepped ammonium acetate salt × gradient acetonitrile | > 480 | proteomics | [149] | |
| IEC × RP | polymeric beads bonded with diethylaminoethyl and sulfonic acid groups × C18 | gradient KH2PO4 × gradient acetonitrile (TFA) | 20 | proteomics | [150] | |
| IEC (SCX) × RP | BioX-SCX × C18 | stepped NaCl salt solution × gradient acetontrile solution | > 600 | identify tryptic peptides from the immunoprecipitate | [151] | |
| IEC (SCX) × RP | - | Stepped ammonium chloride salt × gradient acetonitrile | - | proteomics | [152] | |
| IEC (SCX) × RP | - | Stepped NH4Cl salt × gradient acetonitrile (formic acid) | - | proteomics | [153] | |
| IEC (SCX) × RP | BioX-SCX × C18 | Stepped ammonium acetate salt solutions × gradient acetonitrile, formic acid solutions | > 720 | Quantitative Proteomic Study of PUMA-Induced Apoptosis | [154] | |
| IEC (SCX) × RP | microbore SCX × C18 (both monolith and particle) | gradient water (acetic acid) and acetonitrile × gradient of water and acetonitrile | 90 | aerosols | [155] | |
| IEC (SAX) × RP | Quaternary amine-SAX × C18 | Stepped guanidine thiocyanate.salt × gradient acetonitrile | 2400 | peptides | [156] | |
| NP and SEC | NP (LC-CC) × SEC | Alltech Platinum Silica × HSPgel-RT MB-L/M | chloroform/diethylether × chloroform | - | Polymer: degradation product of poly(bisphenol A)carbonate (PC) | [157] |
| NP × SEC | Hypersil “bare” silica× PLgel | Isocratic 48% ACN in DCM × THF | 90 | Polymer characterization: poly(methyl methacrylate) (PMMA) | [130] | |
| NP × SEC | Hypersil “bare” silica × Mixed-C | Isocratic THF–hexane × THF | 240 | Polymer: polystyrene (PS) | [158] | |
| RP and SEC | SEC × RP | G2000SWXL × BDS-C18 | Water (TFA) × gradient acetontrile (TFA) | 320 | peptides | [129,159] |
| RP × SEC | NovaPak silica × HSPgel | Gradient × THF | 300 | analysis of a series of styrene-methylacrylate (SMA) copolymers | [74] | |
| Gradient polymer elution chromatography (GPEC) × SEC | - | - | - | characterize functionality of hydroxy-telechelic polystyrene | [160] | |
| Affinity and RP | Affinity (silver) × RP | Silver-microbore × monolith C18 | Gradient acetonitrile and hexane × gradient isopropanol and acetonitrile | 150 | characterization of the triacylglycerol (TAG) fraction of a very complex lipidic sample: donkey milk fat. | [145] |
| Affinity (titania) × RP | Titania column × monolith C18 | Gradient potassium phosphate × gradient acetonitrile (TFA) | 30 | phosphopeptides | [161] | |
| Affinity (Silver) × RP | Silver column × monolith C18 | isocratic 0.7% (v/v) acetonitrile in n-hexane × gradient isopropanol and acetonitrile | 140 | Food analysis: rice oil | [162] | |
| IEC and SEC | IEC (SCX) × SEC | - | Gradient buffer × isocratic buffer | 240 | protein | [6] |
According to Gilar [73] the combination of SEC with either RP or NP provides excellent orthogonality for peptide separations. SEC × RP and SEC × NP are mainly applied to the separation of synthetic polymers and biopolymers. Since the separation mechanism of SEC is based solely on size, and RP and NP separates by hydrophobicity or polarity, this combination provides good orthogonality as needed in 2DLC. High resolution in SEC requires a large column volume and thus takes a long time, in the early literature of 2DLC SEC was most often used in the first dimension, while NP and RP were used as the second dimension. However, more recently SEC has been used primarily as the second dimension [158], this is probably because the overall separating power of the first dimension can be maximized by doing gradient elution which is generally perceived as being slow and there is no advantage to gradient elution in SEC. In fact low resolution SEC can be done very fast and the range of retention times is very predictable thus short SEC columns work well as the second dimension. For synthetic polymers, NP is used more often than RP, because so many polymers are soluble in organic solvents. When the polymers are water soluble, RP is used, although this has been relatively infrequent. At “critical conditions” (LC-CC), the synthetic polymers are separated based only on their functional group chemistry. Under these conditions retention is not based on the number of monomers in the polymer chain [163]. Thus, 2DLC separates polymers not only by size, but also by chemical type. These combinations have been successfully applied to the separation of poly(bisphenol A)carbonate (PC) [157,164], functional poly(Me methacrylate) (PMMA) [130], polyesters [165], blends of styrene-butadiene rubber and butadiene rubber [166], methyl methacrylate-grafted polybutadiene [167], styrene- and methyl methacrylate-grafted epoxidized natural rubber [168] and methyl methacrylate-grafted EPDM [169]. SEC can also be used to separate proteins based on size differences thus SEC × RP has also been used for biopolymer separations [129].
The IEC × RP combination is the workhorse method of proteomics. Salt concentration steps or gradients with increasing ionic strength were used to elute proteins or peptides from the first IEC dimension and transfer them onto the second RP dimension. The ion exchange step is carried out both off-line and on-line ahead of the reversed-phase step. This approach is easy to use and requires minimal sample manipulation. Both the combination of strong cation exchange with RP and strong anion exchange with RP have been successfully applied to tryptic digests of proteins[147,170] and other type of protein mixtures[150,171]. Recently, pH gradient ion exchange chromatography was coupled to RP for fast analysis[148], which might serve as a good alternative to 2DCE in proteomics. Unfortunately, this combination has only been done in the off-line manner. Another interesting development is the application of microfluidic devices. The combination of IEC and RP has been implemented using an HPLC chip[149,172].
The combination of NP × RP should provide a high degree of orthogonality. However, eluent incompatability is probably the overwhelming impediment for this combination. Nonetheless Murphy et al. [58] successfully carried out 2D-NP × RP separation for the analysis of alcohol ethoxylates, but they used the same aqueous solvent in both the NP and RP separations. Although the solvent immiscibility problem was solved, orthogonality was sacrificed. So far, two approaches to overcome this problem have been developed. The first is to use a first dimension column with a diameter is that is small relative to the diameter of the second dimension column. Thus, the volume injected onto the second dimension is relatively small, making the transfer of incompatible solvents from the first to the second dimension possible without peak shape deterioration or resolution losses [143,173]. This approach clearly sacrifices a great deal of analytical sensitivity. A second approach is to add enough water to the NP solvents to allow them to become miscible with the RP mode eluent; this might be tantamount to HILIC if a large amount of water were added and if one used a polar modified surface; this has been used in some polymer separations. Jandera et al. [144] come close to doing 2D-RP × HILIC in their use of 1.5% water in a nonpolar solvent and use of an amino-modified second dimension column to the separation of ethylene oxide–propylene oxide (EO–PO) (co)oligomers. According to their results, HILIC NP systems enable the transfer of aqueous-organic fractions from the RP dimension without compromising the normal-phase separation by deactivating the polar adsorbents.
RP is by far the most common mode of LC (conservatively more than 50% of all LC separations) due to its high efficiency, good chemical selectivity, reproducibility, and applicability to many classes of compounds [174,175]. A list of the most significant potential advantages of using RP separations in both dimensions of a 2D system is given here:
The RP mode is the most well understood of all LC modes from both practical and fundamental perspectives. This allows the user to bring a tremendous amount of knowledge and experience to bear on the difficult process of 2D method development.
The practice of gradient elution in the RP mode is well understood [176]. This enables fast, high peak capacity separations of very chemically diverse mixtures, and the ability to focus injected analyte at the column inlet to avoid serious injection volume broadening when large volume injections are made.
There are more than 350 commercially available phases for use in RPLC.
High efficiency separations are observed for a large range in analyte properties; in this sense RP separations are much more versatile than NP, IEX, and SEC separations.
RPLC is very well suited to the analysis of biological molecules, including those encountered in metabolomics studies. It is also more easily coupled to mass spectrometry which is essential in some biological studies.
Although RPLC suffers from day-to-day shifts in retention due to changes in instrumental conditions and column aging, it is far more reproducible than other modes such as NPLC which can be very sensitive to small changes in eluent composition.
If column and mobile phase combinations can be found that are sufficiently orthogonal to be useful, we expect that RP × RP separations will yield much higher effective peak capacities than IEC × RP separations because RP separations are typically much more efficient than IEC separations. Indeed, peak capacity production rates as high as 33/min. have been shown (see Fig. 4) for 2DLC separations of small molecules employing RP separations in both the first and second dimension separations, using only a single second dimension column and second dimension gradient cycle times of 21 s [10].
The versatility of RP separations has been exploited extensively in 2DLC; 2D-RP × RP has been applied to polymers, metabolomics, proteomics, peptidomics, and pharmaceuticals. Some applications, such as metabolomics, present quite a challenge in terms of finding column and mobile phase combinations that are sufficiently orthogonal to be useful. It is fair to say that the great success of 2DLC in proteomics applications is due in large part to the easy selection of orthogonal modes, namely IEC and RP. The peptides that are generated from proteolytic digestion of proteins vary significantly in both their degree of positive charge at low pH, and their hydrophobicity. This makes the typical choice of cation-exchange chromatography for the first dimension separation and RP for the second dimension quite straightforward. Moreover, these are particularly compatible because very little organic solvent is used in the IEC step and thus peptides are injected into the RP dimension in a matrix that has low solvent strength compared to what is normally used in the course of an RP solvent gradient. The diversity of chemical functionality faced in many metabolomic samples is much greater than in proteomics. For example, a study of the biosynthesis of indole-3-acetic acid, a potent plant growth regulator, required the analysis of acidic (i.e., carboxylic acids), neutral (i.e., alcohols), and basic (i.e., amines) compounds in a single 2DLC separation [10]. The structures of 26 of these compounds are shown in Fig. 30. Clearly neither anion-exchange nor cation-exchange chromatography alone will suffice for the first dimension in such applications, making RP × RP separations particularly attractive. A significant impediment to the wider use of the RP × RP mode of 2DLC is the paucity of sufficiently orthogonal pairs of RPLC phases. The combination of RP with RP usually shows very poor orthogonality between the two RP columns[140,177] despite the fact that more than 300 types of RP phases are available [123]. We have found that carbon coated zirconia, which is known to have radically different selectivity compared to conventional reversed phases [178], is sufficiently orthogonal to a fluorinated reversed-phase material to be useful in RP × RP analyses of small molecules in a variety of samples of biological origin (e.g., wine, coffee, plant tissue, human urine, see Fig. 5). The fact that this one reversed-phase material, carbon surfaces, seems to be so different from the hundreds of other commercially available reversed-phase materials should motivate the development of novel reversed-phase stationary phases for use in a wide-ranging applications of 2DLC.
Figure 30.
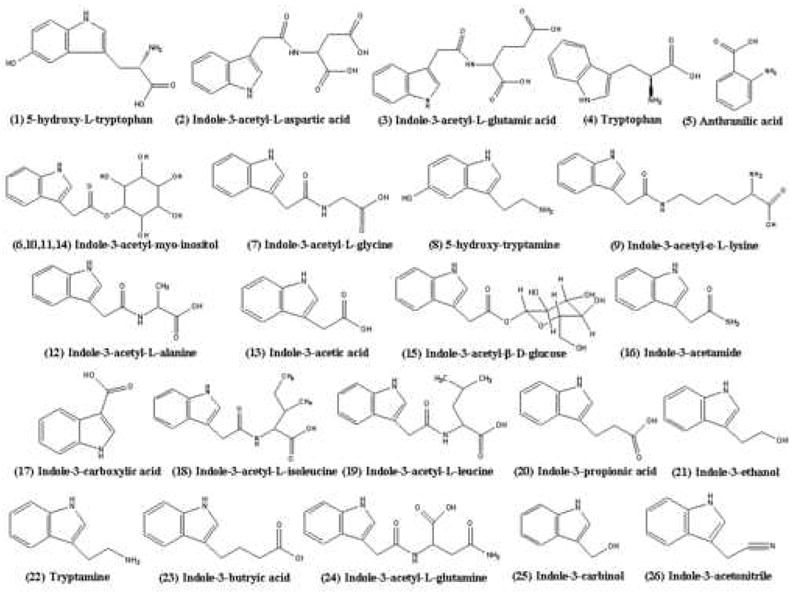
Structures of twenty six metabolites of indole-3-acetic acid. Compounds 6,10,11, and 14 are all structural isomers of indole-3-acetyl-myoinositol. The diversity of chemical functionality encountered in studies of these kinds of molecules (i.e., metabolomics) makes 2D method development considerably more challenging than in proteomics. From ref. [10].
The mobile phases used in RP × RP systems are fully miscible and have very similar physico-chemical properties (viscosity, wetting characteristics, etc.). However, whenever there is a large difference in the viscosities of the solvents used in the two dimensions, one must take particular care to avoid viscous fingering effect [179]. In addition, and most importantly at the end of the first dimension gradient when the eluent is strong one must take pains to focus the sample at the top of the second dimension column by assuring that the sample is strongly retained at the start of the second dimension gradient in order to take advantage of the benefit of sample re-focusing in the gradient elution mode of separation. The importance of re-focusing will be discussed in more detail below.
Actually, 2D-RP × RP separations are very analogous to 2DGC × GC separations. In 2DGC × GC, both columns separate solutes predominantly by dispersion forces (see Table 6), it is thus hard to imagine that a high degree of orthogonality could be achieved between two columns which separate solutes by primarily the same type of interaction. Similarly RP phases separate predominantly based on cavity formation and dispersion interactions (see Table 7). One could equally well say that retention in RPLC is dominated by one term in Eq. 18, that is the vV term. Nonetheless, 2DGC × GC has been very successful; this has been achieved by choosing two columns that are as different as possible (e.g. a dimethylsilicone phase and a carbowax phase) and by use of appropriate temperature tuning of the second dimension. This encouraged us to look for highly orthogonal combinations of reversed phase columns and examine their application to metabolomic samples. The combination of a phase like a solid carbon surface operating with a true adsorption mechanism as the second dimension with any number of conventional bonded reversed-phase with more partition-like mechanism proved to be fruitful. Indeed, combining the carbon adsorbent with a perfluorophenyl phase enabled the variety of samples shown in Fig. 5 to be done on a single pair of columns.
There are other possible combinations for 2DLC × LC. However, there are very few applications compared to those discussed above. The affinity × RP mode combination is usually limited to bioscience examples. Both bio-affinity columns[180] and metal-affinity columns[181] can be combined with RP columns. However, this combination is usually used with off-line separations. SEC × IEC has also been used for separating proteins by size and charge. This approach is quite similar to 2D-PAGE separations widely utilized in proteomics.
Other than 2DLC × LC separations, 2D LC × GC and 2DLC × CE separations are worth mentioning. Apparently, 2DLC × GC and 2DLC × CE inherently provide a high degree of orthogonality by their very nature. Although the separating power of 2DLC × GC is huge, it is not widely accepted due to the interface problem [134]. In 2DLC × GC, the interface has to transfer the liquid phase in LC to the gas phase in GC without losing the volatile solutes; this is very difficult. 2DLC × CE is much more appealing because the solvents used in LC and CE are totally miscible and the separation mechanisms are dramatically different. CE separations at high voltages are naturally fast, thus CE meets the criteria for a fast second dimension separations. Jorgenson et al.[9] applied capillary zone electrophoresis (CZE) as the second dimension after an RP separation of a tryptic digest of horse heart cytochrome was carried out on a capillary column. By use of short columns and high voltages, the separation time of CZE in the second dimension was decreased to 2.5 s. The total analysis time for the 2D system was a record setting 8 minutes. The interface between 2D-RP × CZE must be carefully designed to minimize extra-column broadening [133]. Another form of CE that has been coupled to LC is capillary isoelectric focusing (CIEF) [182,183]. CIEF separates proteins by their pIs, and focuses the proteins in very narrow bands, which is essential for maintaining high resolution power. Overall, 2DLC × CE is a very promising technique and further developments are very likely.
3.2.3 Comparison of elution mode in second dimension RP separations
To date the lion’s share of work in 2DLC has involved the use of an RP separation as the second dimension (see Table 9). The advantages of RP separations in this context are discussed in detail below; however, before we get into those details, a brief discussion of the merits of the different elution modes of RP separations themselves is warranted. Both conventional isocratic and gradient elution modes of RP separations have been used as the second dimension of 2DLC systems. A new elution mode which is unique to 2DLC that is intermediate between these extremes has also been demonstrated [137,139,140]. We will refer to it here as “advancing isocratic elution”. In this mode, nearly isocratic conditions are used in each second dimension separation, with the solvent strength increasing slightly in each successive run by feeding the second dimension pumping system with a shallow gradient in eluent composition over the course of the 2D separation. This is quite analogous to what is done very widely in 2DGC in which the temperature of the second dimension column is gradually increased during the entire run. The change in eluent composition during any single second dimension is never more than a few percent in volume fraction of organic modifier, and therefore each second dimension run is essentially carried out isocratically. Table 10 gives a comparison of the three modes of RP elution in terms of characteristics that are important in the context of the second dimension of a 2DLC system. Our overall conclusions from this comparison are that each mode has advantages and disadvantages, and no single mode will be superior in all applications of 2DLC involving a RP separation in the second dimension. However, based on our experience we believe that, despite the complexity of the experiments and instrumentation involving true gradient elution in each second dimension RP separation, the resulting 2DLC separations are superior in terms of performance (i.e., peak capacity) and flexibility (i.e., diversity of samples that can be handled with minor modification of operating conditions). Nonetheless, it is our opinion that the advancing isocratic mode of elution holds considerable potential and further study will show under which conditions this mode should be used; at this time we are aware of only three reports of such a study [137,139,140].
Table 10.
Qualitative comparison of different elution modes in RPLC for use as the second dimension in 2DLC
| Isocratic | Advancing Isocratic | Gradient | |
|---|---|---|---|
| Analyte Re-Focusing? | No | Very little | Yes |
| Sensitivity of Peak Width to Pre-Column Extra-Column Volume | High | High | Low |
| Column Re-Equilibration Requirement? | No | No | Yes |
| Time from Injection to Injection | Shortest | Good | Acceptable |
| Peak Capacity Dependence on Retention Range | proportional to ln(ΔtR) | essentially proportional to ln(ΔtR) | proportional to ΔtR |
| Peak Capacity Productivity | Best at very short times | Best at very short times | Best at moderate to long times |
| Simplicity of Instrumentation | Least complex | More complex | Most complex |
| Retention Repeatability | Probably superior to gradient | Probably superior to gradient. | Good |
| Range in S and ln k’w Allowed in Samples from First Dimension | Small | Larger | Very Large |
| Flexibility with Respect to Method Development | Least flexible | More flexible | Most flexible |
| Representative References | [137] | [137,139] | [10] |
One of the greatest advantages of gradient elution in the context of the second dimension separation is the potential for re-focusing of analyte bands eluting from the first dimension column. Relatively large injection volumes in the second dimension are unavoidable because if the first dimension column diameter is made too small, serious broadening of first dimension peaks will result from mass overloading of the stationary phase. The ability to re-focus analyte bands at the inlet of the second dimension column at the start of every second dimension gradient avoids serious broadening of second dimension peaks due the large injection volumes. Unfortunately this benefit of analyte re-focusing comes at the expense of throughput in the second dimension. Although column re-equilibration in RPLC is not nearly as slow as it was once thought to be [28], at very short gradient times (i.e., sub-minute), the instrument flush-out and column re-equilibration processes contribute about 20% of the total second dimension analysis time [10]. That is, the time spent flushing strong solvent out of the instrument and the column to prepare for subsequent gradient runs is wasted and cannot contribute to the overall usable peak capacity of the 2DLC analysis; this is not a problem in the isocratic elution mode. The advancing isocratic mode lies closer to the isocratic case in that very little analyte re-focusing will occur in a gradient with an eluent composition change of a few percent, and no column re-equilibration is required between second dimension runs. A second great advantage of the gradient elution mode is that the peak width in these separations is approximately independent of retention time [176]. Specifically, the increase in peak width with increasing retention observed in isocratic separations is either eliminated or significantly diminished in gradient separations. The ultimate impact on the performance of 2D separations is that the peak capacity of second dimension runs using gradient elution should always be higher than those using isocratic separations. Here again the advancing isocratic mode is very similar to true isocratic in that the very small changes in eluent composition during a single second dimension run are not enough to provide significant analyte focusing and mitigate the increase in peak width with increasing retention observed in isocratic separations.
Probably the greatest disadvantage of using true gradient elution in the second dimension (and producing a practical instrument for the general user) is the complexity of instrumentation required to carry out 2DLC separations without sacrificing the overall performance of the analysis. We have found and reported extensively on the problem of reducing the time required to flush the strong solvent out of the instrument constituents used to generate the solvent gradient, in preparation for subsequent gradient runs [10,28,132]. Indeed, the importance of maintaining excellent run-to-run retention repeatability in adjacent second dimensions runs cannot be overstated because of the extreme sensitivity of multivariate chemometric approaches to data analysis produced in multidimensional chromatography coupled to multi-channel detectors (see section 3.5). Under the simplest conditions in 1DLC with DAD detection one can show that changes in retention time of only 0.3 σ units will cause errors of up to 5% in concentration when the PARAFAC algorithm is used for quantitative analysis. Given that the standard deviations of second dimension peaks are on the order of 0.15-0.2 s for gradient times of 20 s [10,132] this means that we require a second dimension reproducibility in retention time of 0.045-0.06 seconds. Similarly given that the standard deviations of first dimension peaks gradient times of 30 minutes are about 10 seconds the reproducibility of first dimension retention time must be better than about 3 seconds. Both of these requirements are extremely difficult to meet in experiments lasting more than a few days, with existing instrumentation. Furthermore, discretization errors when the first dimension is sampled range from 0 to about 0.5ts depending on the phase of the sampling relative to the position of the peak. Given the rather large value of ts used in all 2DLC work the peak alignment problem is evidently very serious.
Obviously the instrumentation required for isocratic and advancing isocratic elution is much simpler than that required for ultra-fast gradient elution; although we are not aware of any detailed comparisons of the repeatability of retention time in isocratic and gradient elution separations under ultra-fast conditions (i.e., analysis times much less than 1 min), we believe the simplicity of the instrumentation involved in isocratic separations will lead to more repeatable retention times in subsequent second dimension conditions under these conditions.
The last two characteristics alluded to in Table 10 lead to an interesting comparison of 2DLC to 2DGC. As was discussed in detail in section 1.3, much of the success enjoyed by users of 2DGC can be attributed to the careful work of Phillips and coworkers who developed an approach to ‘orthogonalize’ pairs of GC columns, which at first glance, appear not to be very orthogonal at all. Indeed, the plot of log k’ on a carbowax column versus log k’ on a permethylsilicone column for a set of highly variegated solutes shows an overall correlation coefficient of 0.35 (see Fig. 9). However, when the right thermal programming conditions are used in the second dimension of 2DGC this correlation is broken to a considerable degree, spreading the solutes over more of the 2D separation space and producing chromatograms like those shown in Fig. 10. Although not explicitly stated Phillips realized that all one really needs is what we here call “local” orthogonality not “global” orthogonality. The fact that the solute retention pattern on the two phases is globally but not locally correlated means that the retention range of any particular mixture of compounds in any single fraction delivered from the first dimension column to the second dimension column is rather limited. As a result a shallow temperature program is all that is really needed over the course of the second dimension separation of that mixture to adequately spread the compounds out, yet ensure that all solutes elute from the second dimension column in a single run.
Clearly complete elution is essential to prevent carry-over and the ensuing confusion between sequential runs. Again, because of the global correlation in retention between the two phases, the initial temperature of each successive second dimension gradient can be systematically advanced by a small amount; in practice the final temperature in one second dimension run becomes the initial temperature in the next second dimension run. This amounts to an advancing isothermal elution mode, which is the GC version of the advancing isocratic elution mode discussed above. Given the success of this approach in 2DGC, it is rather remarkable that as yet so little attention has been paid to it in the context of 2DLC. Venkatramani, having worked with Phillips, and coworkers clearly have attempted to extend the principles developed in advancing isothermal 2DGC to 2DLC by tuning the organic solvent rather than the temperature [140]. A good deal more work is warranted in this area of 2DLC given the relative simplicity of the instrumentation required (compared to true gradient elution), and the potential for maximizing the orthogonality of RP phases, which for the most part, tend to show a high degree of correlation.
Bearing this in mind, the flexibility of 2DLC separations using true gradient elution in the second dimension, particularly for separations of molecules exhibiting very strong dependencies of retention on eluent composition such as peptides and proteins, should not be underestimated. The ability to change the initial and final eluent composition of each second dimension runs over large ranges in the volume fraction of organic solvent allows the user to very quickly scan these conditions when working with a new sample whose characteristics may not be well known. Nevertheless, the success of 2DLC using true gradient elution RPLC in the second dimension requires a very high degree of orthogonality between the phases used in the first and second dimensions, particularly when both are RP phases, as has been discussed throughout this review.
3.3 Detection Methods
The detectors used in 2DLC separations are basically the same type as used in 1D-LC separations. However, there is one overriding consideration-- speed! The detector is always coupled to the second dimension column and the second dimension column is always operated much faster than is a traditional 1D-LC separation. Thus, the detector has to be compatible with very narrow peaks in time (4σ < 1 second and more recently < 0.5 second) and thus if a multivariate detector is used it must have a very high scan rate. So far, the most widely used detectors are mass spectrometers (MS) and UV absorbance (DAD) detectors; however, electrochemical array detectors may well provide interesting additional selectivity and fluorescence detectors may provide much enhanced detection limits.
Many 2DLC studies are done using MS detectors, this is especially true of proteomic research. MS detectors are absolutely essential for proteomics since they allow for identification of peptides and thus proteins. Interestingly, while most chromatographers think of MS as simply one of a number of detectors, most proteomics researchers think of chromatography as simply one type of sample introduction system. The most commonly used MS detectors are matrix-assisted laser desorption ionization (MALDI) and electrospray ionization (ESI). However, MALDI detectors can not be used on-line with any 1D or 2DLC systems. The effluent has to be deposited on a microtitre plate every few seconds (or longer), with the matrix solution added subsequently. Thus, this detection method generally involves longer overall analysis times. ESI detectors are much more commonly used with both 1D and 2DLC systems. For the best sensitivity, nanoelectrospray is generally used. The typical flow rate is only about 20-40 nanoliters per minute. Thus, most LC systems use capillary columns in conjunction with ESI-MS, or a splitter is placed before the flow is introduced into the ESI detector. However, there are some limitations to these two MS detectors. First, the ionization process in ESI-MS is easily suppressed by the presence of salts, surfactants, ion pairing agents even inorganic ones like perchlorate or small organics like fluorinated carboxylic acids and most unfortunately also by other peptides when two peaks strongly overlap[184]. A very important practical consequence of the signal suppression effect is that the choice of mobile phase additives (i.e., buffers and organic solvents) is severely restricted compared to methods where UV detection is used [185].
Another significant practical barrier to the coupling of mass spectrometry with fast 2DLC is the slow m/z scanning speed of some mass analyzers. Commercial time-of-flight (TOF) instruments are available with scanning rates as high as 200 scans per second. Commercial single quadrupole instruments with m/z scanning rates of 10,000 amu/sec. (20 scans/s from m/z 100-600) have recently become available to meet the needs of high speed LC separations. However, triple quadrupole, and ion-trap type analyzers are currently too slow to provide more than a few spectra across the 0.5-1.0 second peak widths typical of fast 2DLC.
UV (DAD) detectors, on the other hand, have very fast scan rates (up to 100 scans/s) which is more than fast enough for a 1 s wide (4σ) peak. Probably the biggest advantage of UV detectors compared to MS detectors is their precision. A detailed study [186] of atmospheric ionization mass spectrometry in quantitative LC-MS indicated a relative precision in peak area on average three times poorer than that of a UV absorbance detector. In some cases the LC-MS had an RSD of nearly 30% compared to 4% for the absorbance detector for the same species under the same LC conditions. We anticipate that the ion spray MS being much less robust than atmospheric ionization detection. The difference between the means of two measurements required for statistical significance increases with the variance of the analytical measurement. Thus, real sample-to-sample differences that are overlooked in biological experiments that rely on quantitation by LC-MS alone may be revealed if more precise detectors are used. This is why many proteomics researchers employ both UV and MS detectors.
Other types of detectors are occasionally utilized. Schoenmakers[74] and Coulier [164] have each used online-FTIR for the characterization of polymers. Evaporative light-scattering detection (ELSD) is another frequent choice for polymer characterization [130]. Fluorescence detection has been used for in proteomic studies [187,188]. It may well be that fluorescence having better detection limits than absorbance may provide very different information.
3.4 Data Handling and Analysis in 2DLC
The mammoth multivariate data sets obtained from 2D chromatographic separations, which can be on the order of millions of data points, offer both huge challenges and opportunities for chemical analysis. These data sets require specialized data analysis methods to extract the maximum amount of information. For example, one issue that often arises in proteomic and metabolomic studies is the detection and quantification of low abundance constituents in the presence of a number of large, dominating peaks. Moreover, these samples can contain hundreds or even thousands of constituents [146,189-191]. The maximum peak capacity (ideal peak capacity, as calculated using Eq 1) of state-of-the-art 2DLC separations on the 30-60 minute timescale is only on the order of 500-2000 [10], thus it is all but certain that the number of constituents in a complex sample will greatly exceed the ability of the separation method to resolve even a minority of the species present. The enormous numbers of co-eluting constituents that result greatly increase the need for multivariate detectors and sophisticated data analysis. The use of a multivariate detector such as a DAD or MS in conjunction with chemometric data analysis can improve the analytical power of chromatography in two distinct ways:
Just as one can analyze a homogeneous, multi-constituent mixture by measuring absorbances (or intensities) at several wavelengths (or m/z ratios) the same can be done for a chromatogram of a mixture, where the peaks are incompletely resolved. This method is known as curve resolution [192,193] and is quite distinct from curve fitting incompletely separated peaks based on data obtained at a single wavelength by application of knowledge of a peak shape equation [194].
By appropriate application of more advanced chemometric methods one can further increase the accuracy of analysis and perhaps more importantly find additional constituents by imposing physically realistic constraints on the chromatographic peaks, specifically that the peak representing each constituent must be unimodal (i.e., has one and only one maximum) and non-negative. Such constraints can be applied to both chromatographic dimensions.
The power of multivariate detection is illustrated in Fig. 33 which is a second dimension chromatogram plotted at four different wavelengths. For the peaks between 2-4 s, the plots at 201 and 213 nm (blue and green traces, respectively) clearly indicate the presence of at least three constituents whereas this would not be so obvious in a chromatogram at a single wavelength. In addition, for the peaks at 14.5 and 15.3 s, the two additional wavelengths, 255 and 315 nm (the red and pink traces, respectively), show a significant improvement in the ability to distinguish these two peaks.
Figure 33.
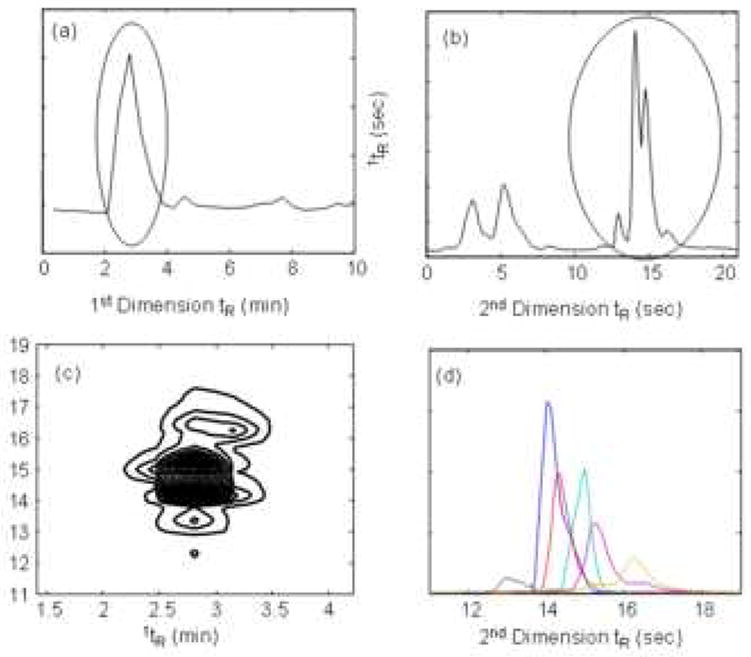
Demonstration of the ability of the PARAFAC method to find overlapped constituents in a 2D chromatogram. (a) First dimension separation of a corn seedling extract; (b) second dimension chromatogram; (c) contour plot of the data after two-dimensional separation; and (d) resolved constituent profiles after PARAFAC analysis.
3.5 Chemometric Data Analysis
Chemometric data analysis methods can significantly increase the amount of information that can be obtained from 2DLC chromatograms and in essence enhance the “effective peak capacity” of a chromatographic separation. In the context of 2DLC, chemometric techniques can be used to:
Resolve overlapping chromatographic peaks.
Correct uncontrolled shifts in retention time.
Take full advantage of multi-channel detectors such as MS and DAD.
Remove background
Increase signal/noise.
Because it is the more mature technology, much of the current literature in chemometrics and two-dimensional separations deals with 2DGC separations with both single channel detectors (e.g., flame ionization (FID)) and multi-channel detectors (e.g., MS). However, the data structures in 2DLC and 2DGC are essentially the same and so many of the same techniques are applicable to both types of separations, especially for single channel detectors and mass spectrometric detectors.
The data obtained from comprehensive 2D separations are multivariate in nature, and can have different levels of complexity. For a comprehensive 2D separation with a single channel detector (e.g., a fixed wavelength detector), the data is a two-way matrix that contains intensity information as a function of the first and second dimension retention times. This matrix can be represented by a single square as shown in Fig. 32. If a multi-channel detector is used (e.g., a DAD or MS), the data form a three-way array with intensity information as a function of first and second dimension retention times and wavelength or m/z values (spectral information). The stack of squares in Fig. 32 labeled as Sample 1 represents a three-way array. Finally, when several samples are to be analyzed, they can be analyzed individually but even more information can obtained if they are combined into a single four-way data set, as long as common components are present in each of the samples. This essentially improves the signal-to-noise ratio by averaging the peak responses across all samples. Fig. 32 shows the arrangement of a four-way data set, where the intensity values are arranged as a function of first dimension retention time (1tR), second dimension retention time (2tR), spectral information (m/z or wavelength), and sample number or concentration.
Figure 32.
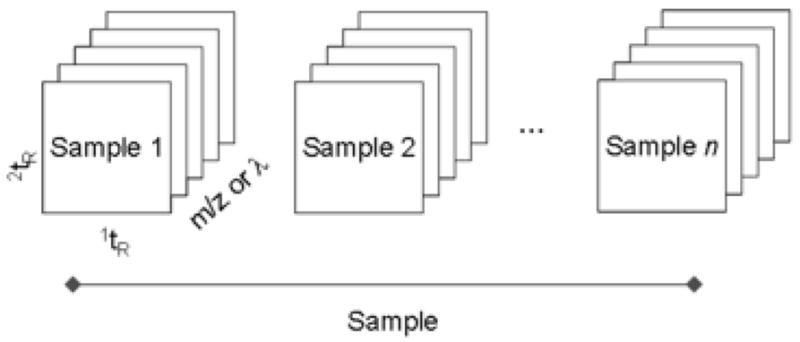
Data structure for 2D chromatographic data. The data dimensions include first and second dimension retention times and may include spectral information (m/z or wavelength) and/or sample number or concentration.
The chromatogram in Fig. 33(a) shows the power of chemometric methods for resolving overlapped signals within a 2D chromatogram. The sample analyzed in this chromatogram was an extract of the corn mutant orp (orange pericarp [195]) analyzed by 2DLC-DAD as described in reference [10]. A section of the first dimension separation for this sample is shown in Fig. 33(a); only a single peak is evident. Fig. 33(b) shows the second dimension chromatogram obtained by sampling the first dimension peak circled in 33(a), and the addition of the second chromatographic separation immediately increases the number of constituents that are evident. These data are also represented as a contour plot in Fig. 33(c). There are several constituents that overlap in both chromatographic directions and it would be difficult, if not impossible, to integrate or otherwise quantify these peaks. Application of the PARAFAC method [196] (parallel factor analysis, which will be described below) allows the overlapped constituents to be resolved. The individual constituent profiles of the overlapped peaks circled in 33(b) are shown in Fig. 33(d). Each colored trace in Fig. 33(d) shows the resolved profile of an individual constituent. It is clear that there are several small peaks hidden in the group of four peaks, and the chemometric analysis allows those constituents to be resolved and ultimately quantified. This demonstration is an example of the utility of the chemometric methods for extracting information from the three dimensional datasets. In essence, the peak capacity of the 2DLC has been enhanced by addition of the spectroscopic dimension. The ability of chemometric methods to enhance the peak capacity is very dependent on the differences in the spectroscopic characteristics of the solutes. In the specific example shown here, a 50 % increase in number of detectable peaks was obtained.
3.5.1 “Effective” peak capacity
It is important to estimate the increase in “effective” peak capacity that might be achieved when a multi-channel detector is used for detection subsequent to a 2D separation. Frahm et al. have investigated the “effective” peak capacity or accessible proteomic space for 2DLC separations coupled to MS detection [197]. Their analysis explored the separation space available for 2DLC-MS analysis of peptides, and considers the pattern of the mass excess for peptides as well as the resolving power of the MS analyzer (Fourier transform ion cyclotron resonance (FT-ICR) and time-of-flight (TOF)). They concluded that when the mass range of 500-5,000 Da (which is where most peptides fall) is considered, the TOF can provide an “effective” peak capacity of 2,400. Results for the higher resolution FT-ICR approach are even more impressive but vary with the magnetic field strength thus the “effective” peak capacities are 15,000, 20,000 and 25,000 for 7, 9.4 and 12 Tesla instruments, respectively.
When DAD is used for detection in 2DLC, the approach described by Frahm et al. cannot be used because it is based on the highly selective nature of MS detection. For 2DLC-DAD analyses, Porter et al. based their results on multivariate chemometrics because unlike mass spectra UV-visible spectra are very highly overlapped [196]. This is evident in the study of the constituents of corn seedlings which encompassed some 95 different spectra. Of 95 spectra seven of the most dissimilar spectra are shown in Fig. 34. In this case, the “multivariate selectivity” was used to gauge the “effective” peak capacity added by using the DAD data. The multivariate selectivity is defined as the ratio of the precision of measurement of the constituent of interest in the sample mixture relative to the precision of measurement of a pure sample of that constituent [198-200]. By this definition, a multivariate selectivity value of 1 indicates that the analyte can be quantified in a mixture with exactly the same precision as in a pure sample. Chromatographically this is equivalent to perfect, that is “baseline”, resolution.
Figure 34.
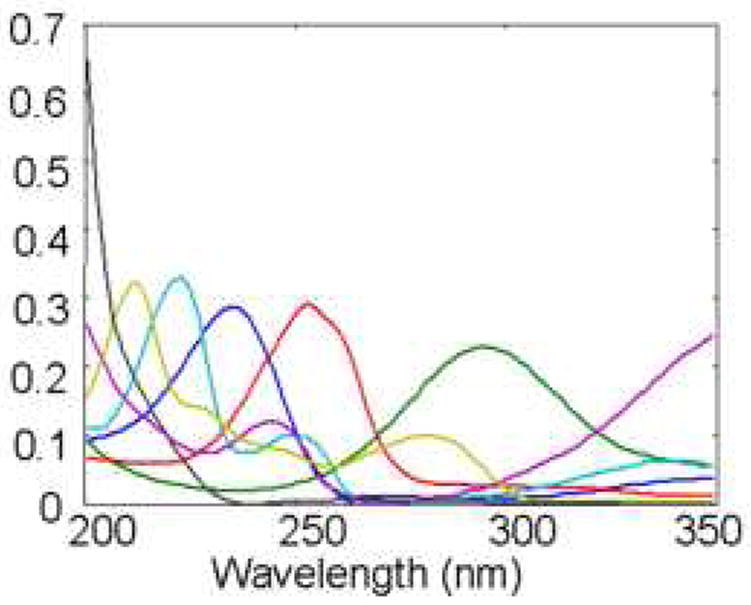
Seven spectra chosen from the 95 constituents resolved from the corn seedling data set. These seven spectra are the most dissimilar found in the sample set.
Recently [201], the “effective” peak capacity of the DAD detector per se was compared to that of 1D chromatography. Specifically, randomly constructed UV-visible mixture spectra of the corn seedling constituents were selected. In essence, the peak capacity of an ideal chromatogram was systematically varied and the change in the multivariate selectivity of each of these chromatograms was determined. These results allowed for the multivariate selectivity to be calibrated against the “effective” peak capacity. The multivariate selectivity resulting from curve resolution of just the spectra of the mixtures, obtained as described above, was assessed. Mixtures of 2, 3, 4, 6 and 8 constituents were considered. A mixture was deemed “analyzable” as long as the multivariate selectivity showed that the precision of analysis of the mixture was no more than about 3-fold worse than for the analysis of the pure substance. In this way, the “effective” peak capacity of the DAD was seen to vary from about 2 to 8 for the corn constituents. This result is much lower than the peak capacity of MS as applied to peptides, as would be expected based on the lower selectivity, resolution and informing power of UV spectra. It must be understood that the ability of the DAD to add peak capacity is totally contingent on the ability to differentiate between the spectra of two constituents. This is easily illustrated with the corn data set analyzed in reference [196]. In Fig. 35 we show four sets of spectra comprised of three constituents each. It is clear that some constituents are essentially spectroscopically indistinguishable. Mixtures containing these constituents would have very low multivariate selectivity and thus provide no enhancement in “effective” peak capacity. Table 11 shows the calculated multivariate selectivities of the mixtures shown in Fig. 35. Recall that a multivariate selectivity close to one indicates that a constituent can be quantified in a mixture with similar precision to the pure substance. This visual example shows that when spectra are very similar (as in Fig. 35b) the multivariate selectivity, and hence the added “effective” peak capacity, for the mixture is very low.
Figure 35.
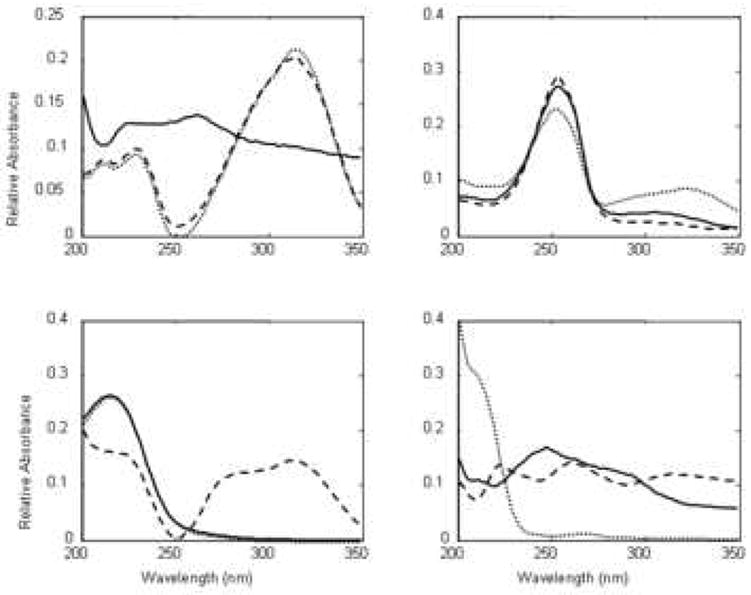
Various spectra taken from the set of 95 spectra resolved from the corn data illustrating the differences and near identity of some of the spectra.
Table 11.
Multivariate selectivities for mixtures comprised of the spectra shown in Fig. 35.
| Constituent 1 (dashed line) | Constituent 2 (solid line) | Constituent 3 (dotted line) | Average Selectivity | |
|---|---|---|---|---|
| Mixture a | 0.023 | 0.232 | 0.025 | 0.093 |
| Mixture b | 0.047 | 0.036 | 0.132 | 0.072 |
| Mixture c | 0.735 | 0.016 | 0.016 | 0.256 |
| Mixture d | 0.296 | 0.288 | 0.884 | 0.489 |
3.5.2 Multivariate curve resolution
Multivariate curve resolution (MCR) techniques are a family of methods used to resolve overlapped responses from analytical instrumentation, and these approaches have been frequently employed in the analysis of 2D separations. MCR methods such as PARAFAC, trilinear decomposition (TLD) [202-204], alternating least squares (ALS) and the generalized rank annihilation method (GRAM) [205] are all useful for analyzing two-dimensional separations. Each of these techniques is based on some form of linear (or approximately linear) additive model for the chromatographic responses. The simplest of these models, the bilinear model, can be expressed as
| (19) |
where dij represents the observed response at the ith point in the first dimension chromatogram and at the jth point in the second dimension chromatogram [206]. The goal of all multivariate curve resolution approaches is the resolution of the individual constituents (analytes) into their corresponding pure constituent chromatograms. In this case, N independent 1c vectors each represent a pure constituent chromatogram in the first dimension separation, and N independent 2c vectors each represent the corresponding chromatograms in the second dimension separation.
GRAM has been used extensively to analyze 2DGC separations with either MS or FID detection. GRAM analysis is based on the model shown in Eq. 19, where two 2D chromatograms are analyzed – one for an unknown sample and the second containing one or more of the analytes at known concentrations [206]. Synovec and coworkers have published several studies using GRAM applied to 2DGC separations for the analysis of fuels [207-209]. The quantitative analysis of methyl tert-butyl ether (MTBE) has been demonstrated using GRAM to resolve 2DGC-MS data [209]. 2DGC-FID was used to analyze aromatic isomers in jet fuel [208] and to quantify ethylbenzene and m-xylene in modified white gasoline [207]. Fraga and Corley demonstrated the use of GRAM for the quantitative analysis of overlapped peaks in 2DLC [205]. They used single wavelength UV detection to analyze and quantify the constituents contained in an aqueous test mixture of p-chlorobenzoic acid, benzoic acid, uracil, maleic acid, and phenyl phosphoric acid.
PARAFAC is a very powerful curve resolution method that can be applied to resolve overlapped peaks in a two-dimensional chromatogram. PARAFAC is a technique that can be used to resolve individual constituent profiles of three-way and higher order data sets. In the case of 2D chromatographic data, for example, the individual constituent profiles will consist of a first dimension chromatogram, second dimension chromatogram, and spectral profiles when a multi-channel detector is used. Fig. 33 shows an example of the resolved second dimension profiles for a 2D chromatogram obtained using the PARAFAC model. Both PARAFAC and GRAM are based on linearly additive models as shown in Eq. 19, but GRAM is non-iterative and tends to be computationally faster. However, the application of GRAM to three-way analysis is limited because only two samples can be analyzed at a time making PARAFAC the more useful algorithm for the analysis of higher order data. The PARAFAC method is usually implemented using an alternating least squares algorithm. The iterative nature of the algorithm usually means that the results are superior to those obtained by non-iterative methods such as GRAM [206].
PARAFAC has been used to analyze three-way 2DGC-MS arrays by resolving overlapped constituents and identifying specific spectral signals in the data [204]. van Mispelaar et al. compared the performance of PARAFAC to that of conventional integration for the quantification by 2DGC-FID [210]. They found that while conventional integration of the chromatograms resulted in higher precision and accuracy, the PARAFAC analysis was much faster. An application of 2DGC-MS to metabolomic studies was described by Mohler et al. who analyzed the metabolites of fermenting and respiring yeast cells [211]. They found that the resolved PARAFAC profiles of the overlapped signals could be used to reconstruct the 2D chromatograms, which were then integrated to obtain quantitative information. Porter et al. [196] took advantage of the full four-way data structure of 2DLC-DAD to quantitatively analyze extracts of corn seedlings. By doing so, specific analytes could be targeted, but unknown peaks in the chromatograms could also be resolved and quantitatively compared between samples.
Porter et al. also used PARAFAC as a technique for removing background and improving S/N for low abundance constituents in a 2D chromatogram. Fig. 36(a) shows a selected section of a 2D chromatogram of a wild-type corn seedling extract. This chromatogram is very noisy with a high background, and two very small peaks are barely detectable. Fig. 36(b) shows the reconstructed chromatogram following PARAFAC analysis with the background constituents omitted. The result of applying the algorithm was to smooth the data and resolve the background constituents from the analyte peaks, vastly improving the S/N of the two peaks.
Figure 36.
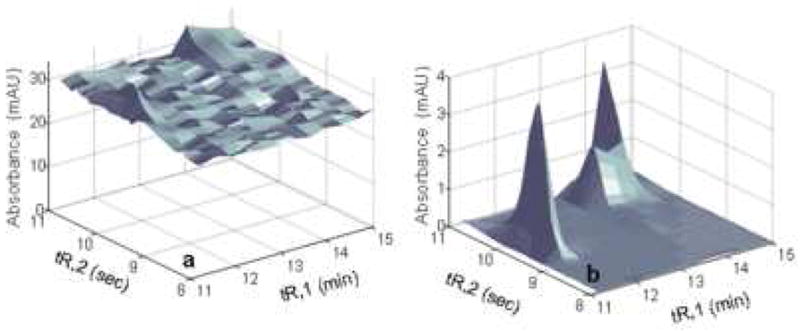
Comparison of chromatograms at 220 nm of the selected section of corn data from ref.[196]. (a) raw data; and (b) PARAFAC fitting results with background constituents omitted.
Fig. 37 shows the retention times for the 95 constituents that were resolved in the four-way data set analyzed in the same work. The color coded dots correspond to the different samples in the data set (mutant or wild-type corn seedlings, or standards) where constituents with a S/N of at least 10 were found.
Figure 37.
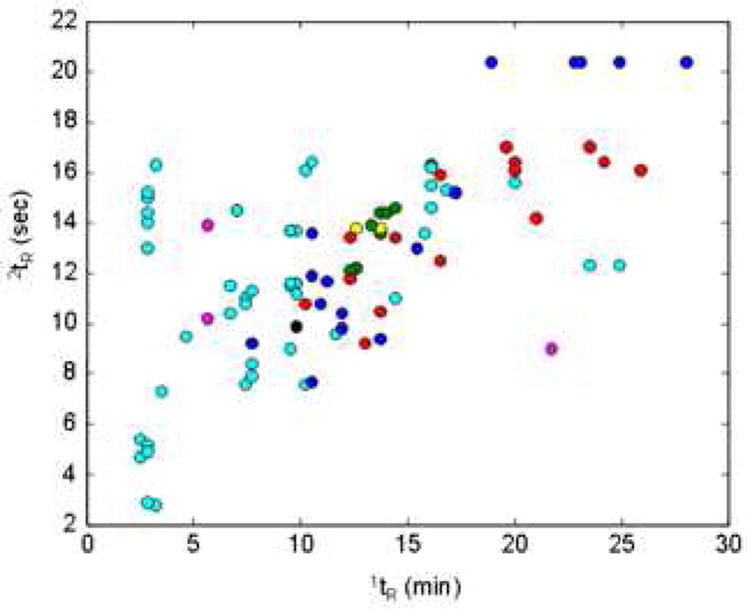
All peaks resolved by the PARAFAC algorithms. Blue – mutant only; green – wild type only; red – standard only; cyan – mutant and wild type; magenta – mutant and standard; yellow – wild type and standard; black – mutant, wild type, and standard. From ref. [196].
3.5.3 Multilinearity and retention time alignment
All of the MCR method discussed here require the data to be precisely aligned in terms of both chromatographic time scales and spectral signatures. Multilinearity (i.e., bi- tri- or quadri-linearity for two-way, three-way, and four-way data respectively) in multivariate data requires that the instrument responses of a pure constituent in all domains (i.e., both chromatographic time domains and the spectral domain) are unique, consistent, and independent of the presence of other species [212]. By this definition, all of the information concerning the relative amounts of different constituents is contained in one mode or domain. This requirement means that for four-way data (as depicted in Fig. 32) the resolved profiles for the first and second dimension chromatograms and for the spectra should be the same over the entire time course of data acquisition for all samples. The relative amount of each constituent in each sample would be contained in the fourth mode (sample number or concentration). Clearly, in order for a pure constituent profile to be consistent between samples, a high degree of retention time precision is absolutely required. Due to the largely uncontrollable shifts in retention time that can affect chromatographic separations, analysis by MCR methods is often difficult. Imposing multilinearity on a data set which deviates from this requirement can lead to distorted peak shapes and poor precision in quantification [210,213]. Run-to-run retention time shifts have been a major impediment to the implementation of chemometric methods for the analysis of two-dimensional chromatograms.
Retention time alignment algorithms (also called time warping algorithms) for one-dimensional chromatographic data abound and are so important that some have been patented [11,214-220]. However, the retention time shift in two-dimensional separations can occur in both chromatographic dimensions, creating the need for new methods to align the data. Synovec and coworkers have published several studies of warping algorithms for comprehensive two-dimensional separations [217,221-223]. Fraga, et al. [221] presented a stepwise alignment function that was based on a previous report of a one-dimensional alignment function [213]. The one-dimensional function was extended to peak shifts on two time axes, with the shifts that occur on column 1 treated as being independent of the shifts that occur on column 2. More recently, Johnson et al. [222] reported the application of an retention time alignment algorithm based on windowed rank minimization alignment. The results for the quantitative analysis of percent volume of napthalenes in jet fuel were better correlated with the results from the standard reference method than the results obtained with the unaligned data. Pierce, et al. [217,223] also introduced an alignment algorithm that analyzes small, user-defined windows of the data one at a time and shifts the data in a scalar fashion. The retention time precision was improved significantly with the application of the alignment algorithm, as were the quantitative results for the known standards.
A limitation of the warping algorithms that have been published recently is that they are only applied to a single channel (a single wavelength or mass channel) at a time. When all of the spectral information of the detector is used (as in reference [196]), an alignment algorithm that simultaneously aligns all detector channels is necessary in order to avoid loss of information. Such algorithms have not been reported as yet, but there will obviously be a great need for them as the higher order data arrays afforded by two-dimensional separations become more common.
3.5.4 Image analysis
Another way to analyze two-dimensional chromatograms is to treat the single channel data as an image and use image analysis tools to extract information. Hollingsworth, et al. [224] have recently compared several different methods for visually comparing 2DGC data sets as images, using only the retention time data. In this work they used both gray scale and colorized difference images to determine the relative concentration differences between samples. However, the methods are not quantitative; they are only useful for qualitatively comparing samples. Reichenbach, et al. [225] used image analysis methods for removing background in 2DGC-FID chromatograms. The algorithm makes use of chromatographic dead bands at the beginning and end of each second dimension separation as well as the statistical properties of the noise typically found in GC-FID data.
3.5.5 Partial least squares
The trilinear partial least squares (tri-PLS) algorithm was introduced by Bro for calibrating multi-way data sets with independent and dependent variables [226]. The advantage of this approach relative to PARAFAC is that it is specifically designed for the quantification of selected components. Prazen et al. [227] applied tri-PLS to three-way 2DGC-FID data to quantify the aromatic and naphthene constituents in naphtha. They showed that chemometric techniques could be used to resolve overlapped peaks, so that full peak resolution was not needed. They compared the quantitative prediction of aromatic and naphthene constituents in naphtha samples to the values obtained using a standard one-dimensional GC separation. For both results, there was good agreement between the standard method and the 2D method. Johnson et al. [222] also showed the application of tri-PLS to the quantitative determination of naphthalenes in jet fuel by 2DGC-FID. Using a retention time alignment algorithm (vide supra) and jet fuel samples with known naphthalene concentrations, they were able to obtain good agreement between experimental results and the standard concentrations.
3.5.6 Other data analysis methods
van Mispelaar et al. [228] have discussed several methods for analyzing the two-dimensional chromatograms obtained by 2DGC-MS. They classified three different methods: target-compound analysis and group-type analysis, in which prior knowledge of the sample is required, and fingerprinting, which is an unsupervised technique. Target-compound analysis, as the name implies, indicates converting retention times or indices and spectra into peak identities and using the peak area information to determine the amounts of specific target analytes. The goal of group-type analysis is to obtain quantitative information for a specific chemical class of compounds. The last approach, which relies heavily on multivariate analysis, correlates the “fingerprint” (chromatogram) of an unknown to a standard to determine which constituents differ between the samples. This method does not require any a priori knowledge of the constituents. It is particularly appealing in systems biology, where biomarkers of interest may be hidden in a chromatogram amongst many unknown peaks and correlations between “diseased” and “healthy” samples need to be found.
Sinha et al. [203] have presented the so-called “DotMap” method for the analysis of 2DGC-MS data, which utilizes all of the spectral information available from a multi-channel detector. The DotMap algorithm matches spectral signals within a chromatogram to a target analyte spectrum. It works by calculating the matrix dot product of a target mass spectral signal and the mass spectral signal at each point in the chromatogram; the magnitude of this dot product is related to the similarity of the two spectra, thus a larger dot product indicates higher correlation between the spectra. The location in two-dimensional space where there is a peak that matches the analyte spectrum can be found by making a contour plot of the dot-product matrix. This method is useful for targeting specific analytes within a chromatogram.
3.6 Some Important Practical Issues
There are a quite a few practical factors that require very serious consideration by those interested in fully achieving the potential benefits offered by 2DLC. The following is an attempt to capture the most significant among them, based on our experience in this area. First, one must recognize that the number of operational parameters (column dimensions, types, flow rates, eluent composition, gradients and temperatures) available increases by far more than a factor of two as one moves from a 1D to a 2D separation. This means that optimization of the 2D systems can quickly become overwhelming. For example, in 1DLC, choosing the HPLC column diameter is a relatively straightforward task, dictated by the optimum flow rate range of the instrument, the available sample volume, and consideration of extra-column broadening factors. The choice of first dimension column diameter for use in a 2DLC system is far more complicated. In this case one must consider the trade-off between the optimum first dimension flow rate and the amount of sample that is injected into the second dimension column for each second dimension run. Also, one must consider the ratio of column diameters in the two dimensions because of significant analyte dilution effects as discussed thoroughly by Schure and coworkers [229]. The particular 2DLC scenario studied by Schure involved isocratic separations on 4.6 mm i.d. columns in both dimensions. These calculations indicate the peaks eluting from the first dimension column are diluted by a factor of 5.6 as they migrate through the second dimension column (note that this dilution factor is heavily dependent on the exact configuration of the 2D system). This has the very real practical consequence of raising (i.e., worsening) the limit of detection for a given analyte by a factor of 5.6. We have found that the use of gradient elution in the second dimension of our RP × RP system largely mitigates this dilution problem. For example, in 2DLC separations of a corn seedling tissue extract [10], 34 μL injections of first dimension effluent were made onto a 2.1 mm i.d. second dimension column operated at 3 mL/min. (50 μL/s). Average 4σ peak widths observed in the second dimension of actual separations of the corn extract were about 1 s, corresponding to a peak volume of 50 μL. Thus the dilution factor for the second dimension of this 2DLC system is in the range of 1-2, and the limit of detection of the 1D separation is not significantly compromised by extending the separation to two dimensions. This is a result of the significant analyte focusing that occurs at the second dimension column inlet, which emphasizes the attractiveness of gradient elution in the second dimension and the need to carefully match first and second dimension columns and mobile phases so that the potential of the focusing effect can be realized.
There are far more trade-offs to consider in the 2D case than in 1D separations because so many of the operational parameters are highly interdependent. The importance of a given parameter in the 2D system is also dependent on the goals of the analytical method. Is the primary goal of the analysis to maximize the peak capacity of the analysis in order to separate as many constituents as possible, or is the goal a more targeted approach, focused on the resolution and quantitation of specific constituents in a complex mixture?
Among the most limiting parameters in designing a 2DLC separation is the selection of the stationary phases and column formats to be used in the first and second dimension separation. The importance of uncorrelated retention energetics has been discussed at length above. In the specific case of 2DLC systems using RPLC in both dimensions, it is critical that the retentivity of the second dimension column be much higher than that of the first dimension column. This is required because: 1) A relatively large volume of sample will be collected and injected into the second column, 2) To minimize peak broadening this sample should be “focused” at the inlet of the second column thus it must be delivered in an eluent which is weak compared to the initial mobile phase composition used on the second column. Most of our own work has centered on 2DLC separations using true gradient elution in the second dimension separation, for two main reasons. First, the peak capacity is better in gradient as compared to isocratic elution. This is actually more important in the second dimension than in the first because at relatively short first dimension gradient times (i.e., less than one hour) the first dimension peak width (i.e., 10-20 seconds) is less than the typical sampling time used to collect first dimension effluent (i.e., 20 seconds to several minutes). Under these circumstances the peak capacity of the first dimension is largely determined by the total number of sample aliquots taken for injection into the second column and not by the inherent peak bandwidth, as was discussed above. Second, gradient elution is the best available mechanism for achieving peak focusing. Temperature is not very effective in RPLC as a means of modifying retention, as a temperature increase of 50 °C typically decreases retention factors by only about a factor of three.
An additional issue when considering the use of monolithic columns in 2DLC systems it is important to recognize that the availability of these columns is limited to capillary columns with inner diameters less than 1 mm, or conventional 4.6 mm i.d. analytical scale columns; monoliths with diameters in the 1-2 mm range remain elusive [230]. The use of these columns in a 2DLC system therefore requires appropriate instrumentation to avoid serious extra-column broadening in the case of capillary columns, or extraordinarily high flow rates in excess of 10 mL/min. if 4.6 mm i.d. columns are to be used for fast 2DLC separations.
Finally, several reports concerning the optimization of 2DLC systems have promoted the use of very short (i.e., 1 cm) columns packed with small particles (e.g. sub-three micron diameter) [88,231]. There are two complicating factors to consider in the use of ultra-short columns. First, detailed studies by Guiochon and coworkers on the heterogeneity of packed beds [232,233] suggest that the use of such short columns may be problematic due to heterogeneity of the bed near its ends and result in significantly lower than expected plate counts. Also, in our experience, even if secondary flow is considered [234], we have not been able to obtain accurate predictions of extra-column broadening in narrow (< 0.007 in. i.d.), short (< 30 cm) pieces of connecting tubing that are required for use with columns providing extremely low peak variances (in time and volume) [105] using the best available models [235,236]. In the absence of accurate experimental data in either of these areas it remains difficult to understand whether the predicted advantages of such short, small particle columns can actually be realized in the practice of 2DLC. Second, the theoretical studies of ultra-short columns have not considered the effect of extra column broadening in the detection processes at all and only to a limited extend for the injection process [231].
4. THE FUTURE OF 2DLC
Having been intimately involved in the development of fast high temperature 2DLC over the past several years, we would like to provide our perspective on some possible improvements we may see in the next few years. With the exception of proteomics applications, 2DLC is far from routine and lags well behind 2DGC. There are several keys areas which need improvement before the technique can move from the domain of expert chromatographers into the domain of skilled practitioners of high performance separations.
4.1 Methodology
The large majority of conventional 1D RPLC is done using acetonitrile or methanol as the organic solvent. This is due in large part to the historical dominance of UV-visible absorbance detectors where the rather low UV cutoff wavelength of acetonitrile and methanol as well as their low viscosity make them the logical choice of organic modifier for most applications. In 2DLC this requirement of low UV cutoff does not exist in the first dimension of the system because the first dimension eluent elutes near the dead time of the second dimension column when the reversed-phase mode is used, and therefore does not interfere with the majority of the 2DLC separation. This fact invites the use of ‘unconventional’ organic solvents such as strong hydrogen bond donors and acceptors in the first dimension separation which may be very useful in changing chromatographic selectivity to allow spreading of chromatographic peaks across the entire 2D separation space. Furthermore we point out that the high viscosity of these solvents is not a problem on the first dimension column as it is typically operated at a rather low linear velocity to avoid placing too great a demand on the speed of the second dimension and volumes injected onto the second column.
Another area that has not been explored in the context of 2DLC but may be very useful is temperature programming as a replacement for organic solvent gradients. In principle, the use of a temperature program in the first dimension of a 2DLC system using RPLC in both dimensions would allow the use of low levels of organic solvent in the first dimension separation, thereby allowing easier ‘focusing’ of analytes as they are injected into the second dimension column [237,238]. At least one company currently produces an instrument capable of reproducible temperature programs for LC separations on timescales that would be useful in the first dimension of a 2DLC system [239]. The potential use of temperature programming in the second dimension of a 2DLC system is also attractive because it would eliminate the instrument-related problems associated with excessive delay volumes and forming reproducible organic solvents on the sub-minute timescale. However, we are not aware of any temperature programming work in LC on this timescale and additionally temperature programming will likely not allow good focusing in LC.
4.2 Instrumentation
The biggest limitation to ultra-fast gradient elution RPLC, which we have used in the second dimension of 2DLC systems for proteomics [132] and metabolomics [10] applications, is the poor performance of the pumping systems available for forming the solvent gradients used in this mode of gradient elution. Specifically, we have shown that excessive delay volumes severely limit the throughput of ultra-fast gradient elution separations [240], and we have developed an approach involving two nominally identical binary pumps in the second dimension of a 2DLC system to reduce the effective delay volume to near zero (i.e., ca. 10 μL) [132]. Unfortunately in our experience the fluid mechanical properties of these nominally identical systems are sufficiently different that great care has to be taken to ensure alignment of chromatograms in consecutive second dimension chromatograms [28,241]. The development of very low delay volume gradient pumping systems will significantly improve and simplify the application of ultra-fast gradient elution separations in the second dimension of 2DLC systems.
4.3 Columns
Development of novel column technologies will be critical to future advances in 2DLC. The extensive characterization of nearly 350 reversed-phase materials by Snyder and coworkers revealed that a large majority of these materials are far more similar than different. In other words, in the context of 2DLC there is tremendous redundancy in the selectivity of these phases, and there are relatively few combinations of phases that are sufficiently different to be useful in 2DLC given the strong dependence of the performance of the technique on the ability of the columns to spread constituents out across the entire 2D separation space. Our own approach to RP×RP and high temperature conditions in the second dimension further restricts the number of useful column combinations because the column used in the second dimension must have very different selectivity, be thermally stable and be highly retentive. This fact invites the development of new temperature-stable phases with very different selectivity compared to existing phases. Recent developments in high-performance monolithic columns [242], sub-three micron fully porous particles [243,244], and sub-three micron pellicular (superficially porous) particles [245] present exciting opportunities to further improve the speed and peak capacity of 2DLC. However, most of these materials are available with the traditional stationary phases (e.g. C8, C18, etc.) and have limited temperature stability.
4.4 Detection Methods
During the development of HPLC over the last four decades, improvements in detector speed have been made as the speed of HPLC itself was improved. Recently there have been many reports of sub-one second 4σ–peak widths in applications of both 1D and 2DLC, which have led to the recent introduction of photodiode array (DAD) UV detectors capable of full spectrum scanning at rates as sufficiently fast as 80 Hz from several manufactures. Our own work in 2DLC has centered on the use of DAD detection largely because of its low cost, high speed and excellent reproducibility relative to MS. Coupling very high speed, high performance 2DLC to mass spectrometry presents two formidable challenges. First, the scale of the instrumentation used for high speed 2DLC in our laboratory [10,132] and others [137] must be reduced considerably to reduce the flow rates exiting the second dimension of these systems from the 3-10 mL/min. range to a range that is more compatible with high performance electrospray ionization, for example (i.e., 10-100 μL/min.). Aside from this flow rate problem, the speed of mass spectrometry detectors relative to current 2DLC methods is also a problem. Although some time-of-flight instruments are capable of very high spectral acquisition rates [246], we are not aware of any commercially available tandem mass spectrometer capable of adequate rate of data acquisition for chromatographic peaks that are on the order of a half-second in 4σ width. To the chromatographer it is a happy irony that recent improvements in the speed of HPLC have led to the current situation wherein the speed of 2DLC is actually faster than many detectors and LC must be slowed down to make the two compatible. It is likely that this situation will not long persist.
4.5 Data Analysis
It is currently our view that the greatest impediment to the wide application of 2DLC by non-experts is the paucity of efficient, convenient and sufficient powerful data analysis tools. Although many software packages can be highly automated for the analysis of conventional 1DLC data, many chromatographers will agree that reviewing 1D data is often a highly visual process, and decisions are made based on subjective interpretation of chromatograms by, for example, simply overlaying chromatograms from different samples,. This sort of process is extremely difficult, if not impossible, in the case of 2DLC separations. Further, there are currently no commercially available data analysis packages that allow efficient analysis of 2DLC data. A recent review of the state of the art of 2DGC [16-19] makes it very clear that the cumbersome nature of current data analysis approaches remains a major obstacle to widespread adoption by non-experts. Considering that the development of 2DGC is easily ten years ahead of 2DLC, availability of efficient data analysis tools will undoubtedly remain a prominent obstacle to widespread adoption of 2DLC as well.
4.6 Applications
Finally, most applications of 2DLC have used the higher peak capacity of the technique compared to 1D methods to provide increased resolving power in separations of complicated samples like those encountered in proteomics and metabolomics. Typically these applications involve rather long analysis times in the range of several hours per analysis. Recent theoretical and experimental separations in this laboratory (work in progress) have shown, however, that in some situations the performance of 2DLC can be superior to that of 1DLC even at rather short analysis times of only 5-15 minutes. This invites further study into the question of whether 2DLC can be used to improve the speed of analysis of moderately complex samples containing tens, rather than hundreds or thousands of constituents. There is little question that if 2DLC can produce a higher peak capacity on the 5-10 minute timescale this will have a major impact on the future of LC, and on the process of method development in LC. This type of application of 2D separation has already been successfully demonstrated by the 2DGC community.
Finally we wish to point out that the real power of 2DLC may well lie not in the quantification of specific constituents or groups of analytes in a sample but in the characterization of exceedingly complex biological mixtures. Much of proteomic and metabolic research is centered on the search for specific “biomarkers” either for diagnostic purposes or for a sign of success in a treatment or process. In considering systems and issues as complex as whether a given member of a population has cancer (heart disease, etc.) or a propensity for the disease it may be more useful to classify samples based on holistic rather than reductionist grounds. This mindset is in the spirit of the development of ‘disease algorithms’ recently discussed by Zolg [247]. There is no doubt that multi-dimensional chromatography used in conjunction with multi-dimensional detectors offers so much more information relative to classical analytical methodologies as to constitute a change not merely in degree but in kind. The analytical holy grail sought for by Linus Pauling in his work in orthomolecular medicine may be in sight [248,249].
Figure 18.
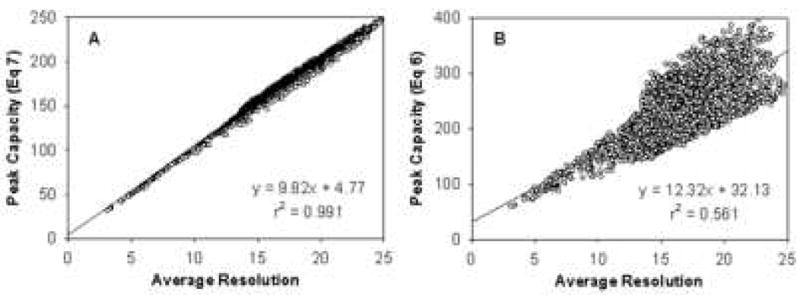
Correlation of (A) peak capacity calculated via Eq. 9 and (B) peak capacity calculated via Eqn. 8 with average resolution of eleven peptides. Each point represents one of the 2651 conditions generated in Monte Carlo simulation. The linear regression lines are also displayed. From ref. [66].
Figure 31.
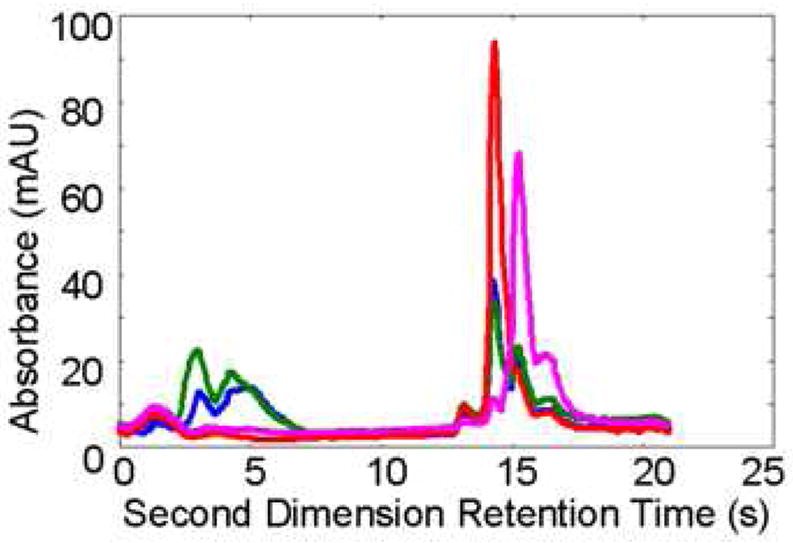
Second dimension chromatogram at 2.8 min for mutant corn extract, monitored at four different wavelengths, 201 nm (blue), 213 nm (green), 255 nm (red), and 315 nm (pink).
Table 4.
Theoretical Calculation of Optimized Peak Capacitiesa Obtained with Different Column Lengths. From ref. [37].
| Lb | tGc | ΔPd | nc**e | nc**/(L0.5)f |
|---|---|---|---|---|
| 3 | 12 | 4.3 | 111 | 64 |
| 5 | 20 | 7.0 | 160 | 72 |
| 7.5 | 30 | 10.4 | 211 | 77 |
| 10 | 40 | 13.8 | 253 | 80 |
| 15 | 60 | 20.7 | 324 | 84 |
| 20 | 80 | 27.5 | 383 | 86 |
| 25 | 100 | 34.4 | 435 | 87 |
Peak capacity based on the eleven peptides on a 2.1 mm i.d. 3.5 μm Zorbax SB-C18 column. LSST parameters of the peptides and van Deemter equation parameters were obtained on a 5.0 cm × 2.1 mm 3.5 mm Zorbax SB-C18 column. Conditions: 0.40 mL/min, 40 °C, gradient from 5% ACN to 45% ACN, 0.1% TFA present in the mobile phase (v/v), 0.30 mL dwell volume, HP 1090
Column length in cm
Gradient time in min
Pressure drop in MPa
Peak capacity calculated using Eq. 9
Ratio of peak capacity relative to the square root of the column length
Acknowledgments
This work was supported by a grant from the National Institute of Health (GM54585), Fellowship from the American Chemical Society Division of Analytical Chemistry to Dwight Stoll and various gifts from Agilent Technology and ZirChrom Separations. The authors also wish to thank Adam Schellinger and Joe Davis for many helpful discussions.
Footnotes
Publisher's Disclaimer: This is a PDF file of an unedited manuscript that has been accepted for publication. As a service to our customers we are providing this early version of the manuscript. The manuscript will undergo copyediting, typesetting, and review of the resulting proof before it is published in its final citable form. Please note that during the production process errors may be discovered which could affect the content, and all legal disclaimers that apply to the journal pertain.
References
- 1.Karger BL, Snyder LR, Horvath C. An Introduction to Separation Science. John Wiley and Sons; New York: 1973. [Google Scholar]
- 2.Giddings JC. Anal Chem. 1984;56:1258A. doi: 10.1021/ac00276a003. [DOI] [PubMed] [Google Scholar]
- 3.Guiochon G, Beaver LA, Gonnord MF, Siouffi AM, Zakaria M. J Chromatogr. 1983;255:415. [Google Scholar]
- 4.Schure MR. In: Multidimensional Liquid Chromatography: Theory, Instrumentation and Applications. Cohen SA, Schure MR, editors. Wiley; New York: 2008. [Google Scholar]
- 5.Erni F, Frei RW. J Chromatogr. 1978;149:561. [Google Scholar]
- 6.Bushey MM, Jorgenson JW. Anal Chem. 1990;62:161. doi: 10.1021/ac00201a015. [DOI] [PubMed] [Google Scholar]
- 7.Wolters DA, Washburn MP, Yates JR., III Anal Chem. 2001;73:5683. doi: 10.1021/ac010617e. [DOI] [PubMed] [Google Scholar]
- 8.Regnier F, Amini A, Chakraborty A, Geng M, Ji J, Riggs L, Sioma C, Wang S, Zhang X. LC-GC North Am. 2001;19:200. [Google Scholar]
- 9.Moore AW, Jr, Jorgenson JW. Anal Chem. 1995;67:3448. doi: 10.1021/ac00115a013. [DOI] [PubMed] [Google Scholar]
- 10.Stoll DR, Cohen JD, Carr PW. J Chromatogr A. 2006;1122:123. doi: 10.1016/j.chroma.2006.04.058. [DOI] [PubMed] [Google Scholar]
- 11.Stoll DR. Ph D Dissertation. Department of Chemistry, University of Minnesota; 2007. [Google Scholar]
- 12.Issaq HJ. Electrophoresis. 2001;22:3629. doi: 10.1002/1522-2683(200109)22:17<3629::AID-ELPS3629>3.0.CO;2-O. [DOI] [PubMed] [Google Scholar]
- 13.Issaq HJ, Chan KC, Janini GM, Conrads TP, Veenstra TD. J Chromatogr B. 2005;817:35. doi: 10.1016/j.jchromb.2004.07.042. [DOI] [PubMed] [Google Scholar]
- 14.Dunn WB, Bailey NJC, Johnson HE. Analyst. 2005;130:606. doi: 10.1039/b418288j. [DOI] [PubMed] [Google Scholar]
- 15.Dunn WB, Ellis DI. Trends Anal Chem. 2005;24:285. [Google Scholar]
- 16.Adahchour M, Beens J, Vreuls RJJ, Brinkman UAT. Trends Anal Chem. 2006;25:438. [Google Scholar]
- 17.Adahchour M, Beens J, Vreuls RJJ, Brinkman UAT. Trends Anal Chem. 2006;25:540. [Google Scholar]
- 18.Adahchour M, Beens J, Vreuls RJJ, Brinkman UAT. Trends Anal Chem. 2006;25:726. [Google Scholar]
- 19.Adahchour M, Beens J, Vreuls RJJ, Brinkman UAT. Trends Anal Chem. 2006;25:821. [Google Scholar]
- 20.Beens J, Brinkman UAT. Analyst. 2005;130:123. doi: 10.1039/b407372j. [DOI] [PubMed] [Google Scholar]
- 21.Ong RCY, Marriott PJ. J Chromatogr Sci. 2002;40:276. doi: 10.1093/chromsci/40.5.276. [DOI] [PubMed] [Google Scholar]
- 22.Shellie RA, Haddad PR. Anal Bioanal Chem. 2006;386:405. doi: 10.1007/s00216-006-0516-0. [DOI] [PubMed] [Google Scholar]
- 23.Jandera P. J Sep Sci. 2006;29:1763. doi: 10.1002/jssc.200600202. [DOI] [PubMed] [Google Scholar]
- 24.Shalliker RA, Gray MJ. Adv Chromatogr. 2006;44:177. doi: 10.1201/9781420027150.ch4. [DOI] [PubMed] [Google Scholar]
- 25.Evans CR, Jorgenson JW. Anal Bioanal Chem. 2004;378:1952. doi: 10.1007/s00216-004-2516-2. [DOI] [PubMed] [Google Scholar]
- 26.Dixon SP, Pitfield ID, Perrett D. Biomed Chromatogr. 2006;20:508. doi: 10.1002/bmc.672. [DOI] [PubMed] [Google Scholar]
- 27.Liu Z, Lee ML. J Microcolumn Sep. 2000;12:241. [Google Scholar]
- 28.Schellinger AP, Stoll DR, Carr PW. J Chromatogr A. 2005;1064:143. doi: 10.1016/j.chroma.2004.12.017. [DOI] [PubMed] [Google Scholar]
- 29.Schellinger AP, Carr PW. J Chromatogr A. 2006;1109:253. doi: 10.1016/j.chroma.2006.01.047. [DOI] [PubMed] [Google Scholar]
- 30.Liu Z, Phillips JB. J Chromatogr Sci. 1991;29:227. [Google Scholar]
- 31.Phillips JB, Liu Z. 5135549. US Patent. 1992
- 32.Liu Z, Sirimanne SR, Patterson DG, Jr, Needham LL. Anal Chem. 1994;66:3086. doi: 10.1021/ac00091a016. [DOI] [PubMed] [Google Scholar]
- 33.Venkatramani CJ, Phillips JB. J Microcolumn Sep. 1993;5:511. [Google Scholar]
- 34.Gaines RB, Ledford EB, Stuart JD. J Microcolumn Sep. 1998;10:597. [Google Scholar]
- 35.Kinghorn RM, Marriott PJ. J High Resolut Chromatogr. 1999;22:235. [Google Scholar]
- 36.Grall A, Leonard C, Sacks R. Anal Chem. 2000;72:591. doi: 10.1021/ac9911802. [DOI] [PubMed] [Google Scholar]
- 37.Wang X, Barber WE, Carr PW. J Chromatogr A. 2006;1107:139. doi: 10.1016/j.chroma.2005.12.050. [DOI] [PubMed] [Google Scholar]
- 38.Li JJ, Dallas AJ, Carr PW. J Chromatogr. 1990;517:103. [Google Scholar]
- 39.Venkatramani CJ, Xu J, Phillips JB. Anal Chem. 1996;68:1486. doi: 10.1021/ac951048b. [DOI] [PubMed] [Google Scholar]
- 40.Dalluge J, Beens J, Brinkman UAT. J Chromatogr A. 2003;1000:69. doi: 10.1016/s0021-9673(03)00242-5. [DOI] [PubMed] [Google Scholar]
- 41.Davis JM, Giddings JC. Anal Chem. 1983;55:418. [Google Scholar]
- 42.Davis JM, Samuel C. J High Resolut Chromatogr. 2000;23:235. [Google Scholar]
- 43.Martin M, Herman DP, Guiochon G. Anal Chem. 1986;58:2200. [Google Scholar]
- 44.Davis JM. Chromatographia. 1997;44:81. [Google Scholar]
- 45.Nagels LJ, Creten WL, Vanpeperstraete PM. Anal Chem. 1983;55:216. [Google Scholar]
- 46.Nagels LJ, Creten WL, Vanhaverbeke L. Anal Chim Acta. 1985;173:185. [Google Scholar]
- 47.Nagels LJ, Creten WL. Anal Chim Acta. 1985;169:299. [Google Scholar]
- 48.Davis JM. Anal Chem. 1991;63:2141. [Google Scholar]
- 49.Davis JM. J Sep Sci. 2005;28:347. doi: 10.1002/jssc.200401798. [DOI] [PubMed] [Google Scholar]
- 50.Liu SY, Davis JM. J Chromatogr A. 2006;1126:244. doi: 10.1016/j.chroma.2006.05.064. [DOI] [PubMed] [Google Scholar]
- 51.Samuel C, Davis JM. J Microcolumn Sep. 2000;12:211. [Google Scholar]
- 52.Oros FJ, Davis JM. J Chromatogr A. 1992;591:1. [Google Scholar]
- 53.Davis JM. Adv Chromatogr. 1994;34:109. [Google Scholar]
- 54.Jerkovich AD, Mellors JS, Jorgenson JW. LC-GC North Am. 2003;21:600. [Google Scholar]
- 55.Shen Y, Zhao R, Berger S, Anderson GA, Rodriguez N, Smith RD. Anal Chem. 2002;74:4235. doi: 10.1021/ac0202280. [DOI] [PubMed] [Google Scholar]
- 56.Shen Y, Zhang R, Moore RJ, Kim J, Metz TO, Hixson KK, Zhao R, Livesay ER, Udseth HR, Smith RD. Anal Chem. 2005;77:3090. doi: 10.1021/ac0483062. [DOI] [PubMed] [Google Scholar]
- 57.Luo QZ, Shen YF, Hixson KK, Zhao R, Yang F, Moore RJ, Mottaz HM, Smith RD. Anal Chem. 2005;77:5028. doi: 10.1021/ac050454k. [DOI] [PubMed] [Google Scholar]
- 58.Murphy RE, Schure MR, Foley JP. Anal Chem. 1998;70:1585. doi: 10.1021/ac980719d. [DOI] [PubMed] [Google Scholar]
- 59.Bracewell RN. The Fourier Transform and its Applications. McGraw-Hill; New York: 1986. [Google Scholar]
- 60.Seeley JV. J Chromatogr A. 2002;962:21. doi: 10.1016/s0021-9673(02)00461-2. [DOI] [PubMed] [Google Scholar]
- 61.Horie K, Kimura H, Ikegami T, Iwatsuka A, Saad N, Fiehn O, Tanaka N. Anal Chem. 2007;79:3764. doi: 10.1021/ac062002t. [DOI] [PubMed] [Google Scholar]
- 62.Nagels LJ, Creten WL. Anal Chem. 1985;57:2706. [Google Scholar]
- 63.Dondi F, Kahie YD, Lodi G, Remelli M, Reschiglian P, Bighi C. Anal Chim Acta. 1986;191:261. [Google Scholar]
- 64.Pietrogrande MC, Pasti L, Dondi F, Rodriguez MHB, Diaz MAC. J High Resolut Chromatogr. 1994;17:839. [Google Scholar]
- 65.Davis JM, Stoll DR, Carr PW. Anal Chem. 2007 Submitted for Publication. [Google Scholar]
- 66.Wang X, Stoll DR, Schellinger AP, Carr PW. Anal Chem. 2006;78:3406. doi: 10.1021/ac0600149. [DOI] [PMC free article] [PubMed] [Google Scholar]
- 67.Giddings JC. J Chromatogr A. 1995;703:3. doi: 10.1016/0021-9673(95)00249-m. [DOI] [PubMed] [Google Scholar]
- 68.Liu Z, Patterson DG, Jr, Lee ML. Anal Chem. 1995;67:3840. [Google Scholar]
- 69.Slonecker PJ, Li X, Ridgway TH, Dorsey JG. Anal Chem. 1996;68:682. doi: 10.1021/ac950852v. [DOI] [PubMed] [Google Scholar]
- 70.Gray M, Dennis GR, Wormell P, Andrew Shalliker R, Slonecker P. J Chromatogr A. 2002;975:285. doi: 10.1016/s0021-9673(02)01221-9. [DOI] [PubMed] [Google Scholar]
- 71.Gilar M, Olivova P, Daly AE, Gebler JC. J Sep Sci. 2005;28:1694. doi: 10.1002/jssc.200500116. [DOI] [PubMed] [Google Scholar]
- 72.Ryan D, Morrison P, Marriott P. J Chromatogr A. 2005;1071:47. doi: 10.1016/j.chroma.2004.09.020. [DOI] [PubMed] [Google Scholar]
- 73.Gilar M, Olivova P, Daly AE, Gebler JC. Anal Chem. 2005;77:6426. doi: 10.1021/ac050923i. [DOI] [PubMed] [Google Scholar]
- 74.Kok SJ, Hankemeier T, Schoenmakers PJ. J Chromatogr A. 2005;1098:104. doi: 10.1016/j.chroma.2005.08.058. [DOI] [PubMed] [Google Scholar]
- 75.Van Gyseghem E, Crosiers I, Gourvenec S, Massart DL, Vander Heyden Y. J Chromatogr A. 2004;1026:117. doi: 10.1016/j.chroma.2003.10.116. [DOI] [PubMed] [Google Scholar]
- 76.Snyder LR. J Chromatogr B. 1997;689:105. doi: 10.1016/s0378-4347(96)00351-9. [DOI] [PubMed] [Google Scholar]
- 77.Mao Y, Carr PW. Anal Chem. 2000;72:110. doi: 10.1021/ac990638x. [DOI] [PubMed] [Google Scholar]
- 78.Giddings JC. Anal Chem. 1967;39:1027. [Google Scholar]
- 79.Giddings JC. Unified Separation Science. John Wiley & Sons Inc.; New York: 1991. [Google Scholar]
- 80.Horvath CG, Lipsky SR. Anal Chem. 1967;39:1893. doi: 10.1021/ac60256a003. [DOI] [PubMed] [Google Scholar]
- 81.Guiochon G. J Chromatogr A. 2006;1126:6. [Google Scholar]
- 82.Grushka E. Anal Chem. 1970;42:1142. [Google Scholar]
- 83.Snyder LR, Dolan JW. Adv Chromatogr. 1998;38:115. [Google Scholar]
- 84.Dolan JW, Snyder LR. J Chromatogr A. 1998;799:21. doi: 10.1016/s0021-9673(97)01045-5. [DOI] [PubMed] [Google Scholar]
- 85.Dolan JW, Snyder LR, Djordjevic NM, Hill DW, Waeghe TJ. J Chromatogr A. 1999;857:1. doi: 10.1016/s0021-9673(99)00765-7. [DOI] [PubMed] [Google Scholar]
- 86.Chen J, Lee CS, Shen Y, Smith RD, Baehrecke EH. Electrophoresis. 2002;23:3143. doi: 10.1002/1522-2683(200209)23:18<3143::AID-ELPS3143>3.0.CO;2-7. [DOI] [PubMed] [Google Scholar]
- 87.Shen Y, Moore RJ, Zhao R, Blonder J, Auberry DL, Masselon C, Pasa-Tolic L, Hixson KK, Auberry KJ, Smith RD. Anal Chem. 2003;75:3596. doi: 10.1021/ac0300690. [DOI] [PubMed] [Google Scholar]
- 88.Gilar M, Daly AE, Kele M, Neue UD, Gebler JC. J Chromatogr A. 2004;1061:183. doi: 10.1016/j.chroma.2004.10.092. [DOI] [PubMed] [Google Scholar]
- 89.Neue UD. J Chromatogr A. 2005;1079:153. doi: 10.1016/j.chroma.2005.03.008. [DOI] [PubMed] [Google Scholar]
- 90.Neue UD, Mazzeo JR. J Sep Sci. 2001;24:921. [Google Scholar]
- 91.Stadalius MA, Quarry MA, Snyder LR. J Chromatogr A. 1985;327:93. [Google Scholar]
- 92.Guiochon G. Anal Chem. 1980;52:2002. [Google Scholar]
- 93.Chen H, Horvath C. J Chromatogr A. 1995;705:3. doi: 10.1016/0021-9673(94)01254-c. [DOI] [PubMed] [Google Scholar]
- 94.Poppe H. J Chromatogr A. 1997;778:3. [Google Scholar]
- 95.Knox JH, Saleem M. J Chromatogr Sci. 1969;7:614. [Google Scholar]
- 96.Snyder LR, Dolan JW, Molnar I, Djordjevic NM. LC-GC North Am. 1997;15:136. [Google Scholar]
- 97.Antia FD, Horvath C. J Chromatogr A. 1988;435:1. [Google Scholar]
- 98.Martin M, Blu G, Eon C, Guiochon G. J Chromatogr Sci. 1974;12:438. [Google Scholar]
- 99.Thompson JD, Brown JS, Carr PW. Anal Chem. 2001;73:3340. doi: 10.1021/ac010091y. [DOI] [PubMed] [Google Scholar]
- 100.Thompson JD, Carr PW. Anal Chem. 2002;74:1017. doi: 10.1021/ac010917w. [DOI] [PubMed] [Google Scholar]
- 101.Thompson JD, Carr PW. Anal Chem. 2002;74:4150. doi: 10.1021/ac0112622. [DOI] [PubMed] [Google Scholar]
- 102.Macnair JE, Lewis KC, Jorgenson JW. Anal Chem. 1997;69:983. doi: 10.1021/ac961094r. [DOI] [PubMed] [Google Scholar]
- 103.Desmet G, Clicq D, Nguyen DTT, Guillarme D, Rudaz S, Veuthey J-L, Vervoort N, Torok G, Cabooter D, Gzil P. Anal Chem. 2006;78:2150. doi: 10.1021/ac051280+. [DOI] [PubMed] [Google Scholar]
- 104.Desmet G, Clicq D, Gzil P. Anal Chem. 2005;77:4058. doi: 10.1021/ac050160z. [DOI] [PubMed] [Google Scholar]
- 105.Wang X, Stoll DR, Carr PW, Schoenmakers PJ. J Chromatogr A. 2006;1125:177. doi: 10.1016/j.chroma.2006.05.048. [DOI] [PubMed] [Google Scholar]
- 106.Giddings JC. Anal Chem. 1965;37:60. [Google Scholar]
- 107.Carr PW, Doherty RM, Kamlet MJ, Taft RW, Melander W, Horvath C. Anal Chem. 1986;58:2674. doi: 10.1021/ac00126a021. [DOI] [PubMed] [Google Scholar]
- 108.Yan B, Zhao J, Brown JS, Blackwell J, Carr PW. Anal Chem. 2000;72:1253. doi: 10.1021/ac991008y. [DOI] [PubMed] [Google Scholar]
- 109.Li JW, Carr PW. Anal Chem. 1997;69:2530. doi: 10.1021/ac961005a. [DOI] [PubMed] [Google Scholar]
- 110.Poppe H, Kraak JC. J Chromatogr. 1983;282:399. [Google Scholar]
- 111.Wen D, Olesik SV. J Chromatogr A. 2001;931:41. doi: 10.1016/s0021-9673(01)01209-2. [DOI] [PubMed] [Google Scholar]
- 112.Wen D, Olesik SV. Anal Chim Acta. 2001;449:211. [Google Scholar]
- 113.Svec F, Huber CG. Anal Chem. 2006;78:2100. doi: 10.1021/ac069383v. [DOI] [PubMed] [Google Scholar]
- 114.Barder TJ, Wohlman PJ, Thrall C, DuBois PD. LC-GC North Am. 1997;15:918. [Google Scholar]
- 115.Marchetti N, Cavazzini A, Gritti F, Guiochon G. J Chromatogr A. 2007 doi: 10.1016/j.chroma.2007.05.030. In Press. [DOI] [PubMed] [Google Scholar]
- 116.Thompson JW, Mellors JS, Eschelbach JW, Jorgenson JW. LC-GC North Am. 2006;24:16. [Google Scholar]
- 117.Machtejevas E, John H, Wagner K, Standker L, Marko-Varga G, Forssmann W-G, Bischoff R, Unger KK. J Chromatogr B. 2004;803:121. doi: 10.1016/j.jchromb.2003.07.015. [DOI] [PubMed] [Google Scholar]
- 118.Tanaka N, Kimura H, Tokuda D, Hosoya K, Ikegami T, Ishizuka N, Minakuchi H, Nakanishi K, Shintani Y, Furuno M, Cabrera K. Anal Chem. 2004;76:1273. doi: 10.1021/ac034925j. [DOI] [PubMed] [Google Scholar]
- 119.Tan LC, Carr PW. J Chromatogr A. 1997;775:1. [Google Scholar]
- 120.Horvath C, Melander W, Molnar I. J Chromatogr. 1976;125:129. [Google Scholar]
- 121.Carr PW, Tan LC, Park JH. J Chromatogr A. 1996;724:1. [Google Scholar]
- 122.Carr PW, Li JJ, Dallas AJ, Eikens DI, Tan LC. J Chromatogr A. 1993;656:113. [Google Scholar]
- 123.Snyder LR, Dolan JW, Carr PW. J Chromatogr A. 2004;1060:77. [PubMed] [Google Scholar]
- 124.Vitha M, Carr PW. J Chromatogr A. 2006;1126:143. doi: 10.1016/j.chroma.2006.06.074. [DOI] [PubMed] [Google Scholar]
- 125.Cuatrecasas PW, Meir . Encyclopedia of Biological Chemistry. Elsevier Ltd.; Oxford, UK: 2004. [Google Scholar]
- 126.Bergold AF, Hangii DA, Muller AJ, Carr PW. In: High Performance Affinity Chromatography. Horvath C, editor. Academic Press; San Diego: 1988. p. 95. [Google Scholar]
- 127.Scouten WH. Affinity Chromatography. John Wiley and Sons; New York: 1981. [Google Scholar]
- 128.Endo T. J Chromatogr Libr. 2002;66:251. [Google Scholar]
- 129.Opiteck GJ, Jorgenson JW, Moseley MA, III, Anderegg RJ. J Microcolumn Sep. 1998;10:365. [Google Scholar]
- 130.Jiang XL, van der Horst A, Lima V, Schoenmakers PJ. J Chromatogr A. 2005;1076:51. doi: 10.1016/j.chroma.2005.03.135. [DOI] [PubMed] [Google Scholar]
- 131.Dugo P, Kumm T, Crupi ML, Cotroneo A, Mondello L. J Chromatogr A. 2006;1112:269. doi: 10.1016/j.chroma.2005.10.070. [DOI] [PubMed] [Google Scholar]
- 132.Stoll DR, Carr PW. J Am Chem Soc. 2005;127:5034. doi: 10.1021/ja050145b. [DOI] [PubMed] [Google Scholar]
- 133.Hooker TF, Jorgenson JW. Anal Chem. 1997;69:4134. [Google Scholar]
- 134.Mondello L, Dugo P, Dugo G, Lewis AC, Bartle KD. J Chromatogr A. 1999;842:373. [Google Scholar]
- 135.Zhang J, Tao DY, Duan JC, Liang Z, Zhang WB, Zhang LH, Huo YS, Zhang YK. Anal Bioanal Chem. 2006;386:586. doi: 10.1007/s00216-006-0539-6. [DOI] [PubMed] [Google Scholar]
- 136.Im K, Kim Y, Chang T, Lee K, Choi N. J Chromatogr A. 2006;1103:235. doi: 10.1016/j.chroma.2005.11.050. [DOI] [PubMed] [Google Scholar]
- 137.Ikegami T, Hara T, Kimura H, Kobayashi H, Hosoya K, Cabrera K, Tanaka N. J Chromatogr A. 2006;1106:112. doi: 10.1016/j.chroma.2005.10.068. [DOI] [PubMed] [Google Scholar]
- 138.Rogatsky E, Stein DT. J Sep Sci. 2006;29:538. doi: 10.1002/jssc.200500474. [DOI] [PubMed] [Google Scholar]
- 139.Venkatramani CJ, Patel A. J Sep Sci. 2006;29:510. doi: 10.1002/jssc.200500341. [DOI] [PubMed] [Google Scholar]
- 140.Venkatramani CJ, Zelechonok Y. Anal Chem. 2003;75:3484. doi: 10.1021/ac030075w. [DOI] [PubMed] [Google Scholar]
- 141.Gray MJ, Dennis GR, Slonecker PJ, Shalliker RA. J Chromatogr A. 2005;1073:3. doi: 10.1016/j.chroma.2004.10.071. [DOI] [PubMed] [Google Scholar]
- 142.Chen XG, Kong L, Su XY, Fu HJ, Ni JY, Zhao RH, Zou HF. J Chromatogr A. 2004;1040:169. doi: 10.1016/j.chroma.2004.04.002. [DOI] [PubMed] [Google Scholar]
- 143.Dugo P, Skerikova V, Kumm T, Trozzi A, Jandera P, Mondello L. Anal Chem. 2006;78:7743. doi: 10.1021/ac061290q. [DOI] [PubMed] [Google Scholar]
- 144.Jandera P, Fischer J, Lahovska H, Novotna K, Cesla P, Kolarova L. J Chromatogr A. 2006;1119:3. doi: 10.1016/j.chroma.2005.10.081. [DOI] [PubMed] [Google Scholar]
- 145.Dugo P, Fernandez MD, Cotroneo A, Dugo G, Mondello L. J Chromatogr Sci. 2006;44:561. doi: 10.1093/chromsci/44.9.561. [DOI] [PubMed] [Google Scholar]
- 146.Saito H, Oda Y, Sato T, Kuromitsu J, Ishihama Y. J Proteome Res. 2006;5:1803. doi: 10.1021/pr0601178. [DOI] [PubMed] [Google Scholar]
- 147.Lim KB, Kassel DB. Anal Biochem. 2006;354:213. doi: 10.1016/j.ab.2006.04.027. [DOI] [PubMed] [Google Scholar]
- 148.Pepaj M, Wilson SR, Novotna K, Lundanes E, Greibrokk T. J Chromatogr A. 2006;1120:132. doi: 10.1016/j.chroma.2006.02.031. [DOI] [PubMed] [Google Scholar]
- 149.Fortier MH, Bonneil E, Goodley P, Thibault P. Anal Chem. 2005;77:1631. doi: 10.1021/ac048506d. [DOI] [PubMed] [Google Scholar]
- 150.Wagner K, Racaityte K, Unger KK, Miliotis T, Edholm LE, Bischoff R, Marko-Varga G. J Chromatogr A. 2000;893:293. doi: 10.1016/s0021-9673(00)00736-6. [DOI] [PubMed] [Google Scholar]
- 151.Kristensen BK, Askerlund P, Bykova NV, Egsgaard H, Moller IM. Phytochemistry. 2004;65:1839. doi: 10.1016/j.phytochem.2004.04.007. [DOI] [PubMed] [Google Scholar]
- 152.Li C, Hong Y, Tan YX, Zhou H, Ai JH, Li SJ, Zhang L, Xia QC, Wu JR, Wang HY, Zeng R. Mol Cell Proteomics. 2004;3:399. doi: 10.1074/mcp.M300133-MCP200. [DOI] [PubMed] [Google Scholar]
- 153.Chelius D, Zhang T, Wang GH, Shen RF. Anal Chem. 2003;75:6658. doi: 10.1021/ac034607k. [DOI] [PubMed] [Google Scholar]
- 154.Gu S, Du YC, Chen J, Liu ZH, Bradbury EM, Hu CAA, Chen X. J Proteome Res. 2004;3:1191. doi: 10.1021/pr049893a. [DOI] [PubMed] [Google Scholar]
- 155.Pol J, Hohnova B, Jussila M, Hyotylainen T. J Chromatogr A. 2006;1130:64. doi: 10.1016/j.chroma.2006.04.050. [DOI] [PubMed] [Google Scholar]
- 156.Holland LA, Jorgenson JW. J Microcolumn Sep. 2000;12:371. [Google Scholar]
- 157.Coulier L, Kaal ER, Hankemeier T. J Chromatogr A. 2005;1070:79. doi: 10.1016/j.chroma.2005.02.067. [DOI] [PubMed] [Google Scholar]
- 158.van der Horst A, Schoenmakers PJ. J Chromatogr A. 2003;1000:693. doi: 10.1016/s0021-9673(03)00495-3. [DOI] [PubMed] [Google Scholar]
- 159.Opiteck GJ, Ramirez SM, Jorgenson JW, Moseley MA., III Anal Biochem. 1998;258:349. doi: 10.1006/abio.1998.2588. [DOI] [PubMed] [Google Scholar]
- 160.Gao HF, Siegwart DJ, Jahed N, Sarbu T, Matyjaszewski K. Monomers Polym. 2005;8:533. [Google Scholar]
- 161.Hata K, Morisaka H, Hara K, Mima J, Yumoto N, Tatsu Y, Furuno M, Ishizuka N, Ueda M. Anal Biochem. 2006;350:292. doi: 10.1016/j.ab.2006.01.009. [DOI] [PubMed] [Google Scholar]
- 162.Mondello L, Tranchida PQ, Stanek V, Jandera P, Dugo G, Dugo P. J Chromatogr A. 2005;1086:91. doi: 10.1016/j.chroma.2005.06.017. [DOI] [PubMed] [Google Scholar]
- 163.Radke W, Rode K, Gorshkov AV, Biela T. Polymer. 2005;46:5456. [Google Scholar]
- 164.Coulier L, Kaal ER, Hankemeier T. Polym Degrad Stab. 2006;91:271. [Google Scholar]
- 165.Krueger RP, M H, Schulz G. Int J Polym Anal Charact. 1996;2:221. [Google Scholar]
- 166.Heinz LC, Siewing A, Pasch H. E-Polymers. 2003 [Google Scholar]
- 167.Siewing A, Lahn B, Braun D, Pasch H. J Polym Sci Part A Polym Chem. 2003;41:3143. [Google Scholar]
- 168.Graef SM, van Zyl AJP, Sanderson RD, Klumperman B, Pasch H. J Appl Polym Sci. 2003;88:2530. [Google Scholar]
- 169.Siewing A, Schierholz J, Braun D, Hellman G, Pasch H. Macromol Chem Phys. 2001;202:2890. [Google Scholar]
- 170.Vissers JPC, van Soest REJ, Chervet JP, Cramers CA. J Microcolumn Sep. 1999;11:277. [Google Scholar]
- 171.Unger KK, Racaityte K, Wagner K, Miliotis T, Edholm LE, Bischoff R, Marko-Varga G. J High Resolut Chromatogr. 2000;23:259. doi: 10.1016/s0021-9673(00)00736-6. [DOI] [PubMed] [Google Scholar]
- 172.Masuda J, Maynard DA, Nishimura M, Uedac T, Kowalak JA, Markey SP. J Chromatogr A. 2005;1063:57. doi: 10.1016/j.chroma.2004.11.084. [DOI] [PubMed] [Google Scholar]
- 173.Dugo P, Favoino O, Luppino R, Dugo G, Mondello L. Anal Chem. 2004;76:2525. doi: 10.1021/ac0352981. [DOI] [PubMed] [Google Scholar]
- 174.Majors RE. LC-GC North Am. 1997;15:1008. [Google Scholar]
- 175.Majors RE. LC-GC North Am. 2007;25:532. [Google Scholar]
- 176.Snyder LR, Dolan JW. High-Performance Gradient Elution: The Practical Application of the Linear-Solvent-Strength Model. Wiley-Interscience; Hoboken: 2007. [Google Scholar]
- 177.Gray MJ, Dennis GR, Slonecker PJ, Shalliker RA. J Chromatogr A. 2004;1041:101. doi: 10.1016/j.chroma.2004.04.039. [DOI] [PubMed] [Google Scholar]
- 178.Jackson PT, Schure MR, Weber TP, Carr PW. Anal Chem. 1997;69:416. doi: 10.1021/ac960453f. [DOI] [PubMed] [Google Scholar]
- 179.Mayfield KJ, Shalliker RA, Catchpoole HJ, Sweeney AP, Wong V, Guiochon G. J Chromatogr A. 2005;1080:124. doi: 10.1016/j.chroma.2005.04.093. [DOI] [PubMed] [Google Scholar]
- 180.Regnier F, Huang G. J Chromatogr A. 1996;750:3. doi: 10.1016/0021-9673(96)00638-3. [DOI] [PubMed] [Google Scholar]
- 181.Dugo P, Kumm T, Chiofalo B, Cotroneo A, Mondello L. J Sep Sci. 2006;29:1146. doi: 10.1002/jssc.200500476. [DOI] [PubMed] [Google Scholar]
- 182.Simpson DC, Ahn S, Pasa-Tolic L, Bogdanov B, Mottaz HM, Vilkov AN, Anderson GA, Lipton MS, Smith RD. Electrophoresis. 2006;27:2722. doi: 10.1002/elps.200600037. [DOI] [PMC free article] [PubMed] [Google Scholar]
- 183.Yu WJ, Li Y, Deng CH, Zhang XM. Electrophoresis. 2006;27:2100. doi: 10.1002/elps.200500820. [DOI] [PubMed] [Google Scholar]
- 184.Enke C. Anal Chem. 1997;69:4885. doi: 10.1021/ac970095w. [DOI] [PubMed] [Google Scholar]
- 185.Petritis K, Dessans H, Elfakir C, Dreux M. LC-GC Eur. 2002;15:98. [Google Scholar]
- 186.Chen Y, Kele M, Tuinman AA, Guiochon G. J Chromatogr A. 2000;873:163. doi: 10.1016/s0021-9673(99)01327-8. [DOI] [PubMed] [Google Scholar]
- 187.Sakhi AK, Russnes KM, Smeland S, Blomhoff R, Gundersen TE. J Chromatogr A. 2006;1104:179. doi: 10.1016/j.chroma.2005.11.129. [DOI] [PubMed] [Google Scholar]
- 188.Mao Y, Zhang XM. Electrophoresis. 2003;24:3289. doi: 10.1002/elps.200305578. [DOI] [PubMed] [Google Scholar]
- 189.Komatsu S, Zang X, Tanaka N. J Proteome Res. 2006;5:270. doi: 10.1021/pr0502929. [DOI] [PubMed] [Google Scholar]
- 190.Tschappat V, Varesio E, Signor L, Hopfgartner G. J Sep Sci. 2005;28:1704. doi: 10.1002/jssc.200500149. [DOI] [PubMed] [Google Scholar]
- 191.Dai J, Shieh CH, Sheng Q-H, Zhou H, Zeng R. Anal Chem. 2005;77:5793. doi: 10.1021/ac050251w. [DOI] [PubMed] [Google Scholar]
- 192.Gargallo R, Tauler R, Cuesta-Sanchez F, Massart DL. Trends Anal Chem. 1996;15:279. [Google Scholar]
- 193.Tauler R, Smilde A, Kowalski B. J Chemom. 1995;9:31. [Google Scholar]
- 194.Schure MR. J Chromatogr. 1991;550:51. [Google Scholar]
- 195.Wright AD, Sampson MB, Neuffer MG, Michalczuk L, Slovin JP, Cohen JD. Science. Vol. 254. Washington, DC: 1991. p. 998. [DOI] [PubMed] [Google Scholar]
- 196.Porter SEG, Stoll DR, Rutan SC, Carr PW, Cohen JD. Anal Chem. 2006;78:5559. doi: 10.1021/ac0606195. [DOI] [PubMed] [Google Scholar]
- 197.Frahm JL, Howard BE, Heber S, Muddiman DC. J Mass Spectrom. 2006;41:281. doi: 10.1002/jms.1024. [DOI] [PubMed] [Google Scholar]
- 198.Faber K, Lorber A, Kowalski BR. J Chemom. 1997;11:419. [Google Scholar]
- 199.Faber K, Lorber A, Kowalski BR. Chemom Intell Lab Syst. 1997;38:89. [Google Scholar]
- 200.Lorber A, Faber K, Kowalski BR. Anal Chem. 1997;69:1620. [Google Scholar]
- 201.Cantwell MT, Porter SEG, Rutan SC. J Chemom. 2007 In Press. [Google Scholar]
- 202.Gross GM, Prazen BJ, Synovec RE. Anal Chim Acta. 2003;490:197. [Google Scholar]
- 203.Sinha AE, Hope JL, Prazen BJ, Nilsson EJ, Jack RM, Synovec RE. J Chromatogr A. 2004;1058:209. [PubMed] [Google Scholar]
- 204.Sinha AE, Fraga CG, Prazen BJ, Synovec RE. J Chromatogr A. 2004;1027:269. doi: 10.1016/j.chroma.2003.08.081. [DOI] [PubMed] [Google Scholar]
- 205.Fraga CG, Corley CA. J Chromatogr A. 2005;1096:40. doi: 10.1016/j.chroma.2005.03.118. [DOI] [PubMed] [Google Scholar]
- 206.Smilde A, Bro R, Geladi P. Multi-way Analysis with Applications in the Chemical Sciences. John Wiley & Sons, Ltd.; Hoboken, NJ: 2004. [Google Scholar]
- 207.Bruckner CA, Prazen BJ, Synovec RE. Anal Chem. 1998;70:2796. [Google Scholar]
- 208.Fraga CG, Prazen BJ, Synovec RE. Anal Chem. 2000;72:4154. doi: 10.1021/ac000303b. [DOI] [PubMed] [Google Scholar]
- 209.Prazen BJ, Bruckner CA, Synovec RE, Kowalski BR. J Microcolumn Sep. 1999;11:97. [Google Scholar]
- 210.van Mispelaar VG, Tas AC, Smilde AK, Schoenmakers PJ, van Asten AC. J Chromatogr A. 2003;1019:15. doi: 10.1016/j.chroma.2003.08.101. [DOI] [PubMed] [Google Scholar]
- 211.Mohler RE, Dombek KM, Hoggard JC, Young ET, Synovec RE. Anal Chem. 2006;78:2700. doi: 10.1021/ac052106o. [DOI] [PMC free article] [PubMed] [Google Scholar]
- 212.Booksh KS, Lin ZH, Wang ZY, Kowalski BR. Anal Chem. 1994;66:2561. [Google Scholar]
- 213.Prazen BJ, Synovec RE, Kowalski BR. Anal Chem. 1998;70:218. [Google Scholar]
- 214.Bylund D, Danielsson R, Malmquist G, Markides KE. J Chromatogr A. 2002;961:237. doi: 10.1016/s0021-9673(02)00588-5. [DOI] [PubMed] [Google Scholar]
- 215.Eilers PHC. Anal Chem. 2004;76:404. doi: 10.1021/ac034800e. [DOI] [PubMed] [Google Scholar]
- 216.Johnson KJ, Wright BW, Jarman KH, Synovec RE. J Chromatogr A. 2003;996:141. doi: 10.1016/s0021-9673(03)00616-2. [DOI] [PubMed] [Google Scholar]
- 217.Pierce KM, Wood LF, Wright BW, Synovec RE. Anal Chem. 2005;77:7735. doi: 10.1021/ac0511142. [DOI] [PubMed] [Google Scholar]
- 218.Pravdova V, Walczak B, Massart DL. Anal Chim Acta. 2002;456:77. [Google Scholar]
- 219.Walczak B, Wu W. Chemom Intell Lab Syst. 2005;77:173. [Google Scholar]
- 220.Norton S. 2003095978. Wo Patent. 2003
- 221.Fraga CG, Prazen BJ, Synovec RE. Anal Chem. 2001;73:5833. doi: 10.1021/ac010656q. [DOI] [PubMed] [Google Scholar]
- 222.Johnson KJ, Prazen BJ, Young DC, Synovec RE. J Sep Sci. 2004;27:410. doi: 10.1002/jssc.200301640. [DOI] [PubMed] [Google Scholar]
- 223.Pierce KM, Hope JL, Johnson KJ, Wright BW, Synovec RE. J Chromatogr A. 2005;1096:101. doi: 10.1016/j.chroma.2005.04.078. [DOI] [PubMed] [Google Scholar]
- 224.Hollingsworth BV, Reichenbach SE, Tao QP, Visvanathan A. J Chromatogr A. 2006;1105:51. doi: 10.1016/j.chroma.2005.11.074. [DOI] [PMC free article] [PubMed] [Google Scholar]
- 225.Reichenbach SE, Ni MT, Zhang DM, Ledford EB. J Chromatogr A. 2003;985:47. doi: 10.1016/s0021-9673(02)01498-x. [DOI] [PubMed] [Google Scholar]
- 226.Bro R. J Chemom. 1996;10:47. [Google Scholar]
- 227.Prazen BJ, Johnson KJ, Weber A, Synovec RE. Anal Chem. 2001;73:5677. doi: 10.1021/ac010637g. [DOI] [PubMed] [Google Scholar]
- 228.van Mispelaar VG, Janssen HG, Tas AC, Schoenmakers PJ. J Chromatogr A. 2005;1071:229. doi: 10.1016/j.chroma.2004.08.135. [DOI] [PubMed] [Google Scholar]
- 229.Schure MR. Anal Chem. 1999;71:1645. [Google Scholar]
- 230.Kobayashi H, Ikegami T, Kimura H, Hara T, Tokuda D, Tanaka N. Anal Sci. 2006;22:491. doi: 10.2116/analsci.22.491. [DOI] [PubMed] [Google Scholar]
- 231.Schoenmakers PJ, Vivo-Truyols G, Decrop WMC. J Chromatogr A. 2006;1120:282. doi: 10.1016/j.chroma.2005.11.039. [DOI] [PubMed] [Google Scholar]
- 232.Guiochon G, Drumm E, Cherrak D. J Chromatogr A. 1999;835:41. [Google Scholar]
- 233.Wong V, Shalliker RA, Guiochon G. Anal Chem. 2004;76:2601. doi: 10.1021/ac030391a. [DOI] [PubMed] [Google Scholar]
- 234.Atwood JG, Goldstein J. J Phys Chem. 1984;88:1875. [Google Scholar]
- 235.Atwood JG, Golay MJE. J Chromatogr. 1981;218:97. [Google Scholar]
- 236.Lenhoff AM. J Chromatogr. 1987;384:285. [Google Scholar]
- 237.Koehne AP, Dornberger U, Welsch T. Chromatographia. 1998;48:9. [Google Scholar]
- 238.Blumberg LM. Chromatographia. 1994;39:719. [Google Scholar]
- 239.Jones BA. J Liq Chromatogr Rel Technol. 2004;27:1331. [Google Scholar]
- 240.Schellinger AP, Carr PW. J Chromatogr A. 2005;1077:110. doi: 10.1016/j.chroma.2005.04.088. [DOI] [PubMed] [Google Scholar]
- 241.Stoll DR, Paek C, Carr PW. J Chromatogr A. 2006;1137:153. doi: 10.1016/j.chroma.2006.10.017. [DOI] [PubMed] [Google Scholar]
- 242.Hara T, Kobayashi H, Ikegami T, Nakanishi K, Tanaka N. Anal Chem. 2006;78:7632. doi: 10.1021/ac060770e. [DOI] [PubMed] [Google Scholar]
- 243.Yoshida T, Majors RE. J Sep Sci. 2006;29:2421. doi: 10.1002/jssc.200600267. [DOI] [PubMed] [Google Scholar]
- 244.Wu NJ, Liu YS, Lee ML. J Chromatogr A. 2006;1131:142. doi: 10.1016/j.chroma.2006.07.042. [DOI] [PubMed] [Google Scholar]
- 245.Mac-Mod. 2007 http://www.mac-mod.com/pb/halo-pb.html.
- 246.LECO. 2007 http://www.leco.com/products/sep_sci/unique/unique.htm.
- 247.Zolg W. Mol Cell Proteomics. 2006;5:1720. doi: 10.1074/mcp.R600001-MCP200. [DOI] [PubMed] [Google Scholar]
- 248.Robinson AB, Pauling L. Orthomolecular Psychiat : Treat Schizophrenia. 1973:35. [Google Scholar]
- 249.Pauling L. Funkts Biokhim Kletochnykh Strukt. 1970:427. [Google Scholar]


