Abstract
Owing to its combination of unique selectivity and mechanical strength, commercial carbon clad zirconia (C/ZrO2) has been widely used for many applications, including fast two-dimensional liquid chromatography (2DLC). However, the low surface area available (only 20 - 30 m2/g for commercial porous ZrO2) limits its retentivity. We have recently addressed this limitation by developing a carbon phase coated on the high surface area of HPLC grade alumina (C/Al2O3). This material provides higher retentivity and comparable selectivity, but its use is still limited by how few HPLC quality types of alumina particles (e.g., particle size, surface area, pore size) are available. In this work, we have developed useful carbon phases on silica particles, which are available in various particle sizes, pore sizes and forms of HPLC grade.
To make the carbon phase on silica, we first treat the silica surface with a monolayer or less of metal cations that bind to deprotonated silanols to provide catalytic sites for carbon deposition. After Al (III) treatment, a carbon phase is formed on the silica surface by chemical vapor deposition at 700 °C using hexane as the carbon source. The amount of Al (III) on the surface was varied to assess its effect on carbon deposition, and the carbon loading was varied at different Al (III) levels to assess its effect on the chromatographic properties of the various carbon adsorbents. We observed that use of a concentration of Al (III) corresponding to a full monolayer leads to the most uniform carbon coating. A carbon coating sufficient to cover all the Al (III) sites, required about 4 – 5 monolayers in this work, provided the best chromatographic performance. The resulting carbon phases behave as reversed phases with reasonable efficiency (50,000 – 79,000 plates/meter) for non-aromatic test species.
1. Introduction
Carbonaceous materials are versatile sorbents used in a wide range of applications [1-3]– most particularly, for gas and liquid chromatography (LC) [4,5]. Two commercial carbon phases for LC - carbon clad zirconia (C/ZrO2) and porous graphitic carbon (Hypercarb) – among all the available reversed-phase materials show unique forms of chromatographic selectivity for polar and nonpolar compounds, as well as for structural isomers, and thus have been used to separate analytes that are not readily resolved by conventional reversed phases (e.g. alkyl silica phases) [6-10]. Two review papers describe the advantages of LC carbon phases [11,12].
The unique selectivity of C/ZrO2, combined with its mechanical strength, make it a promising choice for use in fast two-dimensional liquid chromatography (2DLC) [13], but, as pointed out in a previous study [14], there is a great need to improve its retentivity. We have recently made some progress by developing a promising carbon phase on porous HPLC grade alumina; the resulting material (C/Al2O3) showed 4 – 5 fold higher retentivity than did C/ZrO2, while maintaining the unique selectivity of a carbon-like adsorbent. However, the further development of C/Al2O3 is limited by the paucity of available varieties of HPLC grade porous aluminas.
Silica is the most common substrate as a HPLC packing materials and is available in a wide variety of types (e.g. totally porous and superficially porous), pore sizes, surface areas and particle diameters (e.g. sub 2 to greater than 10 μm) [15]. This variety allows its application in wide array of separations. For example, particularly small particles can be used for fast separations [16,17], whereas superficially porous particles can be used to improve the speed and efficiency of peptide separations [18,19].
Though there have been many attempts to develop carbon phases on silica, none is yet entirely satisfactory for demanding HPLC uses most particularly fast 2DLC. Hypercarb, made from silica ‘template’ [20] has insufficient mechanical strength [21] and ought not be used above 300 bar. Leboda prepared carbon phases on silica by pyrolyzing organic vapors such as dichloromethane [22]; Kamegawa and Yoshida pre-coated silica with a crosslinked polymer layer and subsequently pyrolyzed the polymer layer [23]; and Engel et al. pre-adsorbed diethynyl aromatic oligomers on silica and subsequently pyrolyzed the oligomers [24]. However, these were either unsuitable for HPLC or exhibited both low efficiencies and significantly tailed peak shapes when used for chromatography.
Leboda et al. made the significant observation, though, that treatment of the silica surface with other metals can assist carbon deposition. They impregnated silica with nickel (II) and zirconium (IV) salts to catalyze the decomposition of hydrocarbons on silica [25,26]; unfortunately, the high metal loading used caused a significant loss of surface area. In addition, deposition of the metal by impregnation can lead to uncontrolled precipitation and crystallization of the metal oxide and hydroxides [27], which can cause pore blockage. Thus, we needed to develop a method to put metals on silica in a regulated manner, if possible limiting treatment to a monolayer of metal, prior to carbon deposition by CVD.
In this paper, we present such a method to prepare metal–treated silica as a substrate for the development of carbon phases for use as HPLC media. Unlike Leboda’s method of deposition, we use the electrostatic binding between positively charged metal ions and deprotonated silanol groups, so we are able to limit the amount of metal to a monolayer or less. Adapting a method previously very widely used to bring about homogeneous precipitation of metallic compounds [28], we used the slow hydrolysis of urea in solution to homogeneously raise the pH so slowly that all cations adsorb onto the silica surface, thereby avoiding self-oligomerization and precipitation [29]. Moreover, unlike Leboda’s method, we chose to try Al (III) - a metal well known to produce on silica reactive sites that can produce carbon coatings (“coke” that can deactivate solid acid catalysts).
After treatment with Al (III), a carbon phase is formed on the surface by chemical vapor deposition (CVD). The amount of Al (III) was varied to assess its effect on carbon deposition. The carbon loading was varied by adjusting the reaction time on each substrate. Each carbon-clad Al (III) doped silica, here after denoted C/Al/SiO2, material was then packed into a column to evaluate chromatographic performance including efficiency and retentivity.
2. Experimental
2.1. Chemicals
HPLC grade hexanes from Sigma – Aldrich (St. Louis, MO, USA) were used as the CVD carbon source. All chemicals used for the chromatographic study were obtained reagent grade or better from Sigma-Aldrich (St. Louis, MO, USA). HPLC eluents were HPLC grade acetonitrile from Burdick and Jackson (Muskegon, MI, USA) and HPLC grade water (18.2 MΩ) that was prepared in-house from a Barnstead Nanopure II deionizing system (Dubuque, IA, USA). Prior to use, this water was boiled to remove carbon dioxide and passed through a 0.45 μm nylon filtration apparatus (Lida Manufacturing Inc., Kenosha, WI, USA).
2.2. Preparation of metal adsorbed silica
2.2.1. Materials
Aluminum chloride hexahydrate (Fisher Scientific, Fair Lawn, NJ, USA) was used for the Al (III) treatment. Silica, 13.7 μm AstroSil (Stellar Phases Inc, Yardley, PA, USA) was used for the preliminary CVD study with Al (III) metal-treatments, and 5 μm Zorbax silica (Agilent Technologies, Palo Alto, CA) was used to prepare HPLC supports with Al (III) treatment.
For comparison, attempts were also made with Leboda’s choice of Zr (IV) using zirconium tetrachloride (Sigma-Aldrich, St. Louis, MO USA), but we found Al (III) much more effective for carbon deposition.
C/ZrO2 (3 μm, carbon loading = 8 %, w/w), used for comparison, was a generous gift of ZirChrom Separations Inc. (Anoka, MN, USA).
2.2.2. Procedure for metal adsorption
The amount of metal chloride to be added was based on the surface area of silica measured by N2 adsorption and the assumption that there are about 8 μmol/m2 silanol groups on the silica surface and that Al (III) would react with them in 1:1 ratio. The initial solution was strongly acidic (pH ~ 1, 0.1 mol/L HCl) to avoid oligomerization of metal cations and to ensure that silanol groups were not dissociated and some were positively charged. A large volume of solution was used to keep the metal concentration low (10 – 40 mmol/L) again to discourage oligomerization as the pH is raised. The silica slurry in 0.1 mol/L hydrochloric acid solution was prepared at 0.025 % (w/v) by magnetically stirring in round-bottomed flask to suspend the particles and then sonicating for 15 min to remove air from the pores of the silica. Then, the first half of the hydrochloric acid solution was added to the solution and stirred for 20 min. Subsequently, the second half of the hydrochloric acid solution with the requisite amount of aluminum chloride dissolved in it was slowly added in the center of the vortex. Finally, an excess of urea (0.5 mol/L) was added. The solution was rigorously stirred over the whole procedure.
The initial pH of the solution was 1 – 1.2 at 25 °C. The solution is heated to boiling under reflux. Urea in the solution converts slowly to ammonia, producing a slow and homogeneous increase of the pH. This slow and well-mixed pH change, combined with the ample availability of negatively charged deprotonated silanols on the high surface area silica, prevents the buildup of dissolved metal species that are prone to oligomerization; this oligomerization could nucleate independent particles or, even worse, block pores in the silica. The reaction was stopped (~ 2 h) as the pH reached 4 – 4.3 at 100 °C. The slurry was quickly cooled to room temperature in an ice bath. After filtering the solution, it was washed with water (HPLC grade), and the particles were dried in a vacuum oven overnight at 100 °C.
2.3. Colorimetric titration and metal analysis
Metal-treated silica underwent elemental analysis by ICP OES (Geology Department, University of Minnesota). An indirect colorimetric titration method was used to determine the residual Al (III) in the suspending solution after the reaction; this method is described thoroughly elsewhere [30], but it is worthwhile here to review the key steps. An excess of EDTA (0.01 mo/L) is added to an Al (III) solution, and the excess EDTA is titrated by 0.01 mol/L Pb(NO3)2 using xylenol orange as an indicator. About 5 % error in quantitation of Al (III) was obtained based on the triplicate trials of the titration of a standard Al (III) solution (0.005 mol/L in 0.25 mol/L HCl). Subsequently, titration of the filtered solution remaining after Al (III) treatment of silica showed that less than 5 % of the Al (III) provided remained in solution. Except where noted, these results, as well as the ICP OES results, confirm that the Al (III) is quantitatively adsorbed onto the silica surface.
2.4. Carbon deposition
Chemical vapor deposition (CVD) was used to deposit carbon on the metal-treated silicas. The apparatus and process are described in detail elsewhere [14]. The CVD was conducted at 700 °C for 6 h or more using hexanes (thermostated at 0 °C) as a carbon source. After each batch, the resulting material was sent to Atlantic Microlabs (Norcross, GA, USA) for the determination of its carbon content).
2.5. Column packing
The carbon packing material made here, and the C/ZrO2 commercial materials, were packed by the same procedures described elsewhere [13].
2.6. Chromatographic studies
All chromatographic data were collected by using an HP 1090 LC system controlled by Chemstation software version A.10.01 (Agilent Technologies, Wilmington, DE, USA) and equipped with an autosampler, thermostatting column compartment and photodiode array UV detector. All solutes were detected at 210 nm. Column dead times were measured from retention time of acetone. All retention data given represent averages of triplicate runs.
2.7. Conductivity measurement and N2 adsorption
The electrical conductivity of the carbon material was examined using the circuit as we described previously [14]. Nitrogen sorption was measured using a Micromeritics ASAP 2000 sorptometer (Micromeritics, Norcross, GA); the specific surface area was computed using the BET method [31], and pore size distributions were approximated using the BJH method [32].
3. Results and discussion
3.1. Different amounts of Al (III)
We treated 5 μm (Zorbax) silica particles with various amounts of Al (III) (2, 4 and 8 μm/m2). Assuming 8 μmol/m2 of silanol group as one monolayer these represent roughly quarter-, half- and full- monolayer coverages of Al (III).
We also attempted to prepare a surface coated with 12 μmol/m2, but this resulted in precipitation due to the presence of excess (non-adsorbed) Al (III) in solution when the pH reached values of 4.1. Modifying the treatment conditions by stopping the treatment at a lower final pH, i.e. 3.8 at 100 °C prevented nucleation of the excess Al (III) in the solution, but titration of the final solution showed excess Al (III) in the solution and indicated that only about 10 μmol/m2 had adsorbed on the surface of silica. Since attempting such a high surface loading of Al (III) fails to allow quantitative adsorption and risks the formation of oligomerized species, which could plug pores or nucleate new particles, we limited our chromatographic study to 8 μmol/m2 (a full monolayer) as the maximum amount of Al (III) treatment.
3.2. Effect of Al (III) treatment on pore structures
It is desirable to maintain the pore structure of silica after metal deposition. To confirm that Al (III) treatment did not affect the pore structure (i.e., that no oligomerization or precipitation of aluminum hydroxide plugged the pores) we conducted nitrogen sorptometry to monitor the effect of different amount of Al (III) treatment (4 and 8 μmol/m2) on the pore structure of silica. The surface area, pore volume and the average pore diameter show that the silica treated with 8 μmol/m2 of Al (III) lost only 10 % of its surface area and 14 % of its pore volume, which is a reasonable loss as compared to the estimated volume decrease based on the assumption of density of aluminum hydroxide (2.4 g/cm3). Compared to Leboda’s result of the loss of 40 % of the surface area after putting Zr (IV) on silica [26], our method maintains a high surface area. In addition, the estimated pore size distributions in Fig. 1 show that the original pore structure of silica is well-maintained after the Al (III) treatment.
Figure 1.
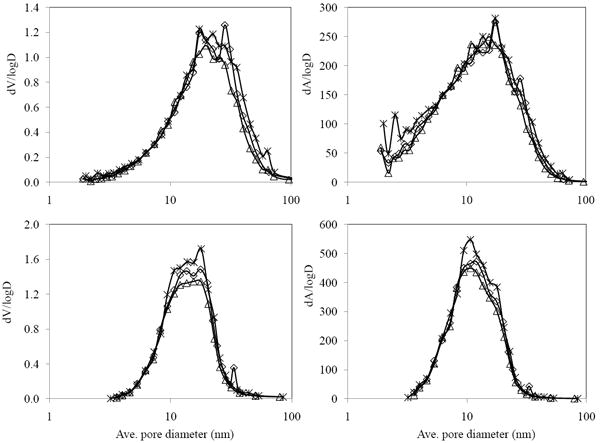
Differential pore size distributions for pore volume and surface area for various carbon loads computed by the BJH method from nitrogen adsorption (upper) and desorption (lower) data. (*) SiO2; (◇) half monolayer (4 μmol/m2) Al/SiO2; (Δ) one monolayer (8 μmol/m2) Al/SiO2.
3.3. Effect of Al (III) treatment on carbon deposition
Carbon was deposited on both quarter- and full-monolayer Al (III) treated silicas, and the carbon load was adjusted by varying the reaction time. Both substrates showed increases in the carbon load with the time, but the increase is much faster with a full monolayer of Al (III). Fig. 2 compares the rate of carbon deposition on these substrates and on alumina. Evidently, the substrate with more Al (III) allows the carbon to deposit faster, though it is still slower than that of alumina. Moreover, on the silica treated with full-monolayer Al (III) carbon deposits with time in a manner more similar to alumina than to silica covered with the quarter-monolayer Al (III). Finally, Fig. 2 shows that there is a considerable change in the rate of deposition of carbon at short time.
Figure 2.
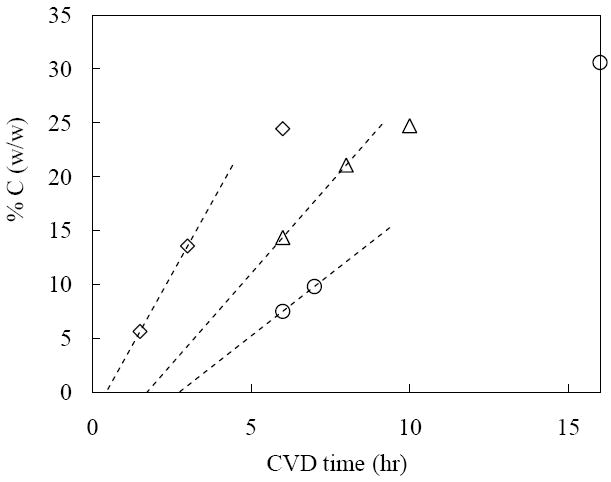
Plot of carbon loading (% C, w/w) vs. CVD time for alumina (◇), 8 μmolAl/SiO2 (Δ) and 2 μmolAl/SiO2 (○). The arrow is to help compare induction times between 8 μmolAl/SiO2 and 2 μmolAl/SiO2. CVD temperature is 700 °C for all data.
The 2 μmol/m2 of Al (III) treated silica requires about 32 % carbon to fully cover the Al (III) layer; the 8 μmol/m2 of Al (III) treated silica requires about 25 % carbon. We hypothesize that the latter has more uniform coating and thus less is required to sequester the Al (III). We did not go beyond these carbon loadings; these carbon loadings should give maximum retentivity [14].
3.4. Repeatability of the various preparations of carbon phases
Table 1 summarizes the repeatability of the chromatographic properties of several preparations of carbon phases deposited on 2 μmol/m2 of Al (III) treated silica (C/2μmolAl/SiO2). Three identical deposition runs gave an average of 30.6 % (w/w) of carbon with only 3 % standard deviation. The resulting materials were packed and evaluated by measuring the chromatographic efficiency and retention of nitrohexane, toluene and nitrobenzene. As shown in Table 1, this carbon phase gave reproducible efficiency (8 % RSD) and retention (7 – 12 % RSD). The plate count was obtained from nitrohexane as it provides the maximum value and the least peak tailing. Fig. 3 shows the chromatogram of a homolog series of nitroalkanes. We had to put about 32 % (w/w) of carbon for the final product because this loading provided both the maximum retentivity and full sequestration of the Al (III) sites on silica; this was ascertained by used of benzoic acid as a probe for accessible Al (III) as per the method of Trammell et al. [33]. For the same reasons, we finally deposited about 25 % (w/w) of carbon on 8 μmol/m2 of Al (III) treated silica. A chromatogram of the nitroalkanes on this material is shown in Fig. 3. This carbon phase gives higher efficiency (79,000 plate counts/m) than does 32 % C/2μmolAl/SiO2. The reasonably good efficiency and peak shapes of nitroalkanes suggest that all these carbon phases are potentially useful as HPLC packing materials.
Table 1.
Repeatability of the carbon deposition process
| Batch 1 | Batch 2 | Batch 3 | Average | %RSD | |
|---|---|---|---|---|---|
| %C (w/w) a | 31.6 | 29.5 | 30.7 | 30.6 | 3 |
| Plate count/m b | 45,800 | 46,300 | 52,400 | 48,200 | 8 |
| Symmetry c | 0.6 | 0.6 | 0.6 | 0.6 | 3 |
| k of nitrohexane d | 5.9 | 4.9 | 4.9 | 5.2 | 11 |
| k of toluene e | 1.3 | 1.4 | 1.5 | 1.4 | 7 |
| k of nitrobenzene e | 4.9 | 3.9 | 4.7 | 4.5 | 12 |
16 h CVD at 700 °C with hexane as source.
Plate count from nitrohexane.
Symmetry based on nitrohexane, LC conditions: F = 0.4 ml/min., T = 40 °C,
35/65 MeCN/water,
50/50 MeCN/water; All packed in 33 × 2.1 mm id. column.
Figure 3.
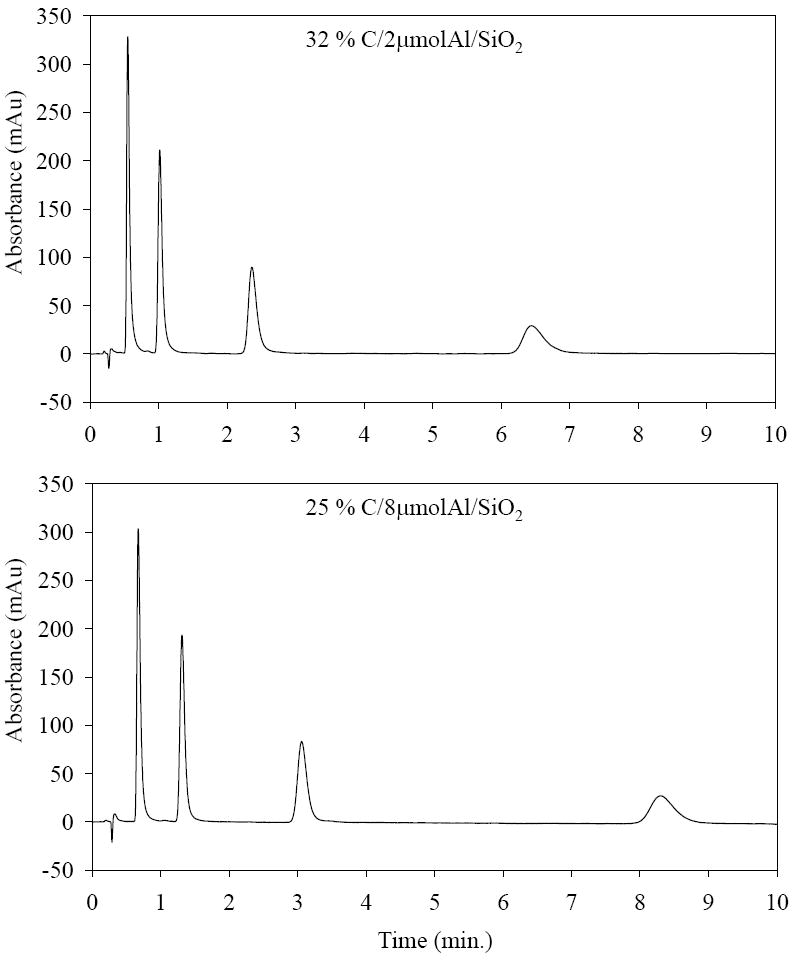
Chromatogram for homolog series of nitroalkanes (nitropropane, nitrobutane, nitropentane and nitrohexane). LC conditions: 20/80 MeCN/water, T = 40 °C, F = 0.4 ml/min. 33 × 2.1 mm id. column for both phases.
3.5. Chromatographic characteristics
We expected based on our previous results for carbon deposited on alumina that the C/Al/SiO2 should behave as a reversed phase. To confirm this, we plotted log k vs. the number of methylene groups (nCH2) for a homolog series of nitroalkanes (see Fig. 4). Reversed phase behavior is clearly demonstrated by linear increase of log k with the number of methylene group. It seems that one monolayer of carbon (ca. 8 %) is sufficient to convert silica to a reversed phase, but the retentivity of this material remains very low. As discussed below, we believe this must be due to the non-uniformity of the carbon cladding; more carbon is apparently needed to achieve a homogeneous outer layer of cladding.
Figure 4.
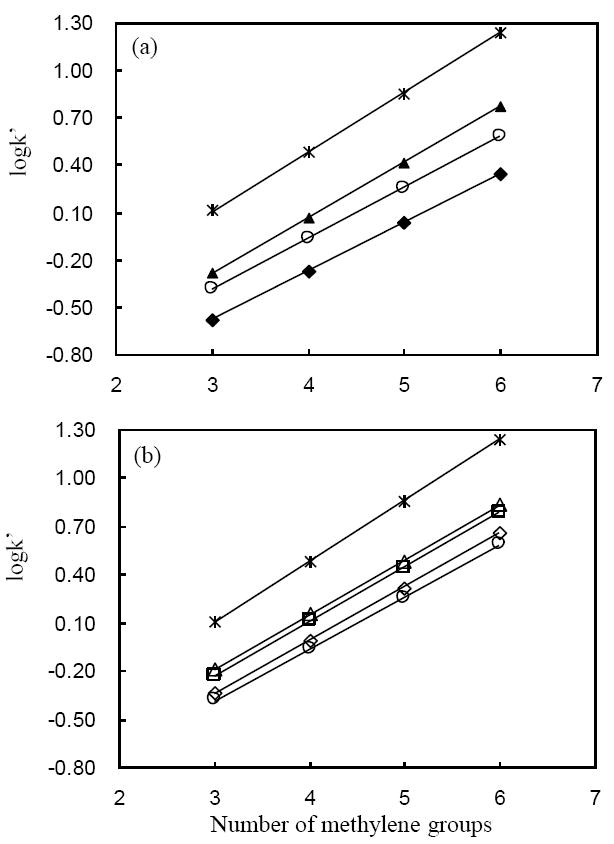
Plot of log k vs. number of methylene groups for nitroalkane homologs (nitropropane, nitrobutane, nitropentane and nitrohexane). (a) 2 μmolAl/SiO2: (▲) 32 %; (□) 8 % C; (b) 8 μmolAl/SiO2: (Δ) 25 %; (□) 21 %; (◇)14 % C; (○) C/ZrO2.; (*), 24 % C/Al2O3. LC conditions: F = 0.4 ml/min., T = 40 °C, 35/65 MeCN/water; all columns are 33 × 2.1 mm id. Error bars are not bigger than the markers in the plot.
From the slopes, we calculated the free energy of transfer per methylene group from the mobile to the carbon phase (ΔGCH2 = − 2.3BRT; B is the slope of the line in Fig. 4, R is gas constant and T is the temperature) [34]. As listed in Table 2, the free energy of transfer allows a quantitative comparison of the affinity of carbon phases to methylene groups. The affinity increases as we deposit more carbon on both Al (III) treated silicas. Table 2 indicates that with the exception of the 8 % C/2μmolAl/SiO2 the different C/Al/SiO2 materials are very similar in terms of both the slope and intercept. The slope of the 24 % C/Al2O3 phase is clearly different although it has similar number of carbon layers (5 monolayers) as the 32 % and 25 % C/Al/SiO2 (4 – 5 monolayers). We have no explanation for these small differences in slope. They could easily result from different degrees of oxidation during synthesis or perhaps to residual effects of the underlying substrate on retention. In fact, spectroscopic characterization (XPS and FT-IR) in the previous work did not detect any chemical difference of carbon between C/Al2O3 and C/ZrO2, which showed bigger difference in the slope of log k vs nCH2. As compared to the conventional octadecyl bonded silica (ODS) phase, all carbon phases exhibit higher slopes, thus stronger affinity for methylene groups. This is consistent with the observation that carbon phases give greater selectivity for a methylene group than do ODS phases [21].
Table 2.
The slopes, intercept and ΔGCH2 a obtained from different carbon phases
| Materials | Slope (B) | Intercept | R2 | ΔGCH2(cal/mol)c |
|---|---|---|---|---|
| ODS b | 0.301± 0.001 | -0.712±0.003 | 0.99999 | -431±1 |
| C/ZrO2 | 0.322± 0.002 | -1.349±0.003 | 0.99995 | -461±3 |
| 24 % C/Al2O3 c | 0.376± 0.003 | -1.02±0.01 | 0.99986 | -538 ±4 |
| 8 % C/2μmolAl/SiO2 | 0.305± 0.001 | -1.49±0.01 | 0.99986 | -437 ±1 |
| 32 % C/2μmolAl/SiO2 | 0.350± 0.002 | -1.33±0.01 | 0.99986 | -501 ±3 |
|
| ||||
| 14 % C/8μmolAl/SiO2 | 0.332± 0.002 | -1.34±0.01 | 0.99990 | -475 ±3 |
| 21 % C/8μmolAl/SiO2 | 0.338± 0.002 | -1.24±0.01 | 0.99987 | -484 ±3 |
| 25 % C/8μmolAl/SiO2 | 0.339± 0.002 | -1.21±0.01 | 0.99986 | -486 ±3 |
As shown in both Fig. 4 and 5, retentivity of C/Al/SiO2 for all polar and nonpolar compounds used increases with increasing carbon loads on both substrates. This implies that increase of surface coverage by carbon with higher carbon loads since bare Al/SiO2 surface does not retain these compounds. Interestingly, the pattern of the increase in retentivity, thus covering the surface with carbon is very different between 2 and 8 μmolAl/SiO2 (see Fig. 5). The retention of all compounds increases almost linearly (R2 of at least 0.990) with % C on the high Al/SiO2 with a statistically zero or nearly-zero (~ 0.2) intercept based on least squares analysis. However, the increase is not constant with carbon loads on the low Al/SiO2 showing non-zero intercept suggesting that a minimum amount of carbon is required before retention can be achieved. This comparison suggests that the surface is covered by the carbon more efficiently on the high Al/SiO2, which may induce carbon deposition more uniformly on the surface than the low Al/SiO2.
Figure 5.
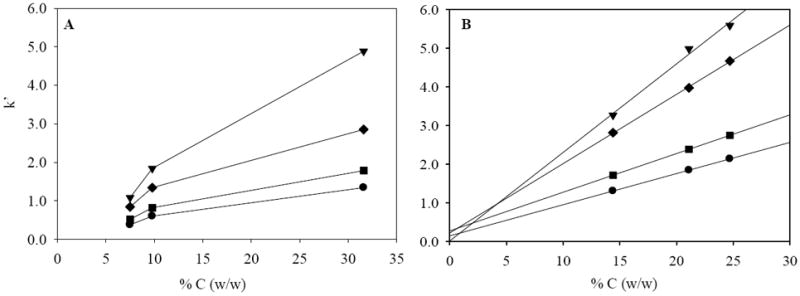
Plot of k vs. % C (w/w) for nitrobenzene (▼), p-xylene (◆), ethylbenzene (■) and toluene (●). A: 2μmolAl/SiO2; B: 8 μmolAl/SiO2, Extrapolation in B is based on linear regression of all data points (R2 for nitrobenzene, p-xylene, ethylbenzene and toluene are 0.990, 0.999, 0.999 and 0.999, respectively). LC conditions: F = 0.4 ml/min., T = 40 °C, 50/50 MeCN/water; all columns are 33 × 2.1 mm id. Error bars are not bigger than the markers in the plot.
3.6. Physical characteristics
Pore size distribution
Table 3 summarizes the pore parameters for materials made with different carbon loads. Both the surface areas and pore volumes decrease upon increasing the carbon load. However, the area loss per % C is much less when a higher amount of Al (III) is coated on the silica; the silica with 8 μmol/m2 Al (III) loses ~ 1.5 m2/g per % C, compared to ~ 3.5 m2/g per % C on the silica with only 2 μmol/m2 Al (III). We infer that the higher Al (III) treatment induces a more efficient and uniform carbon deposition, which is consistent with the observation that higher retentivity is achieved with lower carbon loading on 8 μmol/m2 of Al (III) treated silica.
Table 3.
Characteristics of different carbon loads on Al/SiO2
| CVD condition | %C (w/w) | Carbona (μmol/m2) | Hypothetical carbon thicknessb (monolayers) | SBETc (m2/g) | Pore volumed (cm3/g) | Nominal BET pore diameterd (nm) |
|---|---|---|---|---|---|---|
| SiO2 | n/a | n/a | n/a | 211 | 0.79 | 15.0 |
| 2 μmolAl/SiO2 | n/a | n/a | n/a | f- | - | - |
| 700 °C 6h | 8 | 30 | 1.1 | 183 | 0.64 | 14.0 |
| 700 °C 16h | 32 | 125 | 4.8 | 115 | 0.33 | 11.3 |
|
| ||||||
| 8μmolAl/SiO2 | n/a | n/a | n/a | 180 | 0.68 | 15.1 |
| 700 °C 6h | 14 | 67 | 2.5 | - | - | - |
| 700 °C 8h | 21 | 98 | 3.7 | 149 | 0.47 | 12.6 |
| 700 °C 11h | 25 | 144 | 4.4 | 147 | 0.43 | 11.7 |
See ref 14.
Surface area (SBET)
Pore volume obtained from single total pore volume less than 217, 254, 222, 131, 386, 123 nm diameter at P/Po of 0.991, 0.992, 0.991, 0.985, 0.995 and 0.984, respectively (from top to bottom)
Nominal pore diameter of an equivalent single cylinder, calculated by 4x (pore volume)/SBET.
As 4 and 8 μmol Al/SiO2 hardly affect the original pore structure of SiO2, we did not obtain the data for 2 μmolAl/SiO2.
Neither substrate gave an absolutely uniform carbon deposition; both require much more than a theoretical monolayer of carbon to achieve maximum retentivity. Assuming that the carbon is graphitic and coated uniformly, we calculated the number of carbon monolayers from the BET data and the known weight of the carbon for each material as shown in Table 3. Theoretically, the % C required to form one monolayer is about 7 % (w/w). However, as mentioned above, about 32 % and 25 % of carbon are needed for the low and high levels of Al (III) treatments of silica respectively to obtain maximum retentivity and to fully sequester the Al (III) sites on the silica. These carbon loads correspond to about 4 – 5 carbon monolayers which strongly suggests that carbon deposition is not homogeneous. That is, we believe that carbon deposition does not proceed monolayer by monolayer, which is, in fact, commonly observed from deposition of pyrolytic carbon [35]. However, this result is rather similar to the number of monolayers we had to put on alumina for its full coverage of the substrate. It should also be noted that the C/ZrO2 required about 8 % (w/w) of carbon to ensure complete coating of the surface so that all solute access to the ZrO2 substrate was blocked; this is equivalent to about 11 monolayers of carbon on this low surface area material.
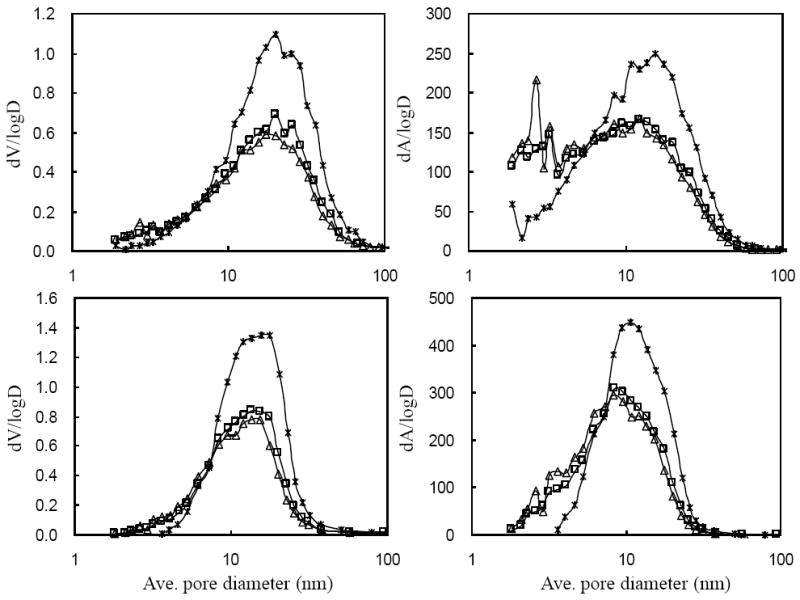
To estimate the pore size distributions, pore area and volume distributions curves based on nitrogen adsorption and desorption were computed using the BJH method. As shown in Fig. 6, different levels of Al (III) on silica surface induce carbon deposition in a very different fashion. It is possible that when too little Al (III) is used, carbon forms with a significant induction delay (see Fig. 2) and in a “patchier” manner, leaving uncoated Al/SiO2 surface. When a monolayer of Al (III) is used, carbon is deposited without so much induction delay, and with a more uniform covering of the surface. This cladding must still be rough enough, though, to produce a texture that shows up as new area with a small apparent pore size; these new small pores may just be the nanoscale texture of the rough, but uniform, carbon coating.
Figure 6.
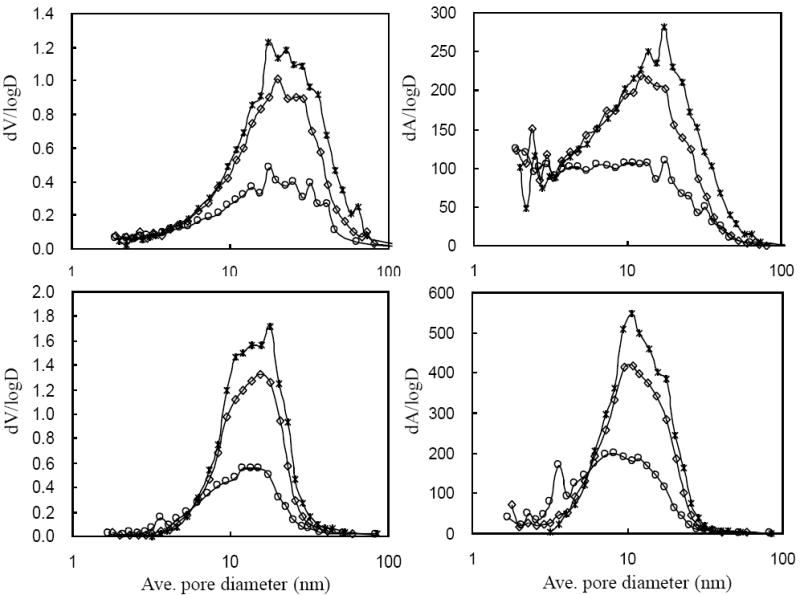
a.Differential pore volume and area distributions for various carbon loads on 2 μmolAl/SiO2 computed by the BJH method from nitrogen adsorption (upper) and desorption (lower). (*) bare SiO2; (◇) 8 % C; (○) 32 % C.
b.Differential pore volume and area distributions for various carbon loads on 8 μmolAl/SiO2; adsorption (upper) and desorption (lower); (*) bare 8 μmolAl/SiO2; (□) 21 % C; (Δ) 25 % C.
Resistivity
The resistivities of the carbon materials on different substrates are compared in Table 4. The materials include graphite and carbon phases on the various oxides. Since carbon is conductive and silica is not, we expect that those materials with a lower fraction of silica covered by carbon will have higher resistivity due to less continuous carbon layers. Both materials studied here have as low a resistivity as that of carbon on alumina. As these carbon coated materials have about the same number of carbon monolayers and are prepared at the same temperature, this result implies a high coverage of the silica by carbon. It should be noted that the 25 % carbon loaded material shows resistance comparable to 32 % carbon, which may again suggest a more efficient carbon deposition on the high Al (III) treated silica. The similarity in the resistivity of these carbon clad materials to that of graphite indicates a considerable degree of sp2 hybridization of the carbon. Low resistivity also implies high polarizability of carbon surface, which should enhance retentivity [24].
Table 4.
Electrical resistance of various carbon materialsa
| Materials | Log (resistance, Ω)b |
|---|---|
| 32 % C/Al/SiO2 | 2.6 ± 0.1 |
| 25 % C/Al/SiO2 | 1.9 ± 0.1 |
| 24 % C/Al2O3 | 2.12 ± 0.07 |
| C/ZrO2 | 3.35 ± 0.08 |
| Graphite | 2.20 ± 0.05 |
See ref. 14 for the calculation of the resistance
Average of triplicate measurement
4. Conclusion
A novel method is proposed to activate silica with metals for the deposition of a carbon surface for use as a liquid chromatographic media. Al (III) (≤ 1 monolayer), the most effective metal in our hands, is chemically adsorbed on silica by interaction with deprotonated silanol groups on the surface of silica. By adapting a method previously used to induce homogeneous precipitation, we used the slow hydrolysis of urea to homogeneously generate metal hydroxides during the reaction. All Al (III) added to solution was fully adsorbed on the silica surface as confirmed by titration of the filtered solution and by ICP OES analysis of the particles. Unlike Leboda’s methods, the present method provides a thin, uniform film of metallic species on silica as shown by the insignificant changes in pore structure upon deposition of the metallic species.
Subsequently, a carbon phase is formed on the Al (III) treated silica by high temperature chemical vapor deposition (CVD). Carbon deposition is more efficient and uniform when a full monolayer rather than a quarter monolayer of Al (III) is pre-deposited on the silica. In terms of its carbon deposition properties the more heavily Al (III) coated silica behaves more similarly to pure alumina than does the lightly clad material. The best chromatographic stationary phases were obtained with about 32 % and 25 % carbon on the quarter and one monolayer of Al (III) clad silica, respectively. The resulting carbon materials offer good chromatographic efficiency and can be prepared reproducibly (3 % standard deviation). These new carbon phases behave as reversed phases and provide higher retentivity than does C/ZrO2. Further chromatographic characterization of these materials will be presented in subsequent work. However, given the chromatographic data, these new carbon stationary phases are very useful as HPLC packing materials. Considering the wide variety of sizes and types of silica available, our new method shows potential to developing various types of carbonaceous materials for HPLC supports.
Acknowledgments
The authors acknowledge the financial support from the National Institute of Health (GM 054585). We also thank Agilent Technologies (Palo Alto, CA, USA) and ZirChrom Separations Inc. (Anoka, MN, USA) for the donation of porous silica and carbon clad zirconia, respectively.
Footnotes
Publisher's Disclaimer: This is a PDF file of an unedited manuscript that has been accepted for publication. As a service to our customers we are providing this early version of the manuscript. The manuscript will undergo copyediting, typesetting, and review of the resulting proof before it is published in its final citable form. Please note that during the production process errors may be discovered which could affect the content, and all legal disclaimers that apply to the journal pertain.
References
- 1.Cserhati T. Biomed Chromatogr. 2009;23:111. doi: 10.1002/bmc.1168. [DOI] [PubMed] [Google Scholar]
- 2.Di Corcia A, Samperi R, Marcomini A, Stelluto S. Anal Chem. 1993;65:907. [Google Scholar]
- 3.Guenu S, Hennion MC. J Chromatogr A. 1994;665:243. [Google Scholar]
- 4.Di Corcia A, Liberti A, Sambucini C, Samperi R. J Chromatogr. 1978;152:63. [Google Scholar]
- 5.Tanaka N, Tanigawa T, Kimata K, Hosoya K, Arai T. J Chromatogr. 1991;549:29. [Google Scholar]
- 6.Barrett DA, Pawula M, Knaggs RD, Shaw PN. Chromatographia. 1998;47:667. [Google Scholar]
- 7.Forgacs E, Cserhati T. Chromatographia. 1992;33:356. [Google Scholar]
- 8.Forgacs E, Cserhati T, Pharm J. Biomed Anal. 1998;18:15. doi: 10.1016/s0731-7085(98)00159-9. [DOI] [PubMed] [Google Scholar]
- 9.Jackson PT, Kim T-Y, Carr PW. Anal Chem. 1997;69:5011. doi: 10.1021/ac970561h. [DOI] [PubMed] [Google Scholar]
- 10.Weber TP, Carr PW. Anal Chem. 1990;62:2620. [Google Scholar]
- 11.Knox JH, Ross P. Adv Chromatogr (N Y) 1997;37:73. [PubMed] [Google Scholar]
- 12.Unger KK. Anal Chem. 1983;55:361A. [Google Scholar]
- 13.Stoll DR, Cohen JD, Carr PW. J Chromatogr A. 2006;1122:123. doi: 10.1016/j.chroma.2006.04.058. [DOI] [PubMed] [Google Scholar]
- 14.Paek C, Carr PW, McCormick AV. J Chromatogr A. 2010;1217:6475. doi: 10.1016/j.chroma.2010.08.037. [DOI] [PMC free article] [PubMed] [Google Scholar]
- 15.Majors RE. LCGC North Am. 2009;27:956. [Google Scholar]
- 16.Knox JH, Saleem M. J Chromatogr Sci. 1969;7:614. [Google Scholar]
- 17.Poppe H. J Chromatogr A. 1997;778:3. [Google Scholar]
- 18.Kirkland JJ, Truszkowski FA, Dilks CH, Engel GS. J Chromatogr A. 2000;890:3. doi: 10.1016/s0021-9673(00)00392-7. [DOI] [PubMed] [Google Scholar]
- 19.Wang X, Barber WE, Carr PW. J Chromatogr A. 2006;1107:139. doi: 10.1016/j.chroma.2005.12.050. [DOI] [PubMed] [Google Scholar]
- 20.Knox JH, Kaur B, Millward GR. J Chromatogr. 1986;352:3. [Google Scholar]
- 21.Weber TP, Jackson PT, Carr PW. Anal Chem. 1995;67:3042. [Google Scholar]
- 22.Leboda R. Chromatographia. 1981;14:524. [Google Scholar]
- 23.Kamegawa K, Yoshida H. J Colloid Interface Sci. 1993;159:324. doi: 10.1016/j.jcis.2003.07.003. [DOI] [PubMed] [Google Scholar]
- 24.Engel TM, Olesik SV, Callstrom MR, Diener M. Anal Chem. 1993;65:3691. [Google Scholar]
- 25.Gierak A, Leboda R. J Chromatogr A. 1989;483:197. [Google Scholar]
- 26.Leboda R, Gierak A, Hubicki Z, Lodyga A. Mater Chem Phys. 1991;30:83. [Google Scholar]
- 27.Kung HH, Ko EI. Chem Eng J. 1996;64:203. [Google Scholar]
- 28.Laitinen HA. Chemical Analysis. New York: 1960. p. 138. [Google Scholar]
- 29.Aiken B, Hsu WP, Matijevic E. J Mater Sci. 1990;25:1886. [Google Scholar]
- 30.Langmyhr FJ, Kritiansen H. Anal Chim Acta. 1959;20:524. [Google Scholar]
- 31.Brunauer S, Emmett PH, Teller E. J Am Chem Soc. 1938;60:309. [Google Scholar]
- 32.Barrett EP, Joyner LG, Halenda PP. J Am Chem Soc. 1951;73:373. [Google Scholar]
- 33.Trammell BC, Hillmyer MA, Carr PW. Anal Chem. 2001;73:3323. doi: 10.1021/ac010032k. [DOI] [PubMed] [Google Scholar]
- 34.Melander WR, Horvath C. Chromatographia. 1982;15:86. [Google Scholar]
- 35.Bourrat X, Langlais F, Chollon G, Vignoles GL, Braz J. Chem Soc. 2006;17:1090. [Google Scholar]


