

Abstract
Purpose
To validate a T1-independent, T2*-corrected fat quantification technique that uses accurate spectral modeling of fat using a homogeneous fat-water-SPIO phantom over physiologically expected ranges of fat percentage and T2* decay in the presence of iron overload.
Materials and Methods
A homogeneous gel phantom consisting of vials with known fat-fractions and iron concentrations is described. Fat-fraction imaging was performed using a multi-echo chemical shift-based fat-water separation method (IDEAL), and various reconstructions were performed to determine the impact of T2* correction and accurate spectral modeling. Conventional two-point Dixon (in-phase/out-of-phase) imaging and MR spectroscopy were performed for comparison with known fat-fractions.
Results
The best agreement with known fat-fractions over the full range of iron concentrations was found when T2* correction and accurate spectral modeling were used. Conventional two-point Dixon imaging grossly underestimated fat-fraction for all T2* values, but particularly at higher iron concentrations.
Conclusion
This work demonstrates the necessity of T2* correction and accurate spectral modeling of fat in order to accurately quantify fat using MRI.
Keywords: fat-water phantom, fat quantification, T2* decay, accurate spectral modeling, hepatic steatosis, IDEAL, iron quantification
INTRODUCTION
In vivo fat quantification using magnetic resonance techniques has recently emerged as a topic of great clinical interest, with specific applications in the liver(1, 2). Quantification of hepatic fat and adipose tissue has become increasingly important given the increasing prevalence of non-alcoholic fatty liver disease (NAFLD) and obesity in western societies. In addition to intracellular fatty accumulation (steatosis), NAFLD patients commonly have elevated intra-hepatic iron stores. Steatosis can progress to inflammation, liver injury and fibrosis, eventually leading to cirrhosis, which predisposes patients to hepatocellular carcinoma and liver failure(3-5). However, the earliest biomarker of NAFLD is steatosis, and quantification of steatosis has been the focus of recent efforts with quantitative MRI methods, providing a promising non-invasive alternative to biopsy, the current gold standard for diagnosis of NAFLD.
An imaging method for accurate quantification of liver fat should be independent of platform and pulse sequence parameters, in order to reflect the underlying biology of triglyceride concentration in tissue. The method must address confounding factors that can bias fat quantification, including T1 bias(8, 9), noise-related bias(8), and T2* decay(9, 10), and spectral complexity of fat(9, 11). First, T1-weighted sequences lead to an over-estimation of fat due to the shorter T1 values of fat compared to water(12). Second, noise-related bias occurs at low fat-fractions when using magnitude images to calculate fat-fraction images(8, 13). Third, T2* signal decay during acquisition of echoes will corrupt separation of water and fat. This is particularly important in patients with iron overload, which commonly occurs in patients with NAFLD. The presence of iron accelerates T2* decay and corrupts the ability of MRI to quantify fat because of confounded separation of fat and water signals without simultaneous T2* correction(10). Lastly, most chemical shift water-fat separation methods have conventionally modeled fat as a single spectral peak -3.5 ppm relative to water, although multiple spectral peaks of fat exist(1, 9, 11). Two independent groups demonstrated that accurate spectral modeling of fat, which accounts for multiple spectral fat peaks in the fat signal model, can be used to improve the accuracy of fat quantification(9, 11).
IDEAL (Iterative Decomposition of water and fat with Echo Asymmetry and Least-squares estimation) is an emerging multi-echo chemical shift-based method that has shown promise for accurate quantification of fat(14-16). IDEAL provides robust separation of water and fat, and can additionally measure and correct for T2*(10) and accurately model the multiple spectral peaks of fat(11). Previous work has successfully validated the low flip angle approach to avoid T1 bias(8, 9), and two methods to avoid noise related bias(8). The primary purpose of this work is to evaluate the use of T2* correction and accurate spectral modeling using IDEAL for fat quantification since, to date, validation has not been reported.
Although there have been water-fat phantoms recently described for the purposes of validating MRI fat quantification techniques(17), there have been no previously described phantoms that incorporate fat, water, and iron, which is likely due to solubility challenges of these components. The second purpose of this work is to describe a solid, homogeneous fat-water-SPIO phantom for testing and validation of MRI fat quantification techniques, even in the presence of dramatically shortened T2*. The final purpose of this work is to compare the ability of conventional 2-point Dixon imaging with a T1-independent chemical shift-based fat-water separation method (IDEAL) with T2* correction and accurate spectral modeling for fat quantification.
METHODS
Phantom Construction
A fat-water-iron phantom comprised of forty-nine 20mL scintillation vials in varying true fat volume percentages (0, 2.5, 5, 10, 20, 30, 40, 50 and 100%) and iron concentrations (0, 10, 20, 30, 40, and 50 μg/mL) was constructed, based on a modified version of the phantom described by Bernard et al(17). In addition, the phantom described by Bernard et al did not contain iron. These fat percentages and iron concentrations were chosen to reflect the range of values seen in patients with hepatic steatosis (0-50%)(18, 19), and values seen arising from adipose tissue (~100%). T2* values in healthy livers range between 25 and 35ms, although T2* values less than a few milliseconds can been observed in patients with very severe hepatic iron overload(20).
Appropriate volumes of peanut oil were dispensed by weight into vials, assuming the density of peanut oil (0.916 g/cm3). Peanut oil was chosen because it has a proton NMR spectrum similar to that of triglyceride protons in adipose tissue(11). Peanut oil is comprised of approximately 9% palmitic, 4% stearic, 55% oleic, and 27% linoleic acids (21). Aliquots of superparamagnetic iron oxide (SPIO) (Feridex, Bayer Healthcare) were added to the vials to shorten T2* values.
A “water solution” comprising the water fraction of the phantom contained the following in distilled, deionized water: 43mM sodium dodecyl sulfate (surfactant, Sigma Aldrich, St. Louis, MO), 43mM sodium chloride, 3.75mM sodium azide, and 0.3mM gadobenate dimeglumine (MultiHance, Bracco Inc.). Agar (2.0% w/v) was added over heat with stirring until melted. Volumes of the water solution were poured into vials containing pre-measured peanut oil and SPIO volumes, mixed through gentle inversion for approximately two minutes, and formed a solid gel when cooled to room temperature. Fat-fractions (0.0, 2.7, 5.4, 10.7, 21.2, 31.6, 41.8, 51.9, and 100.0%) and iron concentrations were re-calculated to reflect the actual volume of the water mixture present due to losses in transfer and cooling.
Micrographs of examples of the phantom (50% fat with 20 μg Fe/mL, and 10% fat with 20 μg Fe/mL) were created on a separate day to investigate the microscopic behavior of the emulsion at a low and high fat-fraction. A drop of the fresh emulsion was placed onto a slide with a coverslip before complete cooling occurred. Photographs and measurements of structure size at 40x magnification were taken using MicroSuite (Basic Edition v 2.3 (Build 1121), Olympus America Inc., Center Valley, PA).
Imaging Sequence and Parameters
Imaging was performed on a 1.5T clinical MRI scanner (TwinSpeed HDx, GE Healthcare, Waukesha, WI) using an investigational version of a 3D spoiled gradient echo (SPGR) IDEAL(15) acquisition and a single channel quadrature head coil. The exam consisted of three multi-echo acquisitions using fly-back gradients: 6-echo, 9-echo, and 16-echo, all with echo spacing of 2.2ms (first TE = 1.3ms). Imaging parameters for multi-echo IDEAL included: 256×256 matrix, BW = ±100kHz, FOV = 35×35cm, and 14 slices with slice thickness of 8mm. Repetition time (TR) and total imaging time for the 6-echo, 9-echo, and 16-echo sequences were 16.4, 23.3, and 42.7ms, and 0:59, 1:24, and 2:34, respectively. Conventional 2D 2-point Dixon (in-phase/out of phase)(22) images were also acquired, with TE = 2.3/4.6ms and TR = 120ms. Other image parameters included: 256×256 matrix, BW = ±62.5kHz, FOV = 35×35 cm, slice = 8mm, for a total scan time of 32 seconds. Previous work has demonstrated the use of low flip angles as an effective method to render fat quantification methods independent of T1 bias(8, 9), so all sequences were acquired with a flip angle of 5°.
MR spectroscopy was performed using single voxel PRESS (Point RESolved Spectroscopy) on vials without iron (0-100% fat); these vials were scanned to verify the accuracy of the known fat-fractions. Spectra were also acquired for all iron concentrations at 30% fat to investigate the potential for differential effects of iron on the water and fat peaks. MR spectra were acquired without water suppression using a voxel size of 12mm × 12mm × 12mm, TE/TR = 26/3500ms, BW = ± 2500Hz, and 2048 readout points. PRESS spectra were also acquired with increasing echo times of 26, 36, 46, 56, 66, 76, 86, 106, and 146ms to measure the T2 values of water and fat.
Image Reconstruction
Reconstruction of the IDEAL data acquired with varying echo train lengths (6, 9, and 16) was performed with and without T2* correction, and both with and without accurate spectral modeling of fat, creating four distinct reconstructions for each of the multi-echo IDEAL acquisitions. The T2*-corrected IDEAL algorithm corrects for T2* decay by using a modified signal model that estimates water, fat, and T2* simultaneously to decouple the effects of T2* from those induced by the chemical shift of fat(10). By performing T2* correction, the effects of enhanced diffusion of water (T2) in the presence of iron have also been corrected since these effects are included in the shortened T2* decay when spoiled gradient echo imaging is used. Further, a multi-peak IDEAL reconstruction was used that accounts for multiple spectral peaks of fat(11). This multi-peak reconstruction uses pre-calibrated amplitudes of the multiple spectral fat peaks, which are then used in the IDEAL algorithm. This pre-calibrated spectrum assumes that the effects of SPIOs are constant for all fat peaks because all signal-generating proton moieties are found on the triglyceride molecule. A magnitude discrimination method was used to avoid noise bias for all reconstructions(8). Fat J-coupling effects were not considered because a low flip angle gradient echo method was used.
Two-point Dixon fat-fraction images were post-processed in Matlab (R2007b, Mathworks, Natick, MA) using the in-phase and out of phase images according to Dixon et al(22). MRS spectra were post-processed using Matlab to integrate the area under the water peak and total area under the fat peaks, to obtain MRS fat-fractions in vials without iron. For vials with iron, the cluster of fat peaks centered at 1.3ppm was visible as one broad peak due to line broadening. Measured T2 values of water and fat were used for T2 correction of MRS fat-fractions in vials without iron.
Statistical Analysis
Region of interest (ROI) measurements were taken on fat-fraction images of each vial for each acquisition and reconstruction method, using ROIs identical in size (138 pixels) and from the same slice. Linear regression was performed between known fat-fractions and MRS fat-fractions, and between measured fat-fractions for each imaging sequence and reconstruction method and the known fat-fractions. Perfect correlation would have a slope of 1.0 and intercept of 0.0. Two-sided t-tests determined whether statistically significant differences exist between obtained slope values and 1.0, and obtained intercept values and 0.0 (α = 0.05). One-sided ANOVA tests determined whether statistically significant differences exist between 6-, 9-, and 16-echo IDEAL fat-fractions and R2* values for each iron concentration and within reconstructions. Regression and t-tests were performed using Excel (V10.0 SP3, Microsoft, Redmond, WA), and ANOVA testing was performed using Matlab.
RESULTS
Figure 1A displays vials at 20% fat, with increasing iron concentration from left to right, demonstrating the successful construction of the phantom. Micrographs of the phantom emulsion are shown in Figures 1B and C, which clearly show the presence of lipid globules or vacuole-like structures, which were also seen in the absence of iron.
Figure 1.
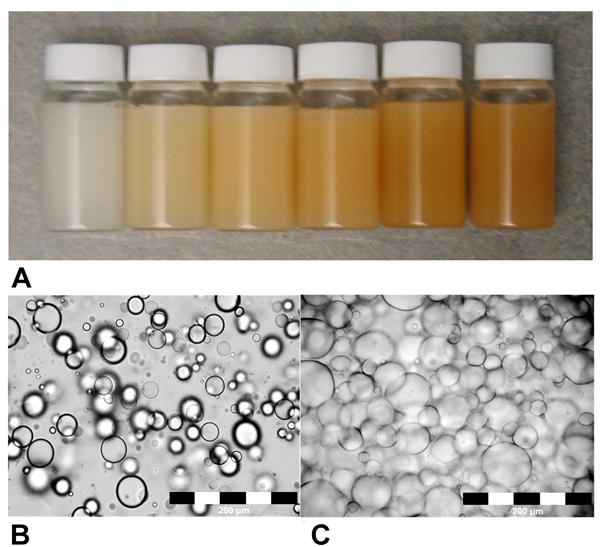
(A) Photograph of vials containing 20% fat with iron concentrations of 0, 10, 20, 30, 40, and 50 μg Fe/mL (left to right) demonstrate successful homogenization of fat, water, and iron components. Vials are lying horizontally to demonstrate that the resulting product, with the exception of 100% peanut oil, is a rigid gel at room temperature. Photomicrographs (20x) of (B) 50% fat and (C) 10% fat emulsions with 20 μg Fe/mL. Lipid globules are easily visible as round structures, and are confirmed not to be air bubbles by a surgical pathologist. Although the vials are macroscopically homogeneous, lipid globules are easily visible and create microscopic heterogeneity. The mean diameter of the globules in the 50% fat emulsion is 234 ± 66 μm, and 47 ± 19 μm for the 10% fat emulsion.
IDEAL fat-fraction images were of high quality and showed little or no artifact (Figure 2). The known fat-fractions agreed with T2-corrected MRS fat-fractions in vials without iron: slope = 1.01±0.01 (p=0.5), intercept = -0.005±0.004% (p=0.3), r2 > 0.99. Measurement of spectroscopy fat-fraction was not performed in vials with iron due to line broadening.
Figure 2.
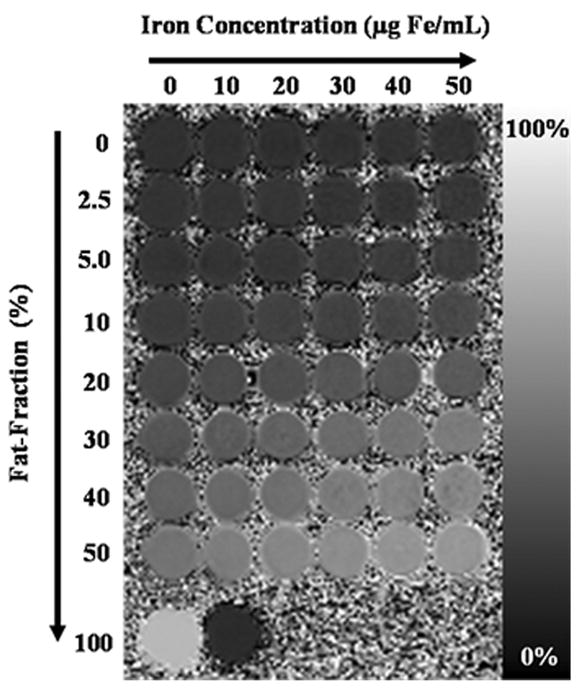
Fat-fraction image of phantom reconstructed using six echoes and including both multi-peak and T2* correction, demonstrates excellent image quality. Fat-fraction (%) increases from top to bottom, and iron concentration (μg Fe/mL) increases from left to right. The bottom row includes 100% peanut oil vial (left) and 43mM sodium dodecyl sulfate in water (right). One vial of 43mM SDS was included as part of the phantom because it contains a long hydrocarbon chain, which might appear as a fat signal. A significant fat signal was not observed from the SDS vial (-1.22 ± 0.81%) because of its low concentration (43mM). Relatively constant fat-fractions are seen across iron concentrations for each fat percentage.
Figure 3A shows the calculated 2-point Dixon fat-fraction image, and Figure 3B plots the calculated 2-point Dixon imaging fat-fractions against known fat-fractions for all iron concentrations. Linear regression results are summarized in Table 1. Conventional 2-point Dixon imaging grossly underestimated fat-fraction for all T2* values. This error became more pronounced with increasing iron concentration.
Figure 3.
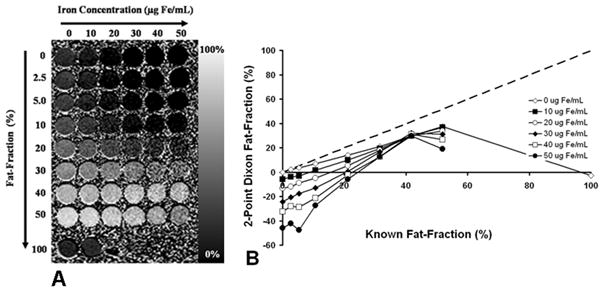
Fat-fractions measured using conventional 2-point Dixon imaging. (A) The fat-fraction image calculated using Equation 2 shows decreasing apparent fat-fraction (%) with increasing iron concentration (μg Fe/mL). (B) Measurements from regions of interest from this image are also plotted. The ambiguity known to occur with fat-fractions more than 50% is demonstrated with the 100% fat vial, which has an apparent fat-fraction close to 0.0 (-2.98 ± 0.25%). Linear regression results show excellent correlation (r2 = 0.99) for fat-fractions at 0 μg Fe/mL when the 100% vial is omitted. Slope = 0.72 ± 0.01 (p ≪ 0.001), intercept = -0.48 ± 0.40% (p = 0.26), although the slope indicates underestimation of fat-fraction. Dashed line represents unity.
Table 1.
2-Point Dixon Fat-Fractions and Chemical Shift-Based Fat-Fractions Compared to Known Fat-Fraction
| 0 μg Fe/mL | 10 μg Fe/mL | 20 μg Fe/mL | 30 μg Fe/mL | 40 μg Fe/mL | 50 μg Fe/mL | |
|---|---|---|---|---|---|---|
| Conventional Two-Point Dixon
| ||||||
| R2 * | 0.99 | 0.99 | 0.99 | 0.97 | 0.96 | 0.91 |
|
| ||||||
| Slope* | 0.72 ± 0.01 | 0.84 ± 0.02 | 0.97 ± 0.04 | 1.18 ± 0.08 | 1.32 ± 0.11 | 1.54 ± 0.20 |
| p ≪ 0.001 | p ≪ 0.001 | p = 0.5 | p = 0.05 | p = 0.03 | p = 0.03 | |
|
| ||||||
| Intercept* | -0.0048 ± 0.0039 | -0.068 ± 0.0051 | -0.14 ± 0.010 | -0.23 ± 0.021 | -0.32 ± 0.03 | -0.45 ± 0.053 |
| p = 0.26 | p ≪ 0.001 | p ≪ 0.001 | p ≪ 0.001 | p ≪ 0.001 | p = 0.00006 | |
|
| ||||||
| Single-peak reconstruction without T2* correction
| ||||||
| R2 | 0.96 | 0.98 | 0.99 | 0.97 | 0.99 | 0.99 |
|
| ||||||
| Slope | 0.94 ± 0.07 | 0.81 ± 0.05 | 1.00 ±0.05 | 1.12 ± 0.03 | 1.1 ± 0.04 | 1.17 ± 0.05 |
| p = 0.5 | p = 0.01 | p = 0.94 | p = 0.01 | p = 0.01 | p = 0.02 | |
|
| ||||||
| Intercept | -0.034 ± 0.030 | 0.021 ± 0.013 | 0.023 ± 0.013 | 0.043 ± 0.0085 | 0.054 ± 0.012 | 0.075 ± 0.014 |
| p = 0.3 | p = 0.2 | p = 0.07 | p = 0.001 | p = 0.003 | p = 0.001 | |
|
| ||||||
| Multi-peak reconstruction without T2* correction
| ||||||
| R2 | 0.99 | 0.99 | 0.99 | 0.99 | 0.98 | 0.97 |
|
| ||||||
| Slope | 0.93 ± 0.02 | 0.96 ± 0.03 | 1.06 ± 0.02 | 1.08 ± 0.04 | 1.07 ± 0.06 | 1.00 ± 0.07 |
| p = 0.01 | p = 0.2 | p = 0.05 | p = 0.1 | p = 0.3 | p = 0.9 | |
|
| ||||||
| Intercept | 0.044 ± 0.0089 | 0.10 ± 0.0075 | 0.15 ± 0.00066 | 0.21 ± 0.010 | 0.25 ± 0.015 | 0.30 ± 0.020 |
| p = 0.001 | p ≪ 0.001 | p < 0.001 | p ≪ 0.001 | p ≪ 0.001 | p ≪ 0.001 | |
|
| ||||||
| Single-peak reconstruction with T2* correction
| ||||||
| R2 | 0.97 | 0.99 | 0.99 | 0.99 | 0.99 | 0.99 |
|
| ||||||
| Slope | 0.96 ± 0.07 | 0.85 ± 0.03 | 0.99 ± 0.03 | 1.11 ± 0.02 | 1.20 ± 0.04 | 1.24 ± 0.05 |
| p = 0.6 | p = 0.004 | p = 0.8 | p = 0.0002 | p = 0.001 | p = 0.003 | |
|
| ||||||
| Intercept | -0.04 ± 0.027 | 0.0019 ± 0.0094 | 0.0044 ± 0.0088 | 0.011 ± 0.0042 | 0.016 ± 0.010 | 0.029 ± 0.014 |
| p = 0.2 | p = 0.8 | p = 0.6 | p = 0.03 | p = 0.2 | p = 0.1 | |
|
| ||||||
| Multi-peak reconstruction with T2* correction
| ||||||
| R2 | 0.99 | 0.99 | 0.99 | 0.99 | 0.99 | 0.99 |
|
| ||||||
| Slope | 0.98 ± 0.02 | 1.06 ± 0.03 | 1.18 ± 0.03 | 1.31 ± 0.02 | 1.40 ± 0.05 | 1.43 ± 0.07 |
| p = 0.3 | p = 0.1 | p = 0.001 | p ≪ 0.001 | p = 0.0001 | p = 0.0003 | |
|
| ||||||
| Intercept | 0.00075 ± 0.0092 | 0.0099 ± 0.0091 | 0.010 ± 0.0094 | 0.018 ± 0.0050 | 0.028 ± 0.012 | 0.045 ± 0.018 |
| p = 0.9 | p = 0.3 | p = 0.3 | p = 0.007 | p = 0.06 | p = 0.04 | |
100% Fat vial has been omitted from linear regression because of the fat-water ambiguity.
Figures 4A-D plot fat-fraction measurements for each of the four IDEAL reconstructions against known fat-fractions at all iron concentrations, using the 6-echo acquisition. Linear regression results are summarized in Table 1. An underestimation of fat-fraction occurs in data when accurate spectral modeling of fat is not used. T2* correction improves agreements with known fat-fractions compared to data without T2* correction, and at low fat-fractions for all iron concentrations. Although the apparent fat-fraction increases with increasing iron concentration, this is effect is less pronounced with T2* correction and overall better agreement is seen when accurate spectral modeling is used.
Figure 4.
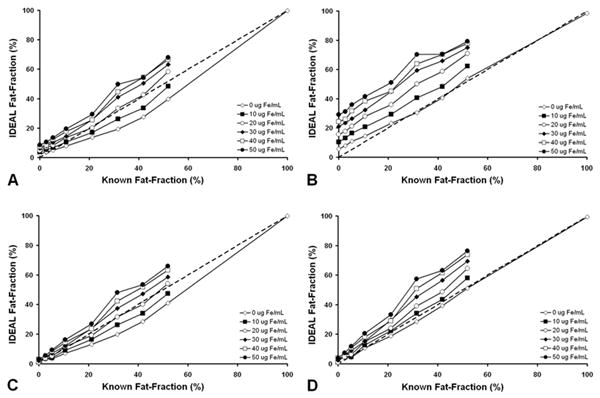
Fat-fractions measured with IDEAL (6-echoes) plotted against known fat-fractions. (A) Single-peak reconstruction without T2* correction, (B) multi-peak reconstruction without T2* correction, (C) single-peak reconstruction with T2* correction, and (D) multi-peak reconstruction with T2* correction, are shown. Dashed line represents unity. As expected, single-peak reconstruction underestimates known fat-fractions. The use of T2* correction also improves the accuracy of fat-fraction estimation, particularly at lower fat-fraction. Figures include standard error bars, but are smaller than the symbol size in the plots.
One-sided ANOVA results indicated no statistically significant differences between IDEAL fat-fractions or R2* values for 6, 9, and 16 echoes (p > 0.3 for all tests) for each of the four reconstructions. Given the equivalency of the 6, 9, and 16 echo acquisitions from the ANOVA results, only the six-echo reconstruction fat-fractions were shown above.
Figure 5A plots measured R2* values for each fat-fraction with increasing iron concentration for the reconstruction including multi-peak and T2* correction. It was observed that R2* values changed with increasing fat-fraction, suggesting that fat and water differentially influence the measured R2*. This phenomenon is supported visually by qualitative comparison of the spectroscopy data with increasing iron (Figure 5B). Although all peaks experience line broadening, the water peak appears to decay more rapidly than the fat peak at 1.3ppm with increasing iron concentration. Figure 5C alternatively displays the measured areas of the water and main fat peak with increasing iron concentration, and demonstrates a greater SPIO influence on the decay of water signal, compared to fat signal.
Figure 5.
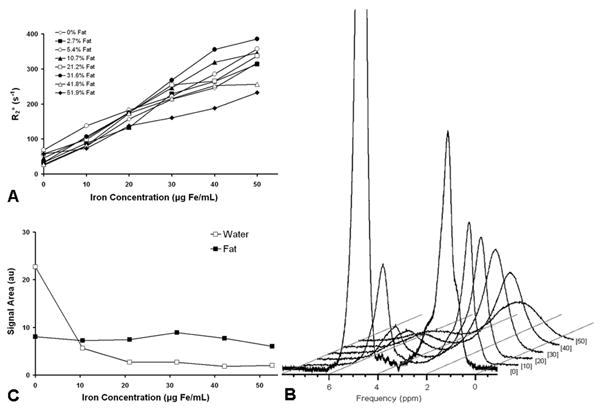
(A) Measured R2* values for six-echo reconstruction including accurate spectral modeling and T2* correction. R2* values are not constant across individual fat-fractions, even though iron concentrations remain constant. R2* values should not change with fat-fraction if T2* effects of iron oxides equally affect water and fat. Measured R2* of 100% fat is 17.20 ± 2.76 s-1. Figures include standard error bars, but are smaller than the symbol size in the plots. (B) MRS spectra of the 30% fat vials shown at increasing iron oxide concentrations. Iron oxide concentration is labeled (units of μg/mL) next to corresponding spectrum. Significant line broadening is seen with increasing iron concentration for all peaks. In addition, the amplitude of the water peak diminishes more rapidly than the fat peak. The water peak of the 0 μg Fe/mL spectra was cropped to better display the spectral effects of iron oxide. (C) Fat and water MRS signal areas (arbitrary units) for 30% fat vials plotted against the known iron oxide concentrations. The water signal decays more rapidly than the fat signal, which remains relatively constant with increasing iron oxide concentration.
DISCUSSION
In this work, we described a solid phantom consisting of a homogeneous mixture of water, fat, and SPIOs at room temperature. Using MRS, the fat content of each vial was validated. We used this phantom to investigate the ability of conventional 2-point Dixon imaging and a multi-point chemical shift based method (IDEAL) to quantify fat. The accuracy of fat quantification was improved when T2* correction and accurate spectral modeling were used. We conclude that accurate quantification of fat with MRI requires a T1 independent method that corrects for T2* decay and accounts for the multiple spectral peaks of fat.
Our results also indicated the conventional 2-point Dixon method is inadequate for fat-fraction imaging due to a natural ambiguity that only allows estimation of fat-fractions between 0 and 50%. When the ambiguity is ignored, results demonstrate excellent correlation between measured and known fat-fractions (i.e. the observed general trend is correct), however, there is very poor overall agreement in which the absolute numbers are not correct. These errors reflect that conventional 2-point Dixon imaging methods do not account for the multiple spectral peaks of fat, or correct for T2*. As a result, large, clinically relevant errors were apparent in fat-fraction estimates.
This work also investigated echo train length on fat-fraction and R2* estimates. A longer echo train will improve estimates of water, fat and T2*, until all signal has decayed and no additional information can be sampled. From an SNR perspective, the fit generally improves asymptotically as the echo train length increases. Results showed no statistically significant differences between fat-fractions and R2* values of different echo train lengths, which indicates that an echo train of six echoes is sufficient to quantify fat, as suggested by Yu et al(10), which helps reduce scan times through a shortened TR.
An assumption made in this work is that fat spectral peak amplitudes remain constant between sequences and subjects, a topic previously raised by Bydder et al(9) and Yu et al(11), and is currently under investigation. For this study, while it may be a cause of error, we felt this was a reasonable assumption due to work by Yokoo et al, which showed that there is relatively little variation in the amplitude of the multiple fat peaks in a large number of patients, and its impact on quantification of fat was very small(23).
Deviations from known fat-fractions increased with increasing iron concentration using the T2* corrected IDEAL method. These discrepancies may reflect a breakdown in the underlying assumption of the T2* correction method: the T2* of water and fat are equal. The observed different T2* decays of water and fat seen with MRS indicate that iron is preferentially affecting water more than fat in this phantom, which may explain the deviations in the measured fat-fraction with IDEAL at very high SPIO concentrations.
The hydrophobic behavior of lipid particles in an aqueous environment causes the microscopic condensation of lipid particles into globules, resulting in compartmentalization of lipid and water components. The signal-generating lipid tails are on the interior of the bilayer of the structure unexposed to water, leaving the iron exclusively in the water component because SPIOs are water soluble only. Therefore, because SPIO particles are farther from lipid tails than water, we hypothesize that SPIOs affect water molecules preferentially over lipid molecules due to geographic constraints.
It is likely that the phantom is different on a microscopic level than a diseased liver, particularly concerning the size of lipid globules and compartmentalization of iron. The microscopic fat compartmentalization is a potential limitation of this phantom because the size of the microscopic lipid globules was not controlled. Identical fat/water compartmentalization probably does not exist within hepatocytes because the observed size of the fat globules on the micrographs was much larger than the known diameter of hepatocytes, 25μm(24), and the differential T2* decay may be less in vivo because intracellular fat vacuoles are smaller than measured phantom fat globules. Thus, our phantom may represent an extreme case, although the different observed behavior of iron oxides towards water and fat suggests that signal modeling allowing for independent correction of T2* for water and fat components may be needed to accurately estimate fat fraction in the presence of high levels of iron. In any scenario, however, the distribution of lipids and iron both in the phantom and in vivo will be microscopically heterogeneous, but macroscopically homogeneous. The impact of the relative distribution of water, fat and SPIOs may ultimately result in differences on the impact of transverse magnetization relaxation.
In conclusion, accurate spectral modeling and T2* correction are necessary for precise fat quantification using MRI, as validated in a homogeneous fat-water-SPIO phantom over a range of physiologically expected fat percentages and T2* decay. Our results also suggest that differences in T2* decay exist between water and fat at higher iron concentrations. Future studies will address this challenge to provide further improvement for accurate fat quantification in the presence of high iron concentrations.
Acknowledgments
Grant Support: This project was supported in part by the UW ICTR, funded through an NIH Clinical and Translational Science Award, grant number 1UL1RR025011. SBR was supported by an RSNA Scholar Award Fellowship
References
- 1.Johnson NA, Walton DW, Sachinwalla T, et al. Noninvasive assessment of hepatic lipid composition: Advancing understanding and management of fatty liver disorders. Hepatology. 2008;47:1513–1523. doi: 10.1002/hep.22220. [DOI] [PubMed] [Google Scholar]
- 2.Cowin GJ, Jonsson JR, Bauer JD, et al. Magnetic resonance imaging and spectroscopy for monitoring liver steatosis. J Magn Reson Imaging. 2008;28:937–945. doi: 10.1002/jmri.21542. [DOI] [PubMed] [Google Scholar]
- 3.Marrero JA, Fontana RJ, Su GL, Conjeevaram HS, Emick DM, Lok AS. NAFLD may be a common underlying liver disease in patients with hepatocellular carcinoma in the United States. Hepatology. 2002;36:1349–1354. doi: 10.1053/jhep.2002.36939. [DOI] [PubMed] [Google Scholar]
- 4.Brunt EM. Nonalcoholic steatohepatitis. Semin Liver Dis. 2004;24:3–20. doi: 10.1055/s-2004-823098. [DOI] [PubMed] [Google Scholar]
- 5.Bugianesi E, Leone N, Vanni E, et al. Expanding the natural history of nonalcoholic steatohepatitis: from cryptogenic cirrhosis to hepatocellular carcinoma. Gastroenterology. 2002;123:134–140. doi: 10.1053/gast.2002.34168. [DOI] [PubMed] [Google Scholar]
- 6.Wong WF, Northrup SR, Herrick RC, Glombicki AP, Wood RP, Morrisett JD. Quantitation of lipid in biological tissue by chemical shift magnetic resonance imaging. Magn Reson Med. 1994;32:440–446. doi: 10.1002/mrm.1910320403. [DOI] [PubMed] [Google Scholar]
- 7.Szczepaniak LS, Nurenberg P, Leonard D, et al. Magnetic resonance spectroscopy to measure hepatic triglyceride content: prevalence of hepatic steatosis in the general population. Am J Physiol Endocrinol Metab. 2005;288:E462–468. doi: 10.1152/ajpendo.00064.2004. [DOI] [PubMed] [Google Scholar]
- 8.Liu CY, McKenzie CA, Yu H, Brittain JH, Reeder SB. Fat quantification with IDEAL gradient echo imaging: correction of bias from T(1) and noise. Magn Reson Med. 2007;58:354–364. doi: 10.1002/mrm.21301. [DOI] [PubMed] [Google Scholar]
- 9.Bydder M, Yokoo T, Hamilton G, et al. Relaxation effects in the quantification of fat using gradient echo imaging. Magn Reson Imaging. 2008;26:347–359. doi: 10.1016/j.mri.2007.08.012. [DOI] [PMC free article] [PubMed] [Google Scholar]
- 10.Yu H, McKenzie CA, Shimakawa A, et al. Multiecho reconstruction for simultaneous water-fat decomposition and T2* estimation. J Magn Reson Imaging. 2007;26:1153–1161. doi: 10.1002/jmri.21090. [DOI] [PubMed] [Google Scholar]
- 11.Yu H, Shimakawa A, McKenzie CA, Brodsky E, Brittain JH, Reeder SB. Multiecho water-fat separation and simultaneous R2* estimation with multifrequency fat spectrum modeling. Magn Reson Med. 2008;60:1122–1134. doi: 10.1002/mrm.21737. [DOI] [PMC free article] [PubMed] [Google Scholar]
- 12.Fishbein MH, Gardner KG, Potter CJ, Schmalbrock P, Smith MA. Introduction of fast MR imaging in the assessment of hepatic steatosis. Magn Reson Imaging. 1997;15:287–293. doi: 10.1016/s0730-725x(96)00224-x. [DOI] [PubMed] [Google Scholar]
- 13.Henkelman RM. Measurement of signal intensities in the presence of noise in MR images. Med Phys. 1985;12:232–233. doi: 10.1118/1.595711. [DOI] [PubMed] [Google Scholar]
- 14.Reeder SB, Wen Z, Yu H, et al. Multicoil Dixon chemical species separation with an iterative least-squares estimation method. Magn Reson Med. 2004;51:35–45. doi: 10.1002/mrm.10675. [DOI] [PubMed] [Google Scholar]
- 15.Reeder SB, McKenzie CA, Pineda AR, et al. Water-fat separation with IDEAL gradient-echo imaging. J Magn Reson Imaging. 2007;25:644–652. doi: 10.1002/jmri.20831. [DOI] [PubMed] [Google Scholar]
- 16.Reeder SB, Pineda AR, Wen Z, et al. Iterative decomposition of water and fat with echo asymmetry and least-squares estimation (IDEAL): application with fast spin-echo imaging. Magn Reson Med. 2005;54:636–644. doi: 10.1002/mrm.20624. [DOI] [PubMed] [Google Scholar]
- 17.Bernard CP, Liney GP, Manton DJ, Turnbull LW, Langton CM. Comparison of fat quantification methods: a phantom study at 3.0T. J Magn Reson Imaging. 2008;27:192–197. doi: 10.1002/jmri.21201. [DOI] [PubMed] [Google Scholar]
- 18.Fishbein M, Castro F, Cheruku S, et al. Hepatic MRI for fat quantitation: its relationship to fat morphology, diagnosis, and ultrasound. J Clin Gastroenterol. 2005;39:619–625. doi: 10.1097/00004836-200508000-00012. [DOI] [PubMed] [Google Scholar]
- 19.Pozzato C, Radaelli G, Dall’Asta C, et al. MRI in identifying hepatic steatosis in obese children and relation to ultrasonography and metabolic findings. J Pediatr Gastroenterol Nutr. 2008;47:493–499. doi: 10.1097/MPG.0b013e31817b6e10. [DOI] [PubMed] [Google Scholar]
- 20.Wood JC, Enriquez C, Ghugre N, et al. MRI R2 and R2* mapping accurately estimates hepatic iron concentration in transfusion-dependent thalassemia and sickle cell disease patients. Blood. 2005;106:1460–1465. doi: 10.1182/blood-2004-10-3982. [DOI] [PMC free article] [PubMed] [Google Scholar]
- 21.Ozcan M, Seven S. Physical and chemical analysis and fatty acid composition of peanut, peanut oil, and peanut butter from COM and NC-7 cultivars. Grasas y Aceites. 2003;54:12–18. [Google Scholar]
- 22.Dixon WT. Simple proton spectroscopic imaging. Radiology. 1984;153:189–194. doi: 10.1148/radiology.153.1.6089263. [DOI] [PubMed] [Google Scholar]
- 23.Yokoo T, Bydder M, Hamilton G, et al. Effect of fat spectral model parameters on hepatic fat quantification by multi-echo gradient magnetic resonance imaging. Proceedings of the 17th Annual Meeting of ISMRM, Honolulu. 2009 abstract 2134. [Google Scholar]
- 24.Suriawinata AA, Thung SN. Liver. In: Mills S, editor. Histology for pathologists. 3. Vol. 2006. Philadelphia: Lippincott, Williams and Wilkins; pp. 685–703. [Google Scholar]