

Abstract
Background
Vitamin D may have a protective role in the etiology of multiple sclerosis (MS), but the effect of gestational vitamin D on adult onset MS has not been studied.
Methods
In 2001, 35,794 mothers of participants of the Nurses’ Health Study II completed a questionnaire inquiring about their experiences and diet during pregnancy with their nurse-daughter. We studied the association of maternal milk intake, maternal dietary vitamin D intake, and predicted maternal serum 25-hydroxyvitamin D (25(OH)D) during pregnancy and their daughters’ risk of developing MS.
Results
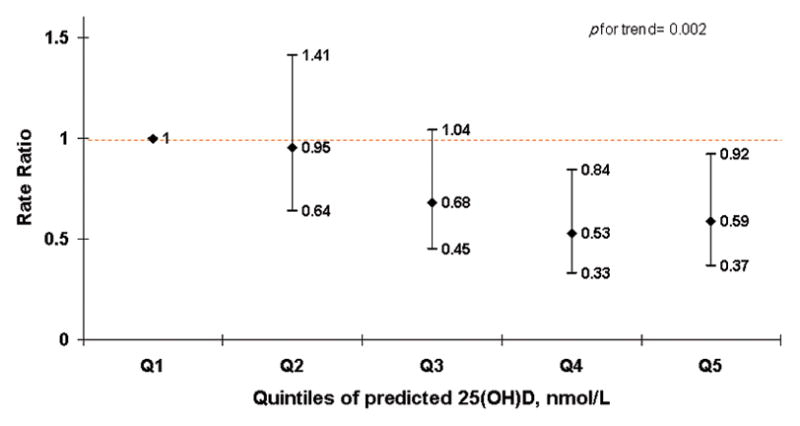
MS was diagnosed in 199 women. The relative risk (RR) of MS was lower among women born to mothers with high milk or vitamin D intake during pregnancy. The multivariate adjusted RR of MS was 0.62 (95% CI: 0.40– 0.95; p trend=0.001) for nurses whose mothers consumed 2–3 glasses of milk per day compared with those whose mothers consumed fewer than 3 glasses per month, and 0.57 (95% CI: 0.35–0.91; p trend=0.002) for nurses with mothers in the highest quintile of dietary vitamin D intake compared with those in the lowest. The predicted 25(OH) vitamin D level in the pregnant mothers was also inversely associated with the risk of MS in their daughters. Comparing extreme quintiles the adjusted RR was 0.59; (95% CI: 0.37–0.92; p trend =0.002).
Conclusion
Higher maternal milk and vitamin D intake during pregnancy may be associated with a lower risk of developing MS in the offspring.
Keywords: Multiple sclerosis, Epidemiology, prenatal, vitamin D
Introduction
Multiple sclerosis (MS) is a complex autoimmune disease, probably caused by a combination of genetic and environmental factors. 1 Results of epidemiologic studies, including studies of childhood sunlight exposure and diet 2, 3, dietary vitamin D intake 4, and serum levels of 25-OH vitamin D 5, support a protective role of vitamin D in MS etiology.
The higher concordance rate of MS among dizygotic twins, who share the same intrauterine environment and time of birth, compared to non-twin siblings suggests a gestational susceptibility for MS. 6 Further, in studies on time of birth, MS patients were more likely to be born in spring, predominantly the month of May in the Northern hemisphere,7 with symmetrical results in Australia, where the highest MS risk was among individuals born in November-December,8 possibly due to longer durations of their in utero vitamin D insufficiency during the preceding winter. Although the effect of gestational vitamin D on adult onset MS has not been studied, some epidemiologic studies have assessed early life effects of dietary vitamin D on other autoimmune diseases like type 1 diabetes; the results are inconsistent.9, 10, 11
In this longitudinal study we examined the association between in-utero vitamin D exposure as measured by maternal milk intake, maternal dietary vitamin D intake, and predicted maternal serum 25(OH)D during pregnancy and their daughters’ risk of developing MS later in adulthood among 35,372 nurses whose mothers’ participated in the Nurses’ Mothers’ Study.
Methods
Study Population
The Nurses’ Health Study (NHS) is a prospective cohort of 121,701 female registered nurses, aged 30 to 55 at study onset in 1976. The Nurses’ Health Study II (NHS II), another cohort of 116,430 female registered nurses began in 1989 with women aged 25 to 42 at that time. These nurses completed questionnaires at baseline and at biennial follow-up providing information on demographic, lifestyle and health-related factors, and newly diagnosed diseases, including MS. The Nurses’ Mothers’ Study 12 began in 2001, when the NHS and NHS II participants, free of cancer, were requested permission to send questionnaires to their mothers regarding their daughters’ early life exposures. They were restricted to nurses with living, biological mothers, free of debilitating diseases (N=52,540). The questionnaire inquired about the mothers’ experiences during pregnancy with their nurse-daughter and their nurse-daughter’s early life exposures. Of the 39,904 (76%) mothers returning questionnaires, the current analyses only includes mothers’ of NHS II members (N=35,794), as they comprised 90% of the cohort. NHS II and the Nurses’ Mothers’ Study were linked, providing data on the nurses’ entire lifespan from conception to adulthood, with repeatedly assessed information on adult life variables. This study was approved by the institutional review board of Brigham and Women’s Hospital and the National Cancer Institute.
Outcome assessment
Cases were defined as physician-confirmed MS, as previously described.4, 13 In summary, cases identified by self-report on the biennial questionnaires, who provided permission to contact their treating neurologist/internist and to review medical records, were confirmed if the diagnosis was considered definite or probable by the treating neurologist/internist, or by our study neurologist (T.C.) reviewing the medical records. In NHS II, the diagnostic confirmation was extended to cases with disease onset before study enrollment in 1989. These cases were considered prevalent MS cases as opposed to incident cases with disease onset after 1989.
Exposure assessment
The Nurses’ Mothers’ questionnaire in 2001 asked about diet during pregnancy using a semi-quantitative food frequency questionnaire. Mothers reported the frequency of intake of typical serving-sizes of 24 food items during their entire pregnancy. Maternal exposure was assessed in three different ways -- milk intake, dietary vitamin D, and predicted serum 25(OH)D.
Maternal milk intake during pregnancy
In this cohort the main contributor to vitamin D intake from food during pregnancy was fortified milk. Each mother reported their average milk intake by choosing from 7 categories ranging from “never” to “4 or more glasses/day. The “never” and “1–3 glasses/month” categories of milk were collapsed into one category of “ ≤3 glasses/month” due to small sample size. Nurses were then categorized into one of six categories of maternal milk intake.
Maternal vitamin D intake from food
The main food items contributing to dietary vitamin D intake were milk, fish, margarine, and eggs. We estimated vitamin D intake from food during pregnancy for each mother by summing up the vitamin D contribution of each of the vitamin D containing foods. Intake was calculated by multiplying the amount of vitamin D in a serving size of those food items by the frequency of consumption. Vitamin D contents of food pertaining to the relevant time period (1945–1965, were derived. 14,15,16–18. While mothers reported intake of prenatal vitamins during pregnancy, details about type of vitamins, and duration or frequency of intake were not available. Thus, we could only assess vitamin D intake from supplements as yes/no/missing, assuming that all prenatal vitamins contained vitamin D.19 The validity of maternal diet data recalled from the distant past has not been assessed. Here we have asked mothers to recall data from about 35 to 55 years (average 45 years) prior to completing the questionnaires. When people have recalled diets 11–25 years in the past, average correlations have ranged between 0.28 to 0.38.20,21 The correlations with historical intake were even lower for recalls of 20–44 years in the past with only some foods such as dairy showing higher correlations (r=0.55).22
Predicted serum 25-hydroxyvitamin D
Because serum 25(OH)D measurements are not available for the Nurses’ Mothers’, we developed a prediction model, using the mother’s characteristics including factors known to influence circulating 25(OH)D concentrations, as predictors of serum 25(OH)D.23,24 We used measured serum 25(OH)D levels from 1,240 nurses who served as controls in three case-control studies nested within the NHS cohort, and were not part of our analyses.24 In a linear regression model, with measured serum 25(OH)D as the dependent variable and race, vitamin D from food, vitamin D from supplements, UV-B flux, age, BMI, season of blood draw, lab-batch, physical activity, alcohol intake, and hormone use as independent predictors of serum 25(OH)D, we obtained beta-coefficients for each variable. (Table 1) Predicted 25(OH)D “scores” were then estimated for each mother in our cohort using regression coefficients obtained in the NHS sample for race, vitamin D from food, vitamin D from supplements, UV-B flux (based on geographic residence at time of daughter’s birth), mothers’ age and mothers’ pre-pregnancy BMI. This “predicted” maternal serum 25(OH) D, which was used as an approximation of in utero 25(OH)D exposure for NHS II participants, takes into account the combined influence of all of the major determinants of vitamin D status as opposed to just maternal vitamin D intake. The recreational activity question in the mother’s questionnaire asked about distance walked/day as opposed to the physical activity variables in the NHS which were measured as hours/week, making them slightly different. So for the main analysis physical activity was not included in the predicted 25(OH)D score calculations.
Table 1.
Factors contributing to serum 25 (OH) D in a prediction model
| Factor | Change in 25(OH)D, ng/ml |
|---|---|
| Intercept | 25.4 |
| Race | |
| White | 0 (referent) |
| Black | −11.16 |
| Dietary vitamin D | |
| < 100IU/day | 0 (referent) |
| 100–199 IU/day* | 0.47 |
| 200–299 IU/day | 1.98 |
| 300–399 IU/day | 3.36 |
| ≥ 400 IU/day | 3.87 |
| Vitamin D from supplements | |
| No | 0 (referent) |
| Yes | 2.92 |
| Season of blood draw | |
| Fall (Sept., Oct., Nov.) | 0 (referent) |
| Winter (Dec, Jan., Feb.) | −3.63 |
| Spring (March, Apr., May) | −2.79 |
| Summer (June, July, Aug.)* | 1.03 |
| UV-B flux | |
| >113 | 0 (referent) |
| 113 | −2.83 |
| <113* | −1.22 |
| Physical activity | |
| Quintile5 | 0 (referent) |
| Quintile4* | 1.51 |
| Quintile3 | −2.94 |
| Quintile2* | −1.5 |
| Quintile1 | −3.58 |
| Alcohol intake | 0.12 |
| Hormone use | |
| pre-men/ missing men | 0 (referent) |
| never/past PMH user* | −0.27 |
| current PMH user | 2 |
| Age* | 0.10 |
| Body mass index | |
| <21kg/m2 | 0 (referent) |
| 21–23, kg/m2* | 3.01 |
| 23–24.9 kg/m2* | 0.61 |
| 25–28.9 kg/m2 | −0.59 |
| >29 kg/m2 | −3.11 |
Plasma 25(OH)D prediction model developed among 1240 NHS participants who served as controls in previous nested case-control studies of breast cancer, colon polyps, and colon cancer.
Not statistically significant
PMH: Post Menopausal Hormone
R2= 0.32
Assessment of covariates
Using the NHS II biennial questionnaires, the following risk factors for MS were included as covariates in the multivariate analyses: latitude at birth, ancestry, and pack-years of cigarette smoking. Using state of birth, reported in 1993 we categorized participants latitude at birth into northern, middle and southern tiers as previously described.25 Ancestry was reported in 1989 and women were categorized as Southern-European/Mediterranean, Scandinavian, other Caucasian, and other as previously described.25 Detailed information on smoking was reported at baseline in 1989 and was updated every two years. Pack-years of cigarette smoking was derived from this information and categorized into never, 1–9, 10–24, and ≥25.13 Using current height, and weight at age 18 reported in 1989, we calculated nurses’ BMI at age 18 using the World Health Organization’s BMI categories (<18.5,18.5–25, 25.0–30, and ≥ 30 kg/m2 ). We used food data from the 1991 questionnaire, to categorize nurses by quintiles of total energy-adjusted vitamin D intake.
Additional covariates using the Nurses’ Mothers’ Questionnaire included mothers’ smoking during pregnancy, maternal and paternal education level, paternal occupation (proxies for early life socioeconomic-status), mothers’ pre-pregnancy BMI, the daughter’s preschool intake of cod-liver oil or multivitamins, and mothers’ recreational physical activity (a proxy for sun-exposure) during pregnancy (in five categories ranging from highly active to inactive).
Statistical analysis
Incident (diagnosed after 1989) and prevalent MS cases (diagnosed before 1989) were included in the study. Follow up for the incident analyses started in 1989 and women contributed person time from the return date of the baseline questionnaire (1989) to the date of diagnosis of MS, death, or end of follow-up (June, 2005), whichever came first. In the prevalent analyses person-time was calculated from age 19 to the time of cohort recruitment (1989) or the date of MS diagnosis, whichever came first. For each analysis, person-time was analyzed in two-year follow-up intervals, and for person-time accrued after cohort recruitment these intervals corresponded to the time period between questionnaire dates.
We used Cox proportional hazards models, stratified by age in months and calendar year to compute hazard ratios to estimate the rate ratios (RR) and 95% confidence intervals for the age adjusted effect of maternal milk intake, quintiles of maternal vitamin D intake from food, and quintiles of predicted serum 25(OH)D on MS. Vitamin D from food and predicted serum 25(OH)D were also assessed as continuous variables in increments of 400IU/day and 10nmol/L respectively. In our multivariable analysis we adjusted for latitude at birth, ethnicity and pack years of smoking which are known MS risk factors. Smoking, the only time varying covariate, was also updated in the prevalent analyses for consistency. Tests for linear trend were conducted by using the median values of categories of milk, quintiles of maternal dietary vitamin D, and quintiles of predicted serum vitamin D. We used the missing indicator method when controlling for covariates with missing data and excluded those missing in the primary exposures.26 Analyses were conducted separately in the incident and prevalent cases and rate ratio estimates were pooled using inverse-variance weighting, and a Q test for heterogeneity was conducted.27 The Nurses’ Mothers’ Questionnaire was completed in 2001, when more than 80% (n=118) of the incident MS cases had already occurred. There were too few cases (n=29) to conduct a fully prospective analysis; therefore, our analyses were primarily retrospective. Analyses were conducted using SAS version 9. A p value <0.05 was considered statistically significant.
Results
We had 147 incident cases (diagnosed after 1989) and 52 prevalent cases (diagnosed before cohort recruitment) available for analysis. The relation between maternal milk intake and potential risk factors for MS is shown in Table 2. One notable observation is that compared to mothers with low milk intake, those who had higher milk intake were also more highly educated and physically active during pregnancy, and more likely to breast feed. (Table 2).
Table 2.
Baseline age-adjusted characteristics of participants in NHS II according to servings of maternal milk intake*
| NHS II
|
||||||
|---|---|---|---|---|---|---|
| Mothers’ milk intake (glasses) † | ||||||
| Characteristics | ≤3/mo | 1–4/wk | 5–6/wk | 1/day | 2–3/day | 4+/day |
| Number of nurses (%) | 5243 (14.8) | 4361 (12.3) | 22001 (5.7) | 9748 (27.6) | 12716 (36.0) | 1303 (3.7) |
|
| ||||||
| Nurses’ characteristics | ||||||
| Nurses age in ’89, mean | 34.4 | 34.0 | 34.1 | 34.3 | 34.2 | 34.0 |
| Ever Smoker in ’89, % | 32.4 | 32.2 | 32.6 | 31.7 | 31.3 | 29.4 |
| Smoking status ’89, % | ||||||
| Never | 67.5 | 67.7 | 67.3 | 68.2 | 68.6 | 70.5 |
| Past | 20.1 | 21.3 | 21.6 | 20.8 | 21.4 | 19.8 |
| Current | 12.3 | 10.8 | 10.9 | 10.9 | 9.9 | 9.5 |
| Tier of birth, % | ||||||
| North | 28.2 | 30.2 | 29.3 | 30.8 | 34.7 | 40.4 |
| Middle | 49.3 | 47.7 | 48.1 | 46.9 | 45.2 | 39.9 |
| South | 12.0 | 13.0 | 14.3 | 13.2 | 11.3 | 10.3 |
| Ethnicity, % | ||||||
| Southern European | 16.0 | 15.4 | 13.9 | 13.6 | 11.4 | 11.5 |
| Scandinavian | 3.4 | 3.8 | 4.0 | 4.6 | 5.7 | 5.9 |
| Other Caucasian | 72.6 | 73.7 | 76.9 | 75.7 | 77.4 | 76.8 |
| Other | 8.0 | 7.2 | 5.1 | 6.1 | 5.5 | 5.8 |
| Nurses’ baseline diet, mean | ||||||
| Whole milk, servings/d | 0.06 | 0.07 | 0.06 | 0.07 | 0.07 | 0.09 |
| Skim milk, servings/d | 0.87 | 0.97 | 1.00 | 1.02 | 1.24 | 1.37 |
| Total milk, servings/d | 0.93 | 1.04 | 1.06 | 1.09 | 1.31 | 1.46 |
| Total Vitamin D, IU | 371.0 | 381.1 | 390.9 | 390.7 | 414.6 | 428.8 |
| Vitamin D w/o supp., IU | 236.6 | 247.2 | 248.9 | 253.8 | 271.9 | 284.8 |
| Preschool vitamin intake, % | 62.9 | 66.2 | 69.6 | 68.1 | 71.0 | 73.1 |
| Preschool codliver oil intake, % | 12.0 | 10.9 | 10.4 | 12.1 | 11.6 | 15.0 |
| Mother’s characteristics | ||||||
| Mother’s age at birth, mean | 26.2 | 26.2 | 26.1 | 26.5 | 26.3 | 26.2 |
| Prenatal vitamin users, % | 61.2 | 66.7 | 69.9 | 68.3 | 73.5 | 74.5 |
| Smoke during pregnancy,% | 29.4 | 28.8 | 27.6 | 25.2 | 24.7 | 22.0 |
| Alcohol use (pregnancy),% | 30.0 | 34.0 | 34.1 | 31.2 | 31.7 | 24.5 |
| Breast Feeding, % | 37.4 | 41.6 | 43.1 | 45.0 | 50.6 | 55.9 |
| Own Home | 52.9 | 52.8 | 53.2 | 51.3 | 51.6 | 51.4 |
| Mothers’ BMI, mean | 21.3 | 21.4 | 21.3 | 21.4 | 21.14 | 21.01 |
| Mother’s leisure physical activity, % | ||||||
| Highly active | 9.9 | 8.0 | 8.5 | 9.0 | 10.8 | 18.3 |
| Somewhat active | 17.5 | 19.1 | 20.4 | 18.8 | 21.6 | 22.5 |
| Active | 35.6 | 38.9 | 40.6 | 41.9 | 40.4 | 36.5 |
| Mostly inactive | 21.6 | 22.3 | 21.8 | 20.6 | 18.5 | 15.2 |
| Inactive | 14.9 | 11.5 | 8.3 | 9.2 | 8.3 | 7.1 |
| Mother’s education, % | ||||||
| Less than high school | 19 | 15 | 12 | 13 | 11 | 12 |
| High School | 53 | 52 | 51 | 51 | 47 | 44 |
| College | 28 | 32 | 37 | 35 | 42 | 44 |
| Father’s education, % | ||||||
| Less than high school | 21.7 | 19.5 | 19.5 | 17.8 | 15.2 | 16.3 |
| High School | 39.7 | 37.3 | 36.3 | 37.6 | 35.4 | 31.6 |
| College | 33.4 | 38.4 | 40.7 | 40.4 | 45.7 | 48.3 |
| Father high paying job, % | 22.7 | 25.6 | 27.6 | 28.0 | 31.2 | 33.3 |
Each category is directly standardized to the baseline age distribution of the cohort
In the Nurses Mother’s Study, 421 women were missing “mothers’ milk intake”
Maternal milk intake during pregnancy was inversely associated with their daughter’s risk of MS. The risk of MS among the nurse-daughters was 38% lower if their mothers consumed 2–3 glasses of milk per day compared to mothers who consumed 3 or fewer glasses of milk per month. The pooled multivariate adjusted RR was 0.62 (95%CI=0.40–0.95); p trend=0.001. (Table 3)
Table 3.
RRs and 95% CIs of MS by maternal dietary factors during pregnancy in NHS II
| Maternal Milk Intake** |
||||||||
|---|---|---|---|---|---|---|---|---|
| < 3/mo | 1–4/wk | 5–6/wk | 1/day | 2–3/day | 4+/day | P trend | P heterogeneity‡‡ | |
| Median, glasses | 3/mo | 2.5/wk | 5.5/wk | 1/day | 2.5/day | 4/day | ||
| cases§§ | 28 | 26 | 10 | 37 | 41 | 3 | ||
| person-year | 81,521 | 67,800 | 31,114 | 151,604 | 197,994 | 20,305 | ||
| Incident cases (n=147) | ||||||||
| Age adjusted* | Ref | 1.13 (0.66–1.94) | 0.97 (0.47–2.00) | 0.70 (0.43–1.15) | 0.60 (0.37–0.97) | 0.47 (0.13–1.44) | 0.0067 | |
| Multivariate 1† | Ref | 1.14 (0.67–1.95) | 0.98 (0.48–2.04) | 0.71 (0.43–1.17) | 0.61 (0.38–1.00) | 0.48 (0.15–1.60) | 0.0094 | |
| Multivariate 2‡ | Ref | 1.12(0.66–1.92) | 0.99(0.48–2.04) | 0.71(0.43–1.16) | 0.62(0.38–1.02) | 0.51(0.15–1.68) | 0.015 | |
| Multivariate 3§ | Ref | 1.16(0.67–1.99) | 1.04(0.50–2.17) | 0.73(0.44–1.20) | 0.66(0.40–1.09) | 0.54(0.16–1.80) | 0.028 | |
| Prevalent cases (n=52) | ||||||||
| Age adjusted* | Ref | 1.7(0.69–4.23) | 1.0(0.27–3.78) | 1.02(0.43–2.39) | 0.63(0.26–1.53) | 0.52(0.06–4.12) | 0.047 | |
| Multivariate 1† | Ref | 1.74(0.70–4.31) | 1.03(0.27–3.88) | 1.05(0.44–2.47) | 0.65(0.26–1.59) | 0.54(0.07–4.33) | 0.056 | |
| Multivariate 2‡ | Ref | 1.81(0.73–4.50) | 1.09(0.29–4.1) | 1.08(0.46–2.55) | 0.68(0.28–1.67) | 0.56(0.07–4.52) | 0.067 | |
| Multivariate 3§ | Ref | 1.83(0.73–4.58) | 1.02(0.27–3.87) | 1.04(0.44–2.47) | 0.61(0.24–2.01) | 0.47(0.06–3.84) | 0.032 | |
| Pooled cases (n=199) | ||||||||
| Age adjusted* | Ref | 1.26 (0.79–2.00) | 0.98 (0.52–1.84) | 0.77 (0.50–1.18) | 0.60 (0.39–0.92) | 0.48 (0.17–1.35) | 0.001 | 0.75 |
| Multivariate 1† | Ref | 1.27 (0.80–2.02) | 0.99 (0.53–1.88) | 0.78 (0.51–1.20) | 0.62 (0.40–0.95) | 0.50 (0.18–1.40) | 0.001 | 0.73 |
| Multivariate 2‡ | Ref | 1.27(0.80–2.02) | 1.01(0.53–1.91) | 0.79 (0.51–1.21) | 0.64 (0.41–0.98) | 0.52 (0.18–1.47) | 0.002 | 0.73 |
| Multivariate 3§ | Ref | 1.30(0.82–2.08) | 1.04(0.55–1.97) | 0.80(0.52–1.23) | 0.65(0.42–1.00) | 0.52 (0.18–1.48) | 0.003 | 0.45 |
| Maternal Vitamin D from food||, †† |
||||||||
|---|---|---|---|---|---|---|---|---|
| Continuous¶ | Quintile 1 | Quintile 2 | Quintile 3 | Quintile 4 | Quintile 5 | P trend | Pheterogeneity§§ | |
| Median, IU/d (range) | 187.5 (0–757) | 65.5 | 132.6 | 187.5 | 294 | 350.3 | ||
| cases§§ | 147 | 37 | 35 | 30 | 22 | 22 | ||
| person-year | 442,616 | 110,569 | 110,550 | 110,613 | 110,716 | 110,737 | ||
| Incident cases n=147 | ||||||||
| Age adjusted* | 0.45 (0.25–0.82) | Ref | 0.98 (0.62–1.56) | 0.81 (0.50–1.31) | 0.59 (0.35–1.01) | 0.61 ( 0.36–1.03) | 0.012 | |
| Multivariate 1† | 0.46 (0.25–0.85) | Ref | 0.99 (0.62–1.57) | 0.82 (0.51–1.34) | 0.61 (0.36–1.04) | 0.62 (0.37–1.06) | 0.017 | |
| Multivariate 2‡ | 0.49(0.26–0.89) | Ref | 0.99 (0.62–1.57) | 0.83 (0.51–1.34) | 0.62 (0.36–1.06) | 0.64 (0.38–1.10) | 0.026 | |
| Multivariate 3§ | 0.51(0.27–0.95) | Ref | 1.01 (0.63–1.62) | 0.85 (0.52–1.38) | 0.65 (0.38–1.12) | 0.67 (0.39–1.16) | 0.04 | |
| Prevalent cases (n=52) | ||||||||
| Age adjusted* | 0.30 (0.11–0.84) | Ref | 1.16(0.55–2.44) | 0.77(0.34–1.76) | 0.70(0.30–1.63) | 0.39(.14–1.08) | 0.036 | |
| Multivariate 1† | 0.30 (0.11–0.86) | Ref | 1.16(0.55–2.44) | 0.78 (0.34–1.78) | 0.71 (0.30–1.66) | 0.390( 0.14– 1.11) | 0.041 | |
| Multivariate 2‡ | 0.33 (0.12–0.96) | Ref | 1.18(0.56–2.49) | 0.81(0.35–1.84) | 0.74(0.31–1.73) | 0.41(0.15–1.16) | 0.055 | |
| Multivariate 3§ | 0.27(0.09–0.77) | Ref | 1.15(0.54–2.42) | 0.75(0.33–1.73) | 0.66(0.28–1.56) | 0.36(0.12–1.02) | 0.025 | |
| Pooled cases (n=199) | ||||||||
| Age adjusted* | 0.41 (0.24–0.68) | Ref | 1.03 (0.69–1.52) | 0.80 (0.53–1.21) | 0.62 (0.32–0.97) | 0.55 (0.35–0.89) | 0.002 | 0.57 |
| Multivariate 1† | 0.42 (0.25–0.70) | Ref | 1.03 (0.70–1.53) | 0.81 (0.53–1.23) | 0.63 (0.40–1.00) | 0.57 (0.35–0.91) | 0.002 | 0.57 |
| Multivariate 2‡ | 0.44(0.26–0.74) | Ref | 1.04(0.70–1.54) | 0.82(0.54–1.25) | 0.65(0.41–1.03) | 0.59(0.36–0.94) | 0.001 | 0.51 |
| Multivariate 3§ | 0.43(0.24–0.75) | Ref | 1.05(0.71–1.56) | 0.82(0.54–1.25) | 0.65(0.41–1.03) | 0.58(0.34–0.98) | 0.003 | 0.57 |
Adjusted for nurses’ age (in months) and time interval
Multivariate 1=Adjusted for nurses’ age (in months), latitude of birth (north, middle, south), ethnicity (S. European, Scandinavian, other Caucasian, other), smoking (never smoker, 1–9, 10–24, and >25 pack-years)
Multivariate 2= Multivariate 1 + adjusted for nurses’ baseline vitamin D intake in quintiles and nurses’ BMI at age 18 (using the World Health Organization’s BMI categories (<18.5,18.5–25, 25.0–30, and ≥ 30)
Multivariate 3= Multivariate 2 + adjusted for mother’s education, father’s profession, mother’s exercise, mother breast feeding and mother’s smoking
Maternal vitamin D from food includes: milk, fish, margarine, eggs, white bread and rice, processed meats, butter, bakery products and other dairy foods (cheese, yogurt, and ice cream). It was calculated by multiplying the amount of vitamin D in a serving size of these food items by the frequency of consumption
RRs are for 400 IU increments of dietary vitamin D intake as a continuous variable
In the Nurses Mother’s Study, 421 women were missing maternal milk intake
In the Nurses Mother’s Study, 238 women were missing maternal vitamin D from food
The test of heterogeneity is comparing the heterogeneity of the incident and prevalent effect estimates for the p for trends
The mean age of onset of MS in this population is 36 years, ranging between 16–52 years.
The mother’s vitamin D intake from food during pregnancy was also inversely associated with the risk of MS in their daughters – with a greater than 40% lower risk when comparing the highest with the lowest quintile of vitamin D consumption. (Table 3) As a continuous variable, maternal vitamin D intake from food was associated with a 58% reduced risk of MS for each 400IU/day increment. (Table 3)
Similarly, predicted 25(OH)D levels in the pregnant mothers was inversely associated with the risk of MS in their daughters (Figure 1A). Using predicted 25(OH)D as continuous, the pooled adjusted RR was 0.69 (95%CI= 0.56–0.86) for a 10nmol/L increment.
Figure 1.
None of these multivariate adjusted RRs, adjusted for the nurse-daughters’ pack-years of smoking, latitude of birth, and ethnicity, were materially different from the age adjusted results. Additionally adjusting for nurses’ baseline vitamin D intake and their BMI at age 18 as well as mother’s education, father’s profession, mother’s exercise, mother’s breast feeding and mother’s smoking did not materially change our results. (Table 3) Maternal intake of prenatal vitamins was not associated with the risk of MS in this analysis. Maternal recreational activity was inversely associated with the risk of MS when comparing the most active to the inactive group. The multivariate adjusted RR was 0.44 (95%CI=0.25–0.75); p trend=0.003.
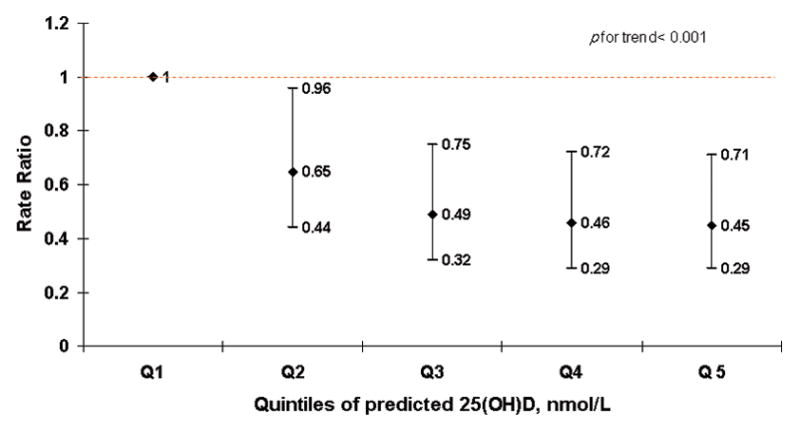
In a sensitivity analysis where we included mothers’ recreational activity in the predicted 25(OH)D calculations, the significant inverse association with MS risk became stronger (p trend <0.001) (Figure 1B).
After further adjusting for nurses own adult vitamin D intake, which was associated with lower risk of MS in previous analyses4, the inverse association between maternal vitamin D from food and daughter’s MS was only slightly attenuated (multivariate RR for extreme quintiles=0.64, 95%CI=0.37–1.09; p trend=0.024). Knowing that blacks have a lower risk of MS than whites, because of genetic factors28, and lower 25(OH)D levels, mostly because of darker skin pigmentation29, restricting to white nurses did not change the results. The associations from our main analysis persisted in additional sensitivity analyses where we adjusted for other potential covariates such as mothers’ prenatal vitamin intake, mothers’ pre-pregnancy BMI, the nurses’ preschool intake of cod-liver oil or multivitamins. The observed associations between MS and maternal vitamin D from food and maternal predicted serum 25(OH)D were attenuated and no longer significant after controlling for maternal milk intake (p trends=0.83 and p trend=0.2, respectively). However, when the maternal predicted 25(OH)D score including mothers’ recreational activity was adjusted for maternal milk intake, the results did not change and remained significant with p trend <0.002.
Discussion
In this large cohort study, with more than 35,000 mothers and 199 MS cases, we observed a 38% lower risk of MS in women whose mothers drank 2–3 glasses of milk daily during pregnancy as compared to those whose mothers drank very little or no milk. We also observed that daughters of mothers with higher dietary vitamin D intake during pregnancy and higher predicted serum 25(OH)D levels had a lower risk of MS than those whose mothers were in the lowest quintiles.
Milk is an important dietary source of vitamin D in the United States since the 1930s when vitamin D fortification (400IU/quart) was introduced in all varieties of milk, including low fat milk. 30 Although the association of maternal dietary milk and MS has not been studied before, a number of studies have considered maternal milk consumption in association with other autoimmune diseases and found no association with type 1 diabetes and an inverse association with asthma. 31, 32
The biological mechanism explaining how maternal milk intake could reduce MS risk in the offspring is not known. One hypothesis is that the high vitamin D content in milk mediated this effect -- nurses in this study had all been born between 1945and 1965, a period when milk was being fortified with vitamin D. However, an effect of other nutrients and biological compounds in milk cannot be excluded.
In the NHS and NHS II, earlier studies did not find evidence for a protective role for adulthood milk intake and risk of MS.33 Of interest, milk intake has been considered a risk factor for MS in a number of studies 34, 35. This association has been attributed to molecular mimicry between myelin oligodendrocyteglycoprotein (MOG) and butyrophylin, a bovine milk protein.36 Nonetheless, no data support the occurrence of this cross reaction between maternal ingestion of cow’s milk and fetal MOG.
The protective role of vitamin D during adult life and MS risk is supported by studies of dietary vitamin D intake 4 and serum 25(OH)D 5. Studies suggesting a season of birth effect 7,8 and a direct association of maternal pre-pregnancy BMI with MS 37 indirectly support a potential role for in-utero vitamin D insufficiency in the pathogenesis of MS. However, no previous studies have directly examined whether in-utero vitamin D influences the pathogenesis of MS. Human studies have shown that the fetus depends entirely on the mother for its supply of 25(OH)D.38 If a mother has low vitamin D levels, the fetus will have low vitamin D exposure during its developmental period. 39 Many studies have shown that vitamin D levels in the US population are low, particularly in women of childbearing age.40 As an immunomodulator, vitamin D may enhance regulatory T cell function which may be one mechanism through which higher maternal vitamin D levels could be protective for MS in their offspring.
Alternatively in-utero vitamin D deficiency may alter brain development through changes in gene regulation leading to long-lasting changes in structure and function of the adult brain as seen in animal studies of maternal vitamin D deprivation.41,42, 43. However, the relevance of these observations for MS etiology is uncertain.
While the strengths of our study include access to a unique data set with more than 35,000 reports on pregnancy diet for mothers of adult women participating in a large cohort study, thorough case ascertainment, confirmation of self-reported diagnosis, and comprehensive data on other established risk factors for MS, there are also several limitations to consider. Most mothers in this cohort reported their diet during pregnancy after their daughters had been diagnosed with MS, thus recall bias cannot be excluded. The chance of a differential recall of the intake of milk or other vitamin D containing foods however appears, to be very low as the potential link between maternal consumption of milk and other dietary components during pregnancy and MS risk in the offspring were not widely known at that time. Comparing nurses whose mothers’ drank 1 or more glasses per day to those whose mother’s drank less than 1 glass per day, we observed a similar risk of MS in the prospective cases (n=29, RR: 0.69, 95%CI: 0.33–1.45) and the retrospective cases (n=123, RR:0.62, 95%CI: 0.44– 0.86).
Exposure misclassification is likely, as we are asking the mothers to recall dietary intakes for pregnancies that occurred on average 45 years prior to enrollment; however, for milk intake as a continuous variable, this misclassification is likely to be non-differential with respect to MS risk in the daughters, and would tend to attenuate any association between diet and MS risk, although the possibility of differential misclassification cannot be ruled out. As we did not have direct serum measurements, we used a predictive model to estimate the serum 25(OH)D levels in these mothers which may not be a good approximation of the actual serum levels which is mostly derived from sunlight exposure. Additionally the measured serum vitamin D values were obtained from a group of non-pregnant nurses, and applied to calculating predicted serum levels for pregnant women, not accounting for possible physiological differences. Finally, we cannot completely exclude unknown or residual confounding as an explanation of these results. It is also possible that these findings may be due to chance. Further studies are needed to replicate these findings.
In summary, our results suggest that high intake of maternal milk during pregnancy and increasing exposure to vitamin D during intrauterine life may reduce the risk of MS in the offspring. If this inverse association reflected a true protective effect of milk, 33% of the MS cases among mothers who drank less than 2 glasses of milk per day could have been hypothetically prevented by increasing milk intake to more than 2 glasses per day. Because of the numerous limitations, these results should be interpreted cautiously and should be confirmed in other populations. On the other hand, even a modest beneficial effect of vitamin D could translate into important interventions because vitamin D supplementation in pregnancy could be safely increased above the levels currently recommended.
Acknowledgments
Study Funding: NIH grants NS047467, T32NS048005, and CA50385
The authors thank the participants in the Nurses’ Health Study II and their mothers for their continuing cooperation. This work was supported by grants NS047467, T32NS048005 and CA50385 from the National Institutes of Health. The authors have no financial conflicts of interest to disclose.
Footnotes
Statistical analyses were performed by Fariba Mirzaei M.D., ScD.
Contributor Information
Fariba Mirzaei, Email: fmirzaei@hsph.harvard.edu.
Karin B. Michels, Email: kmichels@rics.bwh.harvard.edu.
Kassandra Munger, Email: kgorham@hsph.harvard.edu.
Eilis O’Reilly, Email: poeor@channing.harvard.edu.
Tanuja Chitnis, Email: tchitnis@partners.org.
Michele R. Forman, Email: mforman@mdanderson.org.
Edward Giovannucci, Email: egiovann@hsph.harvard.edu.
Bernard Rosner, Email: stbar@channing.harvard.edu.
Alberto Ascherio, Email: aascheri@hsph.harvard.edu.
References
- 1.Noseworthy JH, Lucchinetti C, Rodriguez M, Weinshenker BG. Multiple sclerosis. N Engl J Med. 2000;343:938–952. doi: 10.1056/NEJM200009283431307. [DOI] [PubMed] [Google Scholar]
- 2.van der Mei IA, Ponsonby AL, Dwyer T, et al. Past exposure to sun, skin phenotype, and risk of multiple sclerosis: case-control study. Bmj. 2003;327:316. doi: 10.1136/bmj.327.7410.316. [DOI] [PMC free article] [PubMed] [Google Scholar]
- 3.Kampman MT, Wilsgaard T, Mellgren SI. Outdoor activities and diet in childhood and adolescence relate to MS risk above the Arctic Circle. J Neurol. 2007;254:471–477. doi: 10.1007/s00415-006-0395-5. [DOI] [PubMed] [Google Scholar]
- 4.Munger KL, Zhang SM, O’Reilly E, et al. Vitamin D intake and incidence of multiple sclerosis. Neurology. 2004;62:60–65. doi: 10.1212/01.wnl.0000101723.79681.38. [DOI] [PubMed] [Google Scholar]
- 5.Munger KL, Levin LI, Hollis BW, et al. Serum 25-hydroxyvitamin D levels and risk of multiple sclerosis. Jama. 2006;296:2832–2838. doi: 10.1001/jama.296.23.2832. [DOI] [PubMed] [Google Scholar]
- 6.Ebers GC. Environmental factors and multiple sclerosis. Lancet Neurol. 2008;7:268–277. doi: 10.1016/S1474-4422(08)70042-5. [DOI] [PubMed] [Google Scholar]
- 7.Willer CJ, Dyment DA, Sadovnick AD, et al. Timing of birth and risk of multiple sclerosis: population based study. Bmj. 2005;330:120. doi: 10.1136/bmj.38301.686030.63. [DOI] [PMC free article] [PubMed] [Google Scholar]
- 8.Staples J, Ponsonby AL, Lim L. Low maternal exposure to ultraviolet radiation in pregnancy, month of birth, and risk of multiple sclerosis in offspring: longitudinal analysis. Bmj. 2010;340:c1640. doi: 10.1136/bmj.c1640. [DOI] [PMC free article] [PubMed] [Google Scholar]
- 9.Stene LC, Ulriksen J, Magnus P, Joner G. Use of cod liver oil during pregnancy associated with lower risk of Type I diabetes in the offspring. Diabetologia. 2000;43:1093–1098. doi: 10.1007/s001250051499. [DOI] [PubMed] [Google Scholar]
- 10.Fronczak CM, Baron AE, Chase HP, et al. In utero dietary exposures and risk of islet autoimmunity in children. Diabetes Care. 2003;26:3237–3242. doi: 10.2337/diacare.26.12.3237. [DOI] [PubMed] [Google Scholar]
- 11.Marjamaki L, Niinisto S, Kenward MG, et al. Maternal intake of vitamin D during pregnancy and risk of advanced beta cell autoimmunity and type 1 diabetes in offspring. Diabetologia. 53:1599–1607. doi: 10.1007/s00125-010-1734-8. [DOI] [PubMed] [Google Scholar]
- 12.Michels KB, Willett WC, Graubard BI, et al. A longitudinal study of infant feeding and obesity throughout life course. Int J Obes (Lond) 2007;31:1078–1085. doi: 10.1038/sj.ijo.0803622. [DOI] [PubMed] [Google Scholar]
- 13.Hernan MA, Olek MJ, Ascherio A. Cigarette smoking and incidence of multiple sclerosis. Am J Epidemiol. 2001;154:69–74. doi: 10.1093/aje/154.1.69. [DOI] [PubMed] [Google Scholar]
- 14.Bowes ACC, Church HN. Food Values of Portions Commonly Used. 6. Philadelphia,: PA: J B Lippincott & Company; 1946. [Google Scholar]
- 15.Bowes ACC, Church HN. Food Values of Portions Commonly Used. 9. Philadelphia,: PA: J B Lippincott & Company; 1963. [Google Scholar]
- 16.USDA. Nutrient Database for Standard Reference, release 19. Nutrient Data Laboratory; [Google Scholar]
- 17.Matilla P. Cholecalciferol and 25-hydroxycalciferol contents in fish and fish products. Journal of Foods Composition & Analysis. 1995:8. [Google Scholar]
- 18.USDA. USDA Nutrient Database. 1991. USDA Provisional Table on Vitamin D content of Foods. [Google Scholar]
- 19.Folsom JP. Physicians’ desk reference to pharmaceutical specialities and biologicals. 14. Oradell- New Jersey: Medical Economics INC; 1959. [Google Scholar]
- 20.Sobell J, Block G, Koslowe P, et al. Validation of a retrospective questionnaire assessing diet 10–15 years ago. Am J Epidemiol. 1989;130:173–187. doi: 10.1093/oxfordjournals.aje.a115310. [DOI] [PubMed] [Google Scholar]
- 21.Lindsted KD, Kuzma JW. Long-term (24-year) recall reliability in cancer cases and controls using a 21-item food frequency questionnaire. Nutr Cancer. 1989;12:135–149. doi: 10.1080/01635588909514012. [DOI] [PubMed] [Google Scholar]
- 22.Dwyer JT, Gardner J, Halvorsen K, et al. Memory of food intake in the distant past. Am J Epidemiol. 1989;130:1033–1046. doi: 10.1093/oxfordjournals.aje.a115404. [DOI] [PubMed] [Google Scholar]
- 23.Giovannucci E, Liu Y, Rimm EB, et al. Prospective study of predictors of vitamin D status and cancer incidence and mortality in men. J Natl Cancer Inst. 2006;98:451–459. doi: 10.1093/jnci/djj101. [DOI] [PubMed] [Google Scholar]
- 24.Forman JP, Giovannucci E, Holmes MD, et al. Plasma 25-hydroxyvitamin D levels and risk of incident hypertension. Hypertension. 2007;49:1063–1069. doi: 10.1161/HYPERTENSIONAHA.107.087288. [DOI] [PubMed] [Google Scholar]
- 25.Hernan MA, Olek MJ, Ascherio A. Geographic variation of MS incidence in two prospective studies of US women. Neurology. 1999;53:1711–1718. doi: 10.1212/wnl.53.8.1711. [DOI] [PubMed] [Google Scholar]
- 26.Miettenen O. Theoretical Epidemiology. New York: Wiley and sons Inc; 1985. [Google Scholar]
- 27.Laird NM, Ware JH. Random-effects models for longitudinal data. Biometrics. 1982;38:963–974. [PubMed] [Google Scholar]
- 28.Reich D, Patterson N, De Jager PL, et al. A whole-genome admixture scan finds a candidate locus for multiple sclerosis susceptibility. Nat Genet. 2005;37:1113–1118. doi: 10.1038/ng1646. [DOI] [PubMed] [Google Scholar]
- 29.Rahmaniyan M, Bell NH. Effects of race, geography, body habitus, diet, and exercise on vitamin D metabolism Vitamin D. In: Feldman P, Glorieux, editors. 2. Vol. 1. Boston: Elsevier Academic Press; 2005. pp. 789–801. [Google Scholar]
- 30.Holick MF. Sunlight and vitamin D for bone health and prevention of autoimmune diseases, cancers, and cardiovascular disease. Am J Clin Nutr. 2004;80:1678S–1688S. doi: 10.1093/ajcn/80.6.1678S. [DOI] [PubMed] [Google Scholar]
- 31.Lamb MM, Myers MA, Barriga K, et al. Maternal diet during pregnancy and islet autoimmunity in offspring. Pediatr Diabetes. 2008;9:135–141. doi: 10.1111/j.1399-5448.2007.00311.x. [DOI] [PubMed] [Google Scholar]
- 32.Camargo CA, Jr, Rifas-Shiman SL, Litonjua AA, et al. Maternal intake of vitamin D during pregnancy and risk of recurrent wheeze in children at 3 y of age. Am J Clin Nutr. 2007;85:788–795. doi: 10.1093/ajcn/85.3.788. [DOI] [PMC free article] [PubMed] [Google Scholar]
- 33.Zhang SM, Willett WC, Hernan MA, et al. Dietary fat in relation to risk of multiple sclerosis among two large cohorts of women. Am J Epidemiol. 2000;152:1056–1064. doi: 10.1093/aje/152.11.1056. [DOI] [PubMed] [Google Scholar]
- 34.Malosse D, Perron H, Sasco A, Seigneurin JM. Correlation between milk and dairy product consumption and multiple sclerosis prevalence: a worldwide study. Neuroepidemiology. 1992;11:304–312. doi: 10.1159/000110946. [DOI] [PubMed] [Google Scholar]
- 35.Butcher PJ. Milk consumption and multiple sclerosis--an etiological hypothesis. Med Hypotheses. 1986;19:169–178. doi: 10.1016/0306-9877(86)90057-5. [DOI] [PubMed] [Google Scholar]
- 36.Mana P, Goodyear M, Bernard C, et al. Tolerance induction by molecular mimicry: prevention and suppression of experimental autoimmune encephalomyelitis with the milk protein butyrophilin. Int Immunol. 2004;16:489–499. doi: 10.1093/intimm/dxh049. [DOI] [PubMed] [Google Scholar]
- 37.Gardener H, Munger KL, Chitnis T, et al. Prenatal and perinatal factors and risk of multiple sclerosis. Epidemiology. 2009;20:611–618. doi: 10.1097/EDE.0b013e31819ed4b9. [DOI] [PMC free article] [PubMed] [Google Scholar]
- 38.Salle BL, Delvin EE, Lapillonne A, et al. Perinatal metabolism of vitamin D. Am J Clin Nutr. 2000;71:1317S–1324S. doi: 10.1093/ajcn/71.5.1317s. [DOI] [PubMed] [Google Scholar]
- 39.Hollis BW, Wagner CL. Assessment of dietary vitamin D requirements during pregnancy and lactation. Am J Clin Nutr. 2004;79:717–726. doi: 10.1093/ajcn/79.5.717. [DOI] [PubMed] [Google Scholar]
- 40.Nesby-O’Dell S, Scanlon KS, Cogswell ME, et al. Hypovitaminosis D prevalence and determinants among African American and white women of reproductive age: third National Health and Nutrition Examination Survey, 1988–1994. Am J Clin Nutr. 2002;76:187–192. doi: 10.1093/ajcn/76.1.187. [DOI] [PubMed] [Google Scholar]
- 41.Eyles D, Almeras L, Benech P, et al. Developmental vitamin D deficiency alters the expression of genes encoding mitochondrial, cytoskeletal and synaptic proteins in the adult rat brain. J Steroid Biochem Mol Biol. 2007;103:538–545. doi: 10.1016/j.jsbmb.2006.12.096. [DOI] [PubMed] [Google Scholar]
- 42.McGrath JJ, Feron FP, Burne TH, et al. Vitamin D3-implications for brain development. J Steroid Biochem Mol Biol. 2004;89–90:557–560. doi: 10.1016/j.jsbmb.2004.03.070. [DOI] [PubMed] [Google Scholar]
- 43.Almeras L, Eyles D, Benech P, et al. Developmental vitamin D deficiency alters brain protein expression in the adult rat: implications for neuropsychiatric disorders. Proteomics. 2007;7:769–780. doi: 10.1002/pmic.200600392. [DOI] [PubMed] [Google Scholar]