

Summary
The brain is the most cholesterol-rich organ in the body, most of which comes from in situ synthesis. Here we demonstrate that in insulin-deficient diabetic mice, there is a reduction in expression of the major transcriptional regulator of cholesterol metabolism, SREBP-2, and its downstream genes in the hypothalamus and other areas of the brain, leading to a reduction in brain cholesterol synthesis, and synaptosomal cholesterol content. These changes are due, at least in part, to direct effects of insulin to regulate these genes in neurons and glial cells, and can be corrected by intracerebroventricular injections of insulin. Knockdown of SREBP-2 in cultured neurons causes a decrease in markers of synapse formation, and reduction of SREBP-2 in the hypothalamus of mice using shRNA results in increased feeding and weight gain. Thus, insulin and diabetes can alter brain cholesterol metabolism, and this may play an important role in the neurologic and metabolic dysfunction observed in diabetes and other disease states.
Introduction
Both type 1 (insulin-dependent) and type 2 (insulin-resistant) diabetes are associated with hyperglycemia; alterations in carbohydrate, lipid and protein metabolism; and a variety of complications affecting tissues of the body. These complications extend to the central nervous system (CNS), where they range from acute alterations in mental status due to poor metabolic control to greater rates of decline in cognitive function with age (Biessels et al., 2008; Cukierman et al., 2005), higher prevalence of depression (Ali et al., 2006), and an increased risk of Alzheimer’s disease (Craft and Watson, 2004).
The brain is the most cholesterol-rich organ, containing approximately 25% of the cholesterol present in the body. Almost all cholesterol present in the brain is formed by de novo synthesis, since the blood-brain barrier effectively prevents uptake from the circulation (Björkhem and Meaney, 2004; Dietschy and Turley, 2004). Mutations in genes regulating cholesterol metabolism result in several hereditary syndromes showing CNS manifestations, including Niemann-Pick disease type C and Smith-Lemli-Opitz syndrome (Korade and Kenworthy, 2008). The pathogenesis of Alzheimer’s disease is also linked to brain cholesterol metabolism with genetic risk factors including variations in apolipoprotein E and other cholesterol-related genes (Puglielli et al., 2003; Shobab et al., 2005). Cholesterol metabolism in the brain plays an important role in myelin production (Dietschy and Turley, 2004) and has been implicated in regulation of many processes, including the synaptophysin/synaptobrevin interaction (Mitter et al., 2003) and geranylgeraniol production (Kotti et al., 2006).
A number of abnormalities have been reported in mouse models of diabetes, including alterations in learning, memory, synaptic plasticity, and glutamatergic neurotransmission (Biessels and Gispen, 2005). Some of these appear to be the result of direct effects of insulin, which is transported into the CNS across the blood-brain barrier by a receptor-mediated transport process (Banks et al., 1997), as well as access of insulin to brain areas where the blood-brain barrier is less tight. Mice with heterozygous knockout of the insulin receptor exhibit impairment in object recognition (Das et al., 2005). Intranasal insulin administration can improve cognitive function in diabetic (Francis et al., 2008) and non-diabetic mice (Marks et al., 2009) without significant alterations in blood glucose levels.
Despite the accumulated evidence indicating effects of diabetes and insulin on neuronal function, the molecular mechanisms underlying the cerebral complications of diabetes have been yet to be elucidated. In the present study we show that diabetes produces a global suppression of the enzymes of cholesterol synthesis and their master transcriptional regulator SREBP-2 in the brain, and this results in reduced cholesterol biosynthesis, reduced synaptosomal membrane cholesterol, and altered neuronal and physiological function.
Results
Down-regulation of the Cholesterol Biosynthesis Pathway in Hypothalami of Diabetic Mice
The hypothalamus is a major point of control of the endocrine system, appetite and energy balance (Obici and Rossetti, 2003). In an effort to determine how diabetes affects hypothalamic function, we used oligonucleotide microarrays to identify genes differentially expressed in the hypothalamus in the streptozotocin (STZ)-induced diabetic mice (a model of insulin-deficient type 1 diabetes). Gene Set Enrichment Analysis (GSEA) indicated the cholesterol biosynthesis pathway as one of the most highly regulated gene sets in the hypothalamus of the STZ-diabetic mouse, with a broad decrease in expression of multiple cholesterologenic genes (Figure S1). Quantitative real-time PCR (qPCR) confirmed significant decreases in the majority of the genes encoding enzymes in the pathway producing cholesterol, including a 26% decrease in the rate-limiting enzyme 3-hydroxy-3-methylglutaryl-CoA reductase (Hmgcr) and decreases in mRNA for other cholesterologenic enzymes ranging from 7-36%. All changes in cholesterologenic genes were reversed by insulin treatment of the diabetic mice (Figure 1A).
Figure 1.

Cholesterol synthetic genes are broadly suppressed in the diabetic hypothalamus. (A) Comparison of gene expression for the cholesterol synthetic enzymes in hypothalami of control (CON, n = 6), STZ-diabetic (STZ, n = 5), and insulin-treated STZ (STZ+INS, n = 7) mice. Hypothalami were collected from male C57Bl/6 mice 9 days after STZ injection. Expression was measure by qPCR, and average values in CON assigned a value of 1. Bars denote mean ± SEM. a, P < 0.01 between CON and STZ; b, P < 0.01 between STZ and STZ+INS by ANOVA. The lower panel shows a schematic of the cholesterol-synthesis pathway. (B) Expression levels of SREBP isoforms in the hypothalamus normalized for Tbp. (C) Western blots of nuclear extracts from hypothalami of control and STZ-diabetic mice for nuclear SREBP (nSREBP) indicated by arrows. Lamin is an internal control. (D) Densitometry of the Western blots for SREBP precursors (pSREBP) and other proteins. Cytoplasmic extracts were used. Values are normalized by actin as a control. *, P < 0.05; **, P < 0.01; ***, P < 0.001 by ANOVA (B) or t-test (D).
Cellular cholesterol and fatty acid homeostasis is transcriptionally regulated by three members of sterol regulatory element-binding protein (SREBP) family - SREBP-1a, SREBP-1c, and SREBP-2. Of these, SREBP-2 preferentially activates genes responsible for cholesterol synthesis (Horton et al., 2002). By qPCR, SREBP-2 (Srebf2) was down-regulated by 34% in the STZ-diabetic mice. The expression level of SREBP-1a (Srebf1a) was also slightly, but significantly, reduced in the STZ hypothalamus, whereas SREBP-1c (Srebf1c) expression was unaffected (Figure 1B). Western blotting of hypothalamic extracts revealed that the nuclear mature form of SREBP-2 protein, i.e. transcriptionally active form, was also decreased (Figure 1C). Consistent with the mRNA data, protein levels of HMGCR, farnesyl diphosphate synthase (FDPS) and squalene epoxidase (SQLE), as well as those of the cytoplasmic precursor form of SREBP-2 were decreased as assessed by Western blotting (Figure 1D).
Cholesterol Synthesis Pathway Is Suppressed in Other Diabetes Models and Throughout the Brain
A reduction in cholesterol synthetic enzymes at the mRNA level was observed in multiple other diabetes models in which insulin levels were reduced. Thus, Srebf2 and its downstream genes were down-regulated by ~30% in the hypothalami from non-obese diabetic (NOD) mice, an autoimmune model of type 1 diabetes (Figure 2A), and hypothalami from obese, insulin-resistant db/db mice on a C57Bl/Ks background (Figure 2B), which exhibit a combination of obesity, insulin resistance, and declining insulin levels due to progressive β-cell failure (Uchida et al., 2005). By contrast, hypothalami of mice with dietary-induced (DIO) and genetic obesity (ob/ob), which have insulin resistance without loss of insulin secretion and milder degrees of hyperglycemia, showed no alteration in expression of these genes by microarray analysis (Figure S1) or qPCR (Figure S2A and S2B). These results suggest that absolute or relative decreases in circulating insulin levels and/or the degree of hyperglycemia, but not obesity or systemic insulin resistance, cause suppression of SREBP-2 and cholesterol synthesis pathway in the brain. Consistent with a role for insulin in SREBP-2 regulation in brain, fasting for 24 hours, which results in a decrease in both insulin and glucose, also caused down-regulation of Srebf2 and cholesterol synthetic genes in mouse hypothalami similar to that seen in STZ-diabetic mice (Figures 2C and S2C). Srebf2 was also significantly down-regulated in the hypothalami of NIRKO mice with brain-specific insulin receptor knockout (Brüning et al., 2000), and in this model, there was no further reduction by fasting, consistent with insulin being one of the factors regulating Srebf2 expression in the CNS (Figure 2C).
Figure 2.

Diabetes, fasting, and insulin regulation of cholesterol synthetic genes in the brain. (A) Comparison of the major cholesterologenic genes and Srebf2 gene expression in 5-month-old prediabetic NOD (n = 6) and diabetic NOD (n = 5) mouse hypothalami was performed by qPCR. (B) Gene expression in hypothalami of 9-week-old control db/+ (n = 6) and obese diabetic db/db (n = 6) mice on a C57Bl/Ks background was assessed by qPCR. (C) The effects of 24 hours fasting and brain- insulin receptor ablation on gene expression in the hypothalamus (n = 7 in each group). Average expression values in fed control hypothalami were assigned a value of 1. (D) Gene expression in the cerebral cortices of STZ-diabetic mice was measured by qPCR. (E) Densitometry of Western blots for cholesterol synthetic enzymes in the STZ-diabetic cerebral cortex. Values were normalized using actin as an internal control. *, P < 0.05; **, P < 0.01; ***, P < 0.001 by t-test (A, B) or ANOVA (C, D, E). Error bars represent SEM.
Down-regulation of SREBP-2 and cholesterologenic genes due to diabetes is not limited to the hypothalamus, but part of a more general effect on the brain. In the cerebral cortex, STZ-induced diabetes produced a robust reduction of these cholesterologenic genes with a 36% decrease in Srebf2 mRNA and a 38% decrease in Hmgcr mRNA (Figure 2D). As with the hypothalamus, these were associated with parallel changes in the protein levels encoded by these transcripts in the cerebral cortex (Figure 2E).
Role of Insulin versus Hyperglycemia in Control of the Cholesterol Synthesis
To determine whether hyperglycemia or insulin insufficiency was responsible for the suppression of cholesterol synthesis pathway in the diabetic mouse brain, we treated the STZ-induced diabetic mice with phlorizin (PHZ), a flavonoid which can decrease blood glucose levels by inhibition of renal glucose transport without restoring insulin secretion (Rossetti et al., 1987). As shown in Figure 3A (right), PHZ treatment efficiently normalized hyperglycemia in the STZ-diabetic mice to a level similar to that seen with insulin treatment. This reduction of blood glucose did not reverse suppression of SREBP-2 and its downstream genes in the hypothalamus of diabetic mice (Figure 3A, left panel), suggesting that hyperglycemia is not the major driver for the suppression of cholesterol synthesis in diabetes.
Figure 3.
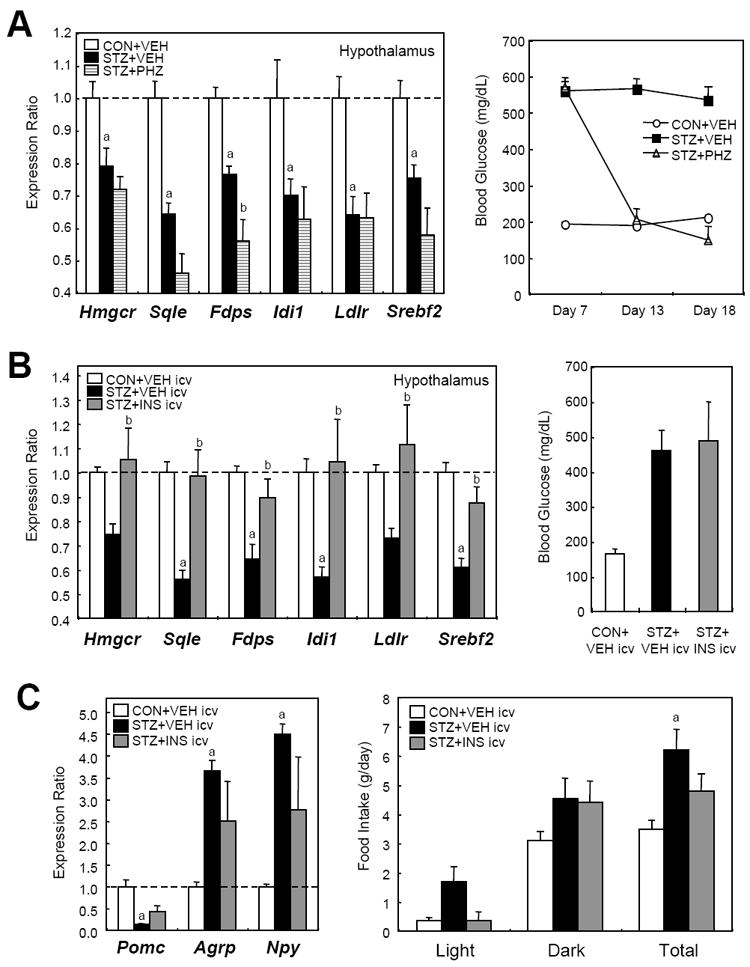
Reduction of hyperglycemia does not reverse suppression of the SREBP-2 pathway, whereas intracerebroventricular (ICV) insulin does. (A) C57Bl/6 mice received injection of phlorizin (PHZ) or vehicle (VEH) solution twice daily for 10 days from day 8 after the STZ treatment. In the left panel, comparison of gene expression for Srebf2 and its major downstream genes in hypothalami of VEH-treated control (CON+VEH, n = 5), VEH-treated STZ-diabetic (STZ+VEH, n = 6), and PHZ-treated STZ (STZ+PHZ, n = 5) mouse hypothalami was performed by qPCR. In the right panel, blood glucose levels were measured. a, P < 0.05 between CON+VEH and STZ+VEH; b, P < 0.05 between STZ+VEH and STZ+PHZ by ANOVA. (B) STZ-diabetic mice received ICV injections of insulin or vehicle as described in Experimental Procedures. Left panel: gene expression in hypothalami of vehicle-injected control (CON+VEH icv, n = 4), vehicle-injected STZ-diabetic (STZ+VEH icv, n = 5), and insulin-injected STZ (STZ+INS icv, n = 4) mouse hypothalami was assessed by qPCR. Right panel: blood glucose levels were measured 4 hours after the last ICV injection. a, P < 0.05 between CON+VEH icv and STZ+VEH icv; b, P < 0.05 between STZ+VEH icv and STZ+PHZ icv by ANOVA. (C) The effects of the insulin ICV injection on feeding behavior and neuropeptide gene expression were monitored. Comparison of gene expression for neuropeptides regulating appetite was performed by qPCR (left). Food intake was measured after the ICV injection (right),. Error bars represent SEM.
To assess the effects of insulin, we directly administered insulin into the cerebral ventricles of STZ-induced diabetic mice by 3 injections of insulin into a catheter placed in the lateral ventricle. This intracerebroventricular (ICV) injection of insulin did not affect blood glucose levels (Figure 3B, right). However, the suppression of SREBP-2 pathway in the hypothalamus of the diabetic mouse was almost completely normalized by insulin ICV injection (Figure 3B, left), indicating that insulin deficiency is a major cause of the suppression. ICV injection of insulin also partially normalized the expression the neuropeptides expression involved in feeding behavior [proopiomelanocortin (Pomc), agouti-related peptide (Agrp), and neuropeptide Y (Npy)], and partly reversed the hyperphagia induced by STZ diabetes (Figure 3C). Together, these data indicate that insulin deficiency, not hyperglycemia, is the major driver of the altered cholesterol biosynthesis observed in the diabetic mouse.
Decreased Cholesterol Synthesis in the Diabetic Brain Is Accompanied by Decreased Synaptosomal Membrane Cholesterol
To determine if these changes in cholesterologenic gene expression in diabetes affected brain cholesterol synthesis, we directly assessed cholesterol synthesis in STZ-diabetic and control mice using tritiated water (Figure 4A, left panel). In vivo cholesterol synthesis in the brain was reduced by 24% (P < 0.05) in diabetic mice (Figure 4A, right panel), closely parallelling the decrease in cholesterologenic enzymes. Since much of brain cholesterol is in slowing turning over myelin (Dietschy and Turley, 2004), it is not surprising that no change was observed in total cholesterol content in the cerebral cortex after only 18 days of diabetes (13.7 ± 0.4 versus 14.1 ± 0.4 mg/g of tissue:, P = 0.49). However, the reduced cholesterol synthesis was reflected with a significant and parallel 22% decrease in cholesterol content of isolated synaptosomal membranes from the brains of diabetic mice (Figure 4B).
Figure 4.

Diabetes suppresses cholesterol synthesis and reduces cholesterol content in synaptosomal membranes. (A) In vivo cholesterol synthesis in the whole cerebra was assessed for control (n = 4) and STZ-diabetic (n = 4) mice 17 days after STZ administration using the protocol shown on the left. Cerebra were dissected 1 h after intraperitoneal injection of tritiated water, and cholesterol was isolated by thin layer chromatography (TLC) from the extracted lipid. In the right panel, the rate of cholesterol synthesis is expressed as nmol cholesterol synthesized per gram of cerebrum per hour. (B) Cholesterol content in the synaptosomal membrane extracted from the frontal cortex of control (n = 4) and STZ-diabetic (n = 4) mice 18 days after STZ administration. Synaptosome-rich fraction was separated from myelin fraction by discontinuous sucrose gradient centrifugation as shown on the left (Kolomiytseva et al., 2008). The synaptosomal cholesterol content in μg per mg protein is shown on the right. (C) Content of representative sterols in the brain measured by HPLC/MS (McDonald et al., 2007) for control (n = 4) and STZ-diabetic (n = 4) mice 18 days after STZ injection. 24-OH-chol, 24-hydroxycholesterol; 24,25-ep-chol, 24,25-epoxycholesterol; 27-OH-chol, 27-hydroxycholesterol. *, P < 0.05; ***, P < 0.001 by t-test. Error bars represent SEM.
As noted above, alterations in brain cholesterol in humans have been suggested to play a role in some neurological and neurodegenerative diseases. To determine if these cholesterol synthetic processes might be regulated in humans, we analyzed cholesterol synthetic gene expression patterns and synaptosomal cholesterol content in cerebral cortices from 16 elderly (75-99 years old) humans. In the cortices there was a strong positive correlation between the levels of Srebf2 mRNA and those for two of its downstream targets - Hmgcr and Fdps (Figure S3A). More importantly, there was a significant positive correlation (r = 0.58, P = 0.02) between cholesterol content in isolated synaptosomal membranes and the mRNA expression of Fdps, (Figure S3B), suggesting that factors which control expression of genes for cholesterol synthesis may also affect synaptosomal cholesterol in human brains.
Broad suppression of the cholesterologenic pathway in diabetes affects multiple steps of cholesterol biosynthesis in the brain. Thus, cholesterol precursors, such as desmosterol, lathosterol, and lanosterol, were reduced by 26%, 44%, and 60% respectively, in the brain of STZ-induced diabetic mice (Figure 4C). Thus in addition to its effects on cholesterol synthesis, diabetes may suppress synthesis of other related lipid products, including isoprenoids, dolichols and ubiquinone in the brain.
Cholesterol in the brain can be converted to 24-hydroxycholesterol, which can spontaneously diffuse into the circulation, by a neuronal enzyme cholesterol 24-hydroxylase (CYP46A1) (Russell et al., 2009). Interestingly, although the expression of CYP46A1 was mildly down-regulated (Figure S3C), the content of 24-hydroxycholesterol in the STZ-diabetic brain was slightly increased (12%) (Figure 4C). Content of other oxysterols, such as 24,25-epoxycholesterol and 27-hydroxycholesterol, on the other hand, were decreased (Figure 4C).
Insulin Activates Cholesterol Biosynthesis Pathway in Cultured Neurons and Glial Cells
To dissect the cell type and factors regulating the changes in cholesterol biosynthesis, we isolated and cultured neuron and glial cells (astrocytes) from the cortices of 16-day-old C57Bl/6 mouse embryos and 1-day-old neonates, respectively. In both cell types, 6 hours of exposure to insulin (10-100 nM) stimulated expression of all of the cholesterologenic genes by 30 to 270 % (Figure 5A). Incubation of cells with high concentrations (25 mM) of glucose for 3 days suppressed mRNA of some cholesterologenic genes, such as Sqle and Fdps, in glial cells, but had no effect on any of the cholesterologenic genes in cortical neurons (Figure 5B), consistent with the in vivo studies (Figure 3A) suggesting that insulin, not hyperglycemia, is responsible for the altered expression of genes involved in cholesterol synthesis in brain in diabetes.
Figure 5.
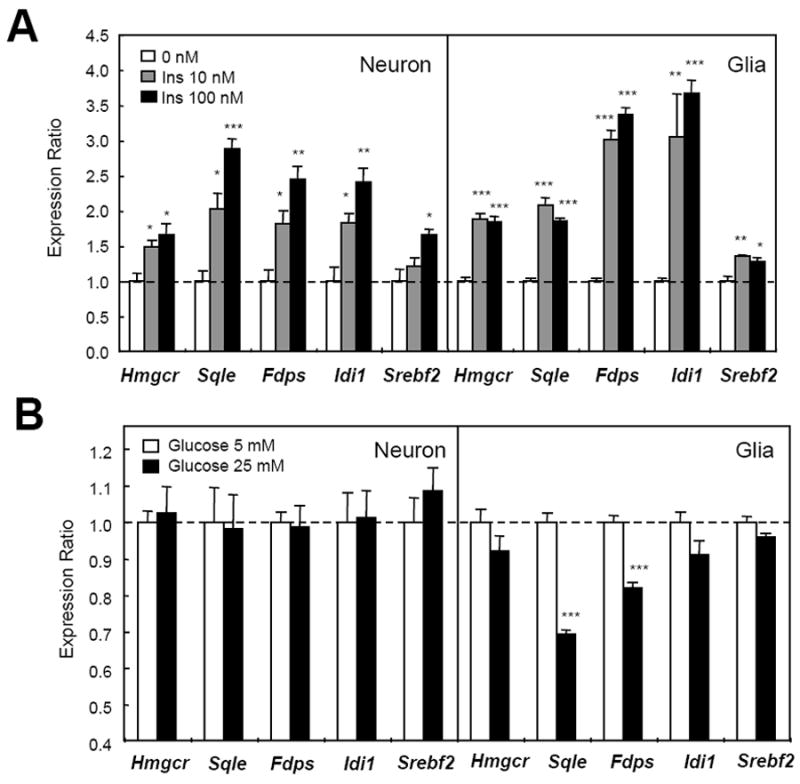
Insulin induces cholesterol synthetic gene expression in mouse primary cultured glia and neurons. (A) Primary mouse cultured cortical neurons and glia (18 days in vitro) were incubated in medium with insulin for 6 h. Data are representative of three experiments. (B) Primary culture cortical neurons and glia were incubated with low (5 mM) or high (25 mM) concentrations of glucose in medium for 72 hours. In all panels, mRNA was extracted from the cells at the end of treatment and gene expression levels were quantified by qPCR. *, P < 0.05; **, P < 0.01; ***, P < 0.001 by ANOVA. Error bars represent SEM.
Effects of insulin on cholesterol synthetic genes involve multiple signaling pathways. In liver, SREBP-effects on lipogenesis involve Akt, atypical protein kinase C, and mTORC1 activity (Li et al., 2010; Porstmann et al., 2008; Taniguchi et al., 2006). In cultured neurons, rapamycin, as well as the PI 3-kinase inhibitor LY294002 and the MEK inhibitor U0126, partially suppressed insulin’s effect on Hmgcr induction, and these effects were additive, suggesting that the mTORC1, PI 3-kinase and MAP-kinase pathways act together in Hmgcr induction by insulin (Figure S4A). Treatment of cultured neurons with the glycogen synthase kinase (GSK) 3 inhibitor SB216763 mimicked insulin’s effects on this pathway producing a broad increase in expression of cholesterol synthetic genes that was also inhibited by pretreatment of cells with the mTORC1 inhibitor rapamycin (Figure S4B). Since the mTORC1 pathway is activated by nutrients (Avruch et al., 2009), as well as hormones like insulin, this pathway may play a role in the decrease of cholesterol synthetic genes induced by fasting (Figure S2C).
Loss of SREBP-2 Reduces Pre- and Post-synaptic Markers in Hippocampus Neurons
Cholesterol is crucial for synaptic structure, function, and genesis (Mauch et al., 2001). To investigate the effects of reduced cholesterologenic genes in brain, we generated an SREBP-2 silencing lentivirus vector (Lenti-shSREBP2), which co-expressed Srebf2 shRNA with green fluorescent protein (GFP) under the control of cytomegalovirus promoter (Figure 6A). Western blot analysis indicated that the infection with Lenti-shSREBP2 vector suppressed SREBP-2 expression by 90% in N25/2 mouse hypothalamic neuronal cells in culture compared with a control non-silencing vector (Figure 6B). Transient infection with the Lenti-shSREBP2 without selection caused 60% reduction of Srebf2 and Hmgcr genes in primary cultured mouse hippocampal neurons (Figure 6C). This resulted in an ~40% reduction (P < 0.001) in density of synapse formation on the neurites as indicated by staining with the post-synaptic marker PSD95 (Figure 6D). In the SREBP2 knockdown neurites, there was also a 34% decrease in the staining intensity of the synaptic vesicle marker VAMP2 (Figure 6E), consistent with the role of cholesterol in synaptic vesicle biogenesis (Thiele et al., 2000) and exocytosis (Lang et al., 2001). These findings provide a link between diabetes and altered synapse function and help explain the reports of decreased synaptic markers in hippocampus and cortex of STZ-diabetic mice (Francis et al., 2008).
Figure 6.

SREBP-2 silencing lentivirus vector reduces synaptic marker staining in dendrites of hippocampal neurons. (A) Schematic of the pGIPZ-shSREBP2 construct. pCMV, cytomegalovirus promoter; GFP, green fluorescent protein; IRES, internal ribosome entry site; PuroR, puromycin resistance gene; LTR, long terminal repeat; SIN-LTR, self inactivating LTR. (B) Western blots of murine hypothalamic neuronal N-25/2 cells with control non-silencing (NS) and shSREBP2 lentivirus infection. (C) Expression levels of Srebf2 and Hmgcr in the primary cultured mouse hippocampal neurons after the lentivirus infection. Values were normalized for Tbp expression. (D) Post-synaptic marker staining in primary cultured mouse hippocampal neurons (8 days in vitro) after lentivirus-mediated SREBP-2 silencing. Left panels show representative confocal images. Red represents PSD95, green derives from GFP that the vectors encode, and blue represents the neuron marker MAP2. In right panel, PSD95 density in neurites was calculated as signal-positive area divided by the length of neurite. Values were measured in 69 neurites from 30 neurons (Lenti-NS) and 78 neurites from 27 neurons (Lenti-shSREBP2) using ImageJ software. Scale bar, 25 μm. (E) Staining for the synaptic vesicle marker VAMP2 in the hippocampal neurons. In the left two images, red represents VAMP2, and the other colors are as above. In the right panel, average VAMP2 staining intensity in the neurites has been calculated using 65 neurites from 35 neurons for the Lenti-NS: control and 49 neurites from 20 neurons for the Lenti-shSREBP2 infected cells. Data are representative of three independent experiments. ***, P < 0.001 by t-test. Error bars represent SEM.
SREBP-2 Knockdown in the Hypothalamus Affects Feeding Behavior and Endocrine Homeostasis
To begin to elucidate the physiological role of SREBP-2 in the brain in vivo, we injected the Lenti-shSREBP2 vector directly into the hypothalami of C57Bl/6 mice. This produced a 33% reduction in the precursor and 44% reduction in the nuclear forms of SREBP-2 in the ventral hypothalamus (Figure 7A). GFP fluorescence, an indicator of lentivirus infection, was observed in neuronal cell bodies and some astrocyte processes (Figure 7B) in the paraventricular hypothalamus (PVH), ventromedial hypothalamus (VMH), and arcuate nucleus (ARC) (Figure S5A). After a brief initial decline in food intake in all mice receiving intra-hypothalamic injection, mice with knockdown of SREBP-2 exhibited a 14% increase in nocturnal food intake (P < 0.01) and a similar increase in total daily food intake (Figure 7C and S5B). As a result, body weight gain over the 21 days following injection was significantly greater in the mice treated with Lenti-shSREBP2 compared to controls (Figure 7D and E). Neurons in the VMH are largely glutamatergic (Tong et al., 2007) and have been shown to mediate counter-regulatory responses to hypoglycemia (Borg et al., 1994). In this regard, mice with hypothalamic knockdown of SREBP-2 exhibited a 34% reduction of circulating norepinephrine (Figure 7F) and glucagon (Figure S5C) in the fasted state and a small increase in fasting insulin levels (Figure 7G). Insulin tolerance tests (Figure S5D) and glucose tolerance testing (Figure S5E) showed either no change or a very modest improvement, and there was no change in physical activity or whole body oxygen consumption rate as assessed in metabolic cages (Figure S5F).
Figure 7.

SREBP-2 knockdown in the hypothalamus affects feeding behavior and metabolic phenotype. (A) Western blots of ventral hypothalami from mice with intrahypothalamic (ihp) lentivirus injection on day 31. (B) Confocal images of the lentivirus-infected hypothalami on day 7. In the left panel, red represents a neuronal marker MAP2, green derives from GFP that the vectors encode, and blue represents nuclei. On the right, red represents the astrocyte marker GFAP. Arrows indicate the GFP-positive astrocyte processes. Scale bar, 25 μm. (C) Food intake of male C57Bl/6 mice after ihp injection of Lenti-shSREBP2 (n = 18) or control Lenti-NS (n = 19). Food intake was measured twice a day from day 15 after the injection for consecutive 12 days. (D and E) Body weight change and absolute body weight of the same mice. (F) Plasma norepinephrine concentrations in mice with ihp injection of Lenti-NS (n = 10) and Lenti-shSREBP2 (n = 10) after 48 hours of fasting. (G) Fasting plasma insulin concentrations (24 h) in mice with ihp injection of Lenti-NS (n = 10) and Lenti-shSREBP2 (n = 10). *, P < 0.05; **, P < 0.01 by t-test. Error bars represent SEM. (H) Proposed model for cerebral dysfunction in diabetes via insulin-mediated cholesterol regulation. Reduction in circulating insulin results in reduced SREBP-2 in both neurons and astroglial cells, and this results in a reduction of cholesterol synthesis and this causes changes in synapse components, affecting neural excitability and functions.
Discussion
The brain is the most cholesterol-rich organ in the body, most of which comes from in situ synthesis (Dietschy and Turley, 2001). Brain cholesterol turnover is increased in Alzheimer’s and other neurodegenerative diseases, and has been suggested to play a role in pathogenesis of these disorders (Reiss et al., 2004). Diabetes mellitus is associated with a variety of neurologic and cerebral complications, including cognitive dysfunction, depression, and increased risk of Alzheimer’s disease (Biessels et al., 2008; Craft and Watson, 2004; Cukierman et al., 2005). In this study, we show that the cholesterol biosynthesis pathway is down-regulated in hypothalami and cortices of STZ-diabetic mice, as well as other insulin-deficient diabetic models. This change in gene expression leads to a decrease in cholesterol synthesis in brain and a decrease in cholesterol content in synaptosomal membranes. Mimicking the reduction in cholesterologenic genes in cultured neurons by knockdown of SREBP-2 results in reduced markers of synapse formation, and knockdown of SREBP-2 in the hypothalamus in vivo causes altered feeding behavior and dysregulation of counter-insulin hormones.
The notion of decreased cholesterol biosynthesis leading to altered brain function is supported by in vitro studies which have indicated that cholesterol is essential for synaptogenesis and synapse function. For example, it has been shown that pharmacological depletion of cholesterol from lipid rafts in cultured neuronal cells leads to gradual loss of synapses (Hering et al., 2003). Depletion of cholesterol also has been shown to block the biogenesis of synaptic vesicles (Rohrbough and Broadie, 2005; Thiele et al., 2000), and disrupt SNARE clusters leading to decreased neurotransmitter release (Chamberlain et al., 2001; Lang et al., 2001). Thus, the reduction in synaptosomal membrane cholesterol observed in diabetes could contribute to the glutamatergic synapse dysfunction and altered long-term potentiation observed in the brains of diabetic animals (Trudeau et al., 2004). In addition, the reduction of specific synaptic components, such as the scaffold protein PSD95, which is decreased in neurons with reduced SREBP-2, could contribute to reduced excitatory synapse formation and altered glutamate release (El-Husseini et al., 2000).
The finding of unchanged total brain cholesterol versus reduced synaptosomal membrane cholesterol content in the acute diabetes model is not surprising. The majority (70%) of cholesterol present in the CNS is in myelin sheaths and turns over very slowly (Barres, 2008). Most of the remainder is in the membranes of astrocytes and neurons (Björkhem and Meaney, 2004). This pool turns over more quickly (Okabe et al., 1999) and is therefore likely to be most reflective of short-term changes in cholesterol synthesis. Impairment of myelin formation has been observed in the brains of mouse models of long-term type 1 diabetes (Francis et al., 2008). Reduced cholesterol content in cortical synaptosomes and microsomes is also observed in the Yakutian ground squirrel during hibernation (Kolomiytseva et al., 2008). Our findings suggest that the hypoinsulinemia induced by prolonged starvation during hibernation could lead to down-regulation of SREBP-2 in brain resulting in these changes.
Previous studies have suggested that, in the adult, neurons rely on delivery of cholesterol from nearby astrocytes. This “outsourcing” allows the neurons to focus on generation of electrical activity and dispense with energetically costly cholesterol synthesis (Pfrieger, 2003). Our in vitro data, however, indicate that insulin induces robust increases cholesterologenic gene expression in both astrocytes and neurons. Thus, it appears that both of these cell types participate in insulin regulated cholesterol synthesis and synapse maintenance (see Figure 7H), and it is likely that both are altered in hypoinsulinemic diabetes. These two cell types do appear to differ in response to hyperglycemia in vitro, with the effect of high glucose to lower cholesterologenic gene expression being greatest in glial cells. However, reduction of hyperglycemia by phlorizin treatment in vivo does not reverse the down-regulation of cholesterologenic genes in the diabetic mouse hypothalamus, whereas ICV insulin injection does, indicating the dominant role of insulin in this regulatory process. Our data indicate that multiple molecular pathways are involved, including the mTORC1, PI 3-kinase and MAP-kinase pathways. These are also downstream of brain-derived neurotrophic factor (Chen et al., 2009; Xia et al., 2010), which has been shown to induce cholesterol synthesis and synapse development in primary cultured neurons (Suzuki et al., 2007). Insulin action on GSK3β and other pathways has also been shown to play a role in controlling Tau phosphorylation in the CNS (Lucas et al., 2001; Schubert et al., 2004) and neural progenitor homeostasis (Kim et al., 2009).
Exactly what the full range of effects of reduced cholesterol synthesis in brain in diabetes might be will need further study. In addition to its role in myelin, cholesterol is an important component of cell membranes and has been implicated in regulation of the synaptophysin/synaptobrevin (VAMP) interaction (Mitter et al., 2003) and geranylgeraniol production (Kotti et al., 2006). We find that reduction in SREBP-2 in the hypothalamus affects feeding behavior and circulating levels of the counter-insulin hormones norepinephrine and glucagon. This mixture of hyperphagia with reduced plasma catecholamine levels is similar to that observed in mice lacking synaptic vesicular transporters for glutamate in VMH neurons (Tong et al., 2007). While understanding the role of altered cholesterol biosynthesis in diseases of the brain is still limited (Stefani and Liguri, 2009), reduction of cholesterol biosynthesis has been observed in a Huntington’s disease model (Valenza et al., 2005), whereas prion infection has been shown to up-regulate SREBP-2 and cholesterol biosynthesis in cultured neurons (Bach et al., 2009). Diabetes is a complex disease that may affect brain/neuronal function by multiple mechanisms, in addition to its effects on cholesterol metabolism.
Over the past decade there have been important advances in defining the mechanisms that cells use to regulate cholesterol levels and lipid metabolism (Horton et al., 2002). In liver and kidney, insulin has been shown to activate both SREBP-1 and SREBP-2 (Arito et al., 2008; Xie et al., 2009), which in turn control both fatty acid and cholesterol biosynthesis. Our results indicate that this same system plays an important role in control of brain cholesterol levels with direct regulation by insulin of SREBP-2 and down-stream cholesterologenic genes at the transcriptional level leading to altered rates of cholesterol biosynthesis. This results in a strong positive correlation between expression of these cholesterologenic genes and cholesterol content in synaptosomal membranes in both human and mouse brain. In liver, there is a strong feedback system in which cholesterol and sterol intermediates regulate the activation of the SREBP family of transcription factors through mechanisms involving ER-to-Golgi transport and production of the active transcription factor through limited proteolysis (Horton et al., 2002). While it is likely that this feedback system is active in brain, in the brain of diabetic animals, there is a failure to compensate for reduced cholesterol synthesis and reduced synaptosomal cholesterol with up-regulation of cholesterologenic genes. This might be due to morphological complexity of neurons and astrocytes that have long processes spatially distant from the endoplasmic reticulum, where SREBP cleavage-activating protein (SCAP) works as a sensor, or might represent a fundamental difference in regulation of cholesterol synthesis in brain and liver.
An important question which this study does not address is how therapy with statins (HMGCR inhibitors) might alter brain function in normal individuals or patients with diabetes or dementia Some studies have reported relatively acute cognitive decline and memory loss in individuals on statins, which improve after discontinuation of the drug (Evans and Golomb, 2009; Tuccori et al 2008; Xiong et al., 2005). On the other hand, larger prospective trials assessing cognitive function in patients on statins have found no evidence of progression or protection from cognitive decline (Trompet et al., 2010), and studies of statins in patients with Alzheimer’s disease have shown no clear effects to either protect or accelerate dementia (Shobab et al., 2005).
In summary, we have demonstrated that diabetes results in broad alterations in expression of SREBP-2 and downstream cholesterol synthetic genes in brain. This results in a reduction of brain cholesterol synthesis, reduction in cholesterol precursors, reduction in synaptosomal membrane cholesterol, and changes in synaptic formation and function. In the hypothalamus, reducing SREBP-2 mediated cholesterol synthesis can affect feeding behavior and control of endocrine function. This dysregulation of brain cholesterol metabolism provides a novel mechanism of altered brain and neuronal function observed in diabetes and metabolic disorders. Alterations in brain cholesterol metabolism could serve as a link between insulin, diabetes, aging and a variety of disorders of neural function, including effects on learning, memory and higher cognitive functions.
Experimental Procedures
Animals
C57Bl/6, ob/ob (C57Bl/6 background), db/+ and db/db (C57Bl/Ks background) mice were from Jackson laboratory (Bar Harbor, ME). NIRKO mice were generated as previously described (Brüning et al., 2000). NOD mice were provided by Drs. Diane Mathis and Wenyu Jiang (Harvard Medical School). All mice used for experiments were male. For STZ-induced diabetes and systemic insulin therapy experiments, 7-week-old C57Bl/6 mice were treated with a single intraperitoneal (i.p.) injection (200 μg/g body weight) of STZ (Sigma). After 2 days, the mice were separated into two groups. Half remained untreated, and the other half were treated with subcutaneous insulin pellets (LinShin, Toronto, Canada) for one week to control blood glucose levels. For phlorizin (PHZ) treatment, 8-week-old C57Bl/6 mice were treated with STZ. PHZ (Sigma) was dissolved in a solution containing 10% ethanol, 15% DMSO, and 75% saline and was injected subcutaneously (0.4 g/kg) twice daily for 10 days starting 8 days after the STZ injection. Control mice were injected with the same volume of vehicle.
Mice were anesthesized with a 2.5% solution of 2:1 mixture of 2,2,2-tribromoethanol and tertiary amyl alcohol (15 μl/g body weight, i.p.). The brain was quickly removed, placed on ice and dissected using a mouse brain matrix (ASI Instruments Inc., Warren, MI). All animal studies followed National Institutes of Health guidelines and were approved by the Institutional Animal Care and Use Committees at the Joslin Diabetes Center.
Insulin ICV injection in diabetic mice
Seven-week-old C57Bl/6 mice were placed in a stereotactic device under anesthesia, and a 26-gauge guide cannula (Plastics One Inc., Roanoke, VA) was inserted into the right lateral cerebral ventricle (1.0 mm posterior, 1.0 mm lateral, and 2.0 mm ventral to the bregma). A dummy stylet cannula was inserted into each cannula until used. After a 1 week recovery, the mice received a single i.p. injection of STZ to induce diabetes. Twelve days later, the mice received three ICV injections of insulin (3 mU in 2 μL) or the same volume of PBS (9 AM, 7 PM and 9 AM the following day) through an internal cannula using a Hamilton microsyringe. Food intake was measured immediately before the ICV injection. Four hours after the last injection, blood glucose levels were measured, and the hypothalami collected.
In vivo Cholesterol Synthesis in the Brain
The rates of cholesterol synthesis in the brain were measured in 7-week-old C57Bl/6 male mice 17 days after STZ or control buffer i.p. injection. Each animal was injected i.p. with 50 mCi of [3H]water in 0.2 mL of PBS. One hour later, each animal was anesthetized, blood was collected by retro-orbital puncture, and the [3H]water specific activity in the plasma was measured. The brain was removed, and the whole cerebrum was saponified with 2.5 mL of 2.5M KOH (75 °C, 2 hours). Sterol-containing lipid was extracted using 10 mL hexane and 5 mL 80% ethanol. Cholesterol was isolated by thin layer chromatography (hexane: diethyl ether: glacial acetic acid = 80:20:1), and the incorporated tracer was measured by scintillation counting. Synthesis rates were calculated as nmol of [3H]water incorporated into cholesterol per gram of tissue per hour.
Synaptosomes were isolated using discontinuous sucrose density gradient centrifugation (Kolomiytseva et al., 2008) as detailed in Supplemental Experimental Procedures.
Measurement of sterols in the brain
Contents of cholesterol precursors and derivatives were measured in the brains from 10-week-old C57Bl/6 mice, 18 days after STZ or control buffer i.p. injection. Lipids were extracted from the sagitally-sectioned half brains. Sterols were resolved by HPLC, identified by a 4000 QTRAP mass spectrometer (Applied Biosystems), and quantified by comparison of the areas under the elution curves derived from the detection of endogenous compounds and isotopically labeled standards (McDonald et al., 2007).
Primary Culture Glia and Cortical Neurons for Insulin and Glucose Stimulation
The cerebral cortex was dissected from 0-1 day old for glia and day 16 embryonic C57Bl/6 mice for neurons (see Supplemental Experimental Procedures). For insulin stimulation, cells were serum deprived and pre-incubated with medium containing 0.5% bovine serum albumin (BSA) for 6 hours, then stimulated with 0 to 100 nM insulin for 6 hours. For glucose challenge, cells were incubated in medium containing serum and 5 mM or 25 mM glucose for 72 hours. Cells were harvested between 18 and 22 days after the initial plating.
Lentivirus Vector for SREBP-2 Silencing
Lentiviral vector plasmids for murine SREBP-2 shRNA (GIPZ Lentiviral shRNAmir, Open Biosystems, Huntsville, AL) and control non-silencing (NS) shRNA were packaged by co-transfection with packaging plasmids in HEK293T cells (Trans-Lentiviral Packaging System, Open Biosystems). Viral particles were concentrated by ultracentrifugation.
Primary Cultured Mouse Hippocampal Neurons for Lentivirus-mediated SREBP-2 Silencing
For confocal assays, primary cultures of hippocampus were prepared from 0-1 day old C57Bl/6 mice using a Papain Dissociation System (Worthington Biomedical Corporation, Lakewood, NJ). Dissociated cells were plated on poly-L-lysine-coated cover glasses (Carolina Biological Supply, Burlington, NC) at 6 × 10⁴ cells/cm2 and cultured in Neurobasal medium (Invitrogen) containing the 1x B27 supplement (Invitrogen), 125 μM GlutaMax (Invitrogen) and 25 μM glutamic acid. Neurons were infected with lentivirus vectors after 2 days in vitro (DIV). On 4 DIV the culture medium was changed to Neurobasal medium supplemented with 1x B27, 125 μM GlutaMax and 10 μM cytosine arabinoside (Sigma).
Intrahypothalamic Injection of Lentivirus Vectors
Seven to 8 week-old male C57Bl/6 mice were used. The mice were housed in individual cages, and given diet pellets containing 10% fat by kilocalories (D12450B, Research Diet Inc.) and free access to water prior to the experiments. The mice were placed in a stereotactic device under anesthesia, and a 33-gauge cannula (Plastics One Inc.) was inserted into the hypothalamus (0.5 mm posterior, ± 0.5 mm lateral, and 5.7 mm ventral from the bregma). Lentivirus vector (~108 TU/mL, 0.5 μL) was injected into the ventral hypothalamus bilaterally between 9-10 AM. Body weight of all mice was monitored daily, and food intake was measured twice a day at 9-10 AM and 6-7 PM, from 15 days after the injection for consecutive 12 days. Plasma norepinephrine levels were measured using an ELISA kit (Immuno-Biological Laboratories Inc., Minneapolis, MN).
Statistical Analysis
Data are expressed as the mean ± SEM. Statistical significance was calculated using an unpaired Student’s t-test for comparison between two groups, and by an analysis of variance (ANOVA) for multigroup comparison. Statistical significance in Pearson’s correlation coefficient (r) was determined by F-test.
Supplementary Material
Acknowledgments
We thank David Russell (University of Texas Southwestern Medical School) for helpful discussion and the LIPID MAPS Large Scale Collaborative Grant (GM069338) for assay of brain sterols. We Jay Horton and Guosheng Liang for providing SREBP-1 and SREBP-2 antibodies; and Wenyu Jiang and Diane Mathis for providing NOD diabetic mice. We are grateful to M. Rourk and G. Smyth for animal care, C. Cahill (Joslin DERC Advanced Microscopy Core), A. Clermont, M. Poillucci (DERC Physiology Core), H. Li (DERC Specialized Assay Core), and J. Schroeder (DERC Genomics Core) for technical assistance. This work was supported by NIH grants DK31036, 33210, and 60937 (to C. R. K.), ADRC AG05136 (to S. C.), GM069338 (to J. G. M), and P30 DK036836 (Joslin DERC Core Facilities). R.S. is a recipient of research fellowships from the Manpei Suzuki Diabetes Foundation of Tokyo, Japan, and the Uehara Memorial Foundation, Japan.
Footnotes
Publisher's Disclaimer: This is a PDF file of an unedited manuscript that has been accepted for publication. As a service to our customers we are providing this early version of the manuscript. The manuscript will undergo copyediting, typesetting, and review of the resulting proof before it is published in its final citable form. Please note that during the production process errors may be discovered which could affect the content, and all legal disclaimers that apply to the journal pertain.
References
- Ali S, Stone MA, Peters JL, Davies MJ, Khunti K. The prevalence of co-morbid depression in adults with Type 2 diabetes: a systematic review and meta-analysis. Diabet Med. 2006;23:1165–1173. doi: 10.1111/j.1464-5491.2006.01943.x. [DOI] [PubMed] [Google Scholar]
- Arito M, Horiba T, Hachimura S, Inoue J, Sato R. Growth factor-induced phosphorylation of sterol regulatory element-binding proteins inhibits sumoylation, thereby stimulating the expression of their target genes, low density lipoprotein uptake, and lipid synthesis. J Biol Chem. 2008;283:15224–15231. doi: 10.1074/jbc.M800910200. [DOI] [PMC free article] [PubMed] [Google Scholar]
- Avruch J, Long X, Ortiz-Vega S, Rapley J, Papageorgiou A, Dai N. Amino acid regulation of TOR complex 1. Am J Physiol Endocrinol Metab. 2009;296:E592–602. doi: 10.1152/ajpendo.90645.2008. [DOI] [PMC free article] [PubMed] [Google Scholar]
- Bach C, Gilch S, Rost R, Greenwood AD, Horsch M, Hajj GN, Brodesser S, Facius A, Schadler S, Sandhoff K, Beckers J, Leib-Mosch C, Schatzl HM, Vorberg I. Prion-induced activation of cholesterogenic gene expression by Srebp2 in neuronal cells. J Biol Chem. 2009;284:31260–31269. doi: 10.1074/jbc.M109.004382. [DOI] [PMC free article] [PubMed] [Google Scholar]
- Banks WA, Jaspan JB, Huang W, Kastin AJ. Transport of insulin across the blood-brain barrier: saturability at euglycemic doses of insulin. Peptides. 1997;18:1423–1429. doi: 10.1016/s0196-9781(97)00231-3. [DOI] [PubMed] [Google Scholar]
- Barres BA. The mystery and magic of glia: a perspective on their roles in health and disease. Neuron. 2008;60:430–440. doi: 10.1016/j.neuron.2008.10.013. [DOI] [PubMed] [Google Scholar]
- Biessels GJ, Deary IJ, Ryan CM. Cognition and diabetes: a lifespan perspective. Lancet Neurol. 2008;7:184–190. doi: 10.1016/S1474-4422(08)70021-8. [DOI] [PubMed] [Google Scholar]
- Biessels GJ, Gispen WH. The impact of diabetes on cognition: what can be learned from rodent models? Neurobiol Aging. 2005;26(Suppl 1):36–41. doi: 10.1016/j.neurobiolaging.2005.08.015. [DOI] [PubMed] [Google Scholar]
- Björkhem I, Meaney S. Brain cholesterol: long secret life behind a barrier. Arterioscler Thromb Vasc Biol. 2004;24:806–815. doi: 10.1161/01.ATV.0000120374.59826.1b. [DOI] [PubMed] [Google Scholar]
- Borg WP, During MJ, Sherwin RS, Borg MA, Brines ML, Shulman GI. Ventromedial hypothalamic lesions in rats suppress counterregulatory responses to hypoglycemia. J Clin Invest. 1994;93:1677–1682. doi: 10.1172/JCI117150. [DOI] [PMC free article] [PubMed] [Google Scholar]
- Brüning JC, Gautam D, Burks DJ, Gillette J, Schubert M, Orban PC, Klein R, Krone W, Müller-Wieland D, Kahn CR. Role of brain insulin receptor in control of body weight and reproduction. Science. 2000;289:2122–2125. doi: 10.1126/science.289.5487.2122. [DOI] [PubMed] [Google Scholar]
- Chamberlain LH, Burgoyne RD, Gould GW. SNARE proteins are highly enriched in lipid rafts in PC12 cells: implications for the spatial control of exocytosis. Proc Natl Acad Sci U S A. 2001;98:5619–5624. doi: 10.1073/pnas.091502398. [DOI] [PMC free article] [PubMed] [Google Scholar]
- Chen TJ, Wang DC, Chen SS. Amyloid-beta interrupts the PI3K-Akt-mTOR signaling pathway that could be involved in brain-derived neurotrophic factor-induced Arc expression in rat cortical neurons. J Neurosci Res. 2009;87:2297–2307. doi: 10.1002/jnr.22057. [DOI] [PubMed] [Google Scholar]
- Craft S, Watson GS. Insulin and neurodegenerative disease: shared and specific mechanisms. Lancet Neurol. 2004;3:169–178. doi: 10.1016/S1474-4422(04)00681-7. [DOI] [PubMed] [Google Scholar]
- Cukierman T, Gerstein HC, Williamson JD. Cognitive decline and dementia in diabetes--systematic overview of prospective observational studies. Diabetologia. 2005;48:2460–2469. doi: 10.1007/s00125-005-0023-4. [DOI] [PubMed] [Google Scholar]
- Das P, Parsons AD, Scarborough J, Hoffman J, Wilson J, Thompson RN, Overton JM, Fadool DA. Electrophysiological and behavioral phenotype of insulin receptor defective mice. Physiol Behav. 2005;86:287–296. doi: 10.1016/j.physbeh.2005.08.024. [DOI] [PMC free article] [PubMed] [Google Scholar]
- Dietschy JM, Turley SD. Cholesterol metabolism in the brain. Curr Opin Lipidol. 2001;12:105–112. doi: 10.1097/00041433-200104000-00003. [DOI] [PubMed] [Google Scholar]
- Dietschy JM, Turley SD. Thematic review series: brain Lipids. Cholesterol metabolism in the central nervous system during early development and in the mature animal. J Lipid Res. 2004;45:1375–1397. doi: 10.1194/jlr.R400004-JLR200. [DOI] [PubMed] [Google Scholar]
- El-Husseini AE, Schnell E, Chetkovich DM, Nicoll RA, Bredt DS. PSD-95 involvement in maturation of excitatory synapses. Science. 2000;290:1364–1368. [PubMed] [Google Scholar]
- Evans MA, Golomb BA. Statin-associated adverse cognitive effects: survey results from 171 patients. Pharmacotherapy. 2009;29:800–811. doi: 10.1592/phco.29.7.800. [DOI] [PubMed] [Google Scholar]
- Francis GJ, Martinez JA, Liu WQ, Xu K, Ayer A, Fine J, Tuor UI, Glazner G, Hanson LR, Frey WH, 2nd, Toth C. Intranasal insulin prevents cognitive decline, cerebral atrophy and white matter changes in murine type I diabetic encephalopathy. Brain. 2008;131:3311–3334. doi: 10.1093/brain/awn288. [DOI] [PubMed] [Google Scholar]
- Hering H, Lin CC, Sheng M. Lipid rafts in the maintenance of synapses, dendritic spines, and surface AMPA receptor stability. J Neurosci. 2003;23:3262–3271. doi: 10.1523/JNEUROSCI.23-08-03262.2003. [DOI] [PMC free article] [PubMed] [Google Scholar]
- Horton JD, Goldstein JL, Brown MS. SREBPs: activators of the complete program of cholesterol and fatty acid synthesis in the liver. J Clin Invest. 2002;109:1125–1131. doi: 10.1172/JCI15593. [DOI] [PMC free article] [PubMed] [Google Scholar]
- Kim WY, Wang X, Wu Y, Doble BW, Patel S, Woodgett JR, Snider WD. GSK-3 is a master regulator of neural progenitor homeostasis. Nat Neurosci. 2009;12:1390–1397. doi: 10.1038/nn.2408. [DOI] [PMC free article] [PubMed] [Google Scholar]
- Kolomiytseva IK, Perepelkina NI, Zharikova AD, Popov VI. Membrane lipids and morphology of brain cortex synaptosomes isolated from hibernating Yakutian ground squirrel. Comp Biochem Physiol B Biochem Mol Biol. 2008;151:386–391. doi: 10.1016/j.cbpb.2008.08.001. [DOI] [PubMed] [Google Scholar]
- Korade Z, Kenworthy AK. Lipid rafts, cholesterol, and the brain. Neuropharmacology. 2008;55:1265–1273. doi: 10.1016/j.neuropharm.2008.02.019. [DOI] [PMC free article] [PubMed] [Google Scholar]
- Kotti TJ, Ramirez DM, Pfeiffer BE, Huber KM, Russell DW. Brain cholesterol turnover required for geranylgeraniol production and learning in mice. Proc Natl Acad Sci U S A. 2006;103:3869–3874. doi: 10.1073/pnas.0600316103. [DOI] [PMC free article] [PubMed] [Google Scholar]
- Lang T, Bruns D, Wenzel D, Riedel D, Holroyd P, Thiele C, Jahn R. SNAREs are concentrated in cholesterol-dependent clusters that define docking and fusion sites for exocytosis. EMBO J. 2001;20:2202–2213. doi: 10.1093/emboj/20.9.2202. [DOI] [PMC free article] [PubMed] [Google Scholar]
- Li S, Brown MS, Goldstein JL. Bifurcation of insulin signaling pathway in rat liver: mTORC1 required for stimulation of lipogenesis, but not inhibition of gluconeogenesis. Proc Natl Acad Sci U S A. 2010;107:3441–3446. doi: 10.1073/pnas.0914798107. [DOI] [PMC free article] [PubMed] [Google Scholar]
- Lucas JJ, Hernandez F, Gomez-Ramos P, Moran MA, Hen R, Avila J. Decreased nuclear beta-catenin, tau hyperphosphorylation and neurodegeneration in GSK-3beta conditional transgenic mice. EMBO J. 2001;20:27–39. doi: 10.1093/emboj/20.1.27. [DOI] [PMC free article] [PubMed] [Google Scholar]
- Marks DR, Tucker K, Cavallin MA, Mast TG, Fadool DA. Awake intranasal insulin delivery modifies protein complexes and alters memory, anxiety, and olfactory behaviors. J Neurosci. 2009;29:6734–6751. doi: 10.1523/JNEUROSCI.1350-09.2009. [DOI] [PMC free article] [PubMed] [Google Scholar]
- Mauch DH, Nagler K, Schumacher S, Goritz C, Muller EC, Otto A, Pfrieger FW. CNS synaptogenesis promoted by glia-derived cholesterol. Science. 2001;294:1354–1357. doi: 10.1126/science.294.5545.1354. [DOI] [PubMed] [Google Scholar]
- McDonald JG, Thompson BM, McCrum EC, Russell DW. Extraction and analysis of sterols in biological matrices by high performance liquid chromatography electrospray ionization mass spectrometry. Methods Enzymol. 2007;432:145–170. doi: 10.1016/S0076-6879(07)32006-5. [DOI] [PubMed] [Google Scholar]
- Mitter D, Reisinger C, Hinz B, Hollmann S, Yelamanchili SV, Treiber-Held S, Ohm TG, Herrmann A, Ahnert-Hilger G. The synaptophysin/synaptobrevin interaction critically depends on the cholesterol content. J Neurochem. 2003;84:35–42. doi: 10.1046/j.1471-4159.2003.01258.x. [DOI] [PubMed] [Google Scholar]
- Obici S, Rossetti L. Minireview: nutrient sensing and the regulation of insulin action and energy balance. Endocrinology. 2003;144:5172–5178. doi: 10.1210/en.2003-0999. [DOI] [PubMed] [Google Scholar]
- Okabe S, Kim HD, Miwa A, Kuriu T, Okado H. Continual remodeling of postsynaptic density and its regulation by synaptic activity. Nat Neurosci. 1999;2:804–811. doi: 10.1038/12175. [DOI] [PubMed] [Google Scholar]
- Pfrieger FW. Outsourcing in the brain: do neurons depend on cholesterol delivery by astrocytes? Bioessays. 2003;25:72–78. doi: 10.1002/bies.10195. [DOI] [PubMed] [Google Scholar]
- Porstmann T, Santos CR, Griffiths B, Cully M, Wu M, Leevers S, Griffiths JR, Chung YL, Schulze A. SREBP activity is regulated by mTORC1 and contributes to Akt-dependent cell growth. Cell Metab. 2008;8:224–236. doi: 10.1016/j.cmet.2008.07.007. [DOI] [PMC free article] [PubMed] [Google Scholar]
- Puglielli L, Tanzi RE, Kovacs DM. Alzheimer’s disease: the cholesterol connection. Nat Neurosci. 2003;6:345–351. doi: 10.1038/nn0403-345. [DOI] [PubMed] [Google Scholar]
- Reiss AB, Siller KA, Rahman MM, Chan ES, Ghiso J, de Leon MJ. Cholesterol in neurologic disorders of the elderly: stroke and Alzheimer’s disease. Neurobiol Aging. 2004;25:977–989. doi: 10.1016/j.neurobiolaging.2003.11.009. [DOI] [PubMed] [Google Scholar]
- Rohrbough J, Broadie K. Lipid regulation of the synaptic vesicle cycle. Nat Rev Neurosci. 2005;6:139–150. doi: 10.1038/nrn1608. [DOI] [PubMed] [Google Scholar]
- Rossetti L, Smith D, Shulman GI, Papachristou D, DeFronzo RA. Correction of hyperglycemia with phlorizin normalizes tissue sensitivity to insulin in diabetic rats. J Clin Invest. 1987;79:1510–1515. doi: 10.1172/JCI112981. [DOI] [PMC free article] [PubMed] [Google Scholar]
- Russell DW, Halford RW, Ramirez DM, Shah R, Kotti T. Cholesterol 24-hydroxylase: an enzyme of cholesterol turnover in the brain. Annu Rev Biochem. 2009;78:1017–1040. doi: 10.1146/annurev.biochem.78.072407.103859. [DOI] [PMC free article] [PubMed] [Google Scholar]
- Schubert M, Gautam D, Surjo D, Ueki K, Baudler S, Schubert D, Kondo T, Alber J, Galldiks N, Kustermann E, Arndt S, Jacobs AH, Krone W, Kahn CR, Bruning JC. Role for neuronal insulin resistance in neurodegenerative diseases. Proc Natl Acad Sci U S A. 2004;101:3100–3105. doi: 10.1073/pnas.0308724101. [DOI] [PMC free article] [PubMed] [Google Scholar]
- Shobab LA, Hsiung GY, Feldman HH. Cholesterol in Alzheimer’s disease. Lancet Neurol. 2005;4:841–852. doi: 10.1016/S1474-4422(05)70248-9. [DOI] [PubMed] [Google Scholar]
- Stefani M, Liguri G. Cholesterol in Alzheimer’s disease: unresolved questions. Curr Alzheimer Res. 2009;6:15–29. doi: 10.2174/156720509787313899. [DOI] [PubMed] [Google Scholar]
- Suzuki S, Kiyosue K, Hazama S, Ogura A, Kashihara M, Hara T, Koshimizu H, Kojima M. Brain-derived neurotrophic factor regulates cholesterol metabolism for synapse development. J Neurosci. 2007;27:6417–6427. doi: 10.1523/JNEUROSCI.0690-07.2007. [DOI] [PMC free article] [PubMed] [Google Scholar]
- Taniguchi CM, Kondo T, Sajan M, Luo J, Bronson R, Asano T, Farese R, Cantley LC, Kahn CR. Divergent regulation of hepatic glucose and lipid metabolism by phosphoinositide 3-kinase via Akt and PKClambda/zeta. Cell Metab. 2006;3:343–353. doi: 10.1016/j.cmet.2006.04.005. [DOI] [PubMed] [Google Scholar]
- Thiele C, Hannah MJ, Fahrenholz F, Huttner WB. Cholesterol binds to synaptophysin and is required for biogenesis of synaptic vesicles. Nat Cell Biol. 2000;2:42–49. doi: 10.1038/71366. [DOI] [PubMed] [Google Scholar]
- Tong Q, Ye C, McCrimmon RJ, Dhillon H, Choi B, Kramer MD, Yu J, Yang Z, Christiansen LM, Lee CE, Choi CS, Zigman JM, Shulman GI, Sherwin RS, Elmquist JK, Lowell BB. Synaptic glutamate release by ventromedial hypothalamic neurons is part of the neurocircuitry that prevents hypoglycemia. Cell Metab. 2007;5:383–393. doi: 10.1016/j.cmet.2007.04.001. [DOI] [PMC free article] [PubMed] [Google Scholar]
- Trompet S, van Vliet P, de Craen AJ, Jolles J, Buckley BM, Murphy MB, Ford I, Macfarlane PW, Sattar N, Packard CJ, Stott DJ, Shepherd J, Bollen EL, Blauw GJ, Jukema JW, Westendorp RG. Pravastatin and cognitive function in the elderly. Results of the PROSPER study. J Neurol. 2010;257:85–90. doi: 10.1007/s00415-009-5271-7. [DOI] [PubMed] [Google Scholar]
- Trudeau F, Gagnon S, Massicotte G. Hippocampal synaptic plasticity and glutamate receptor regulation: influences of diabetes mellitus. Eur J Pharmacol. 2004;490:177–186. doi: 10.1016/j.ejphar.2004.02.055. [DOI] [PubMed] [Google Scholar]
- Tuccori M, Lapi F, Testi A, Coli D, Moretti U, Vannacci A, Motola D, Salvo F, Rivolta AL, Blandizzi C, Mugelli A, Del Tacca M. Statin-associated psychiatric adverse events: a case/non-case evaluation of an Italian database of spontaneous adverse drug reaction reporting. Drug Saf. 2008;31:1115–1123. doi: 10.2165/0002018-200831120-00007. [DOI] [PubMed] [Google Scholar]
- Uchida T, Nakamura T, Hashimoto N, Matsuda T, Kotani K, Sakaue H, Kido Y, Hayashi Y, Nakayama KI, White MF, Kasuga M. Deletion of Cdkn1b ameliorates hyperglycemia by maintaining compensatory hyperinsulinemia in diabetic mice. Nat Med. 2005;11:175–182. doi: 10.1038/nm1187. [DOI] [PubMed] [Google Scholar]
- Valenza M, Rigamonti D, Goffredo D, Zuccato C, Fenu S, Jamot L, Strand A, Tarditi A, Woodman B, Racchi M, Mariotti C, Di Donato S, Corsini A, Bates G, Pruss R, Olson JM, Sipione S, Tartari M, Cattaneo E. Dysfunction of the cholesterol biosynthetic pathway in Huntington’s disease. J Neurosci. 2005;25:9932–9939. doi: 10.1523/JNEUROSCI.3355-05.2005. [DOI] [PMC free article] [PubMed] [Google Scholar]
- Xia Y, Wang CZ, Liu J, Anastasio NC, Johnson KM. Brain-derived neurotrophic factor prevents phencyclidine-induced apoptosis in developing brain by parallel activation of both the ERK and PI-3K/Akt pathways. Neuropharmacology. 2010;58:330–336. doi: 10.1016/j.neuropharm.2009.10.009. [DOI] [PMC free article] [PubMed] [Google Scholar]
- Xie X, Liao H, Dang H, Pang W, Guan Y, Wang X, Shyy JY, Zhu Y, Sladek FM. Down-regulation of hepatic HNF4alpha gene expression during hyperinsulinemia via SREBPs. Mol Endocrinol. 2009;23:434–443. doi: 10.1210/me.2007-0531. [DOI] [PMC free article] [PubMed] [Google Scholar]
- Xiong GL, Benson A, Doraiswamy PM. Statins and cognition: what can we learn from existing randomized trials? CNS Spectr. 2005;10:867–874. doi: 10.1017/s1092852900019817. [DOI] [PubMed] [Google Scholar]
Associated Data
This section collects any data citations, data availability statements, or supplementary materials included in this article.