Abstract
The mechanical properties of soft tissues depend on the collagen fiber network and the surrounding non-fibrillar matrix. The mechanical role of non-fibrillar material remains poorly understood. Our recent study (Lake and Barocas, 2011) introduced collagen-agarose co-gels as a simple experimental model system to evaluate the mechanical contribution of non-fibrillar matrix, and evaluated co-gel properties in uniaxial tension. In this study, we utilized similar co-gels to examine collagen-matrix interaction in tissues subjected to incremental stress-relaxation indentation tests. Mechanical testing was performed using two orthogonal custom test devices and polarized light imaging was used to quantify 3D collagen fiber kinematics under load. The addition of agarose led to concentration-dependent changes in the time-dependent mechanical response and magnitude/spread of collagen fiber reorganization of tissue analogs. Specifically, peak/relaxed loads increased, and relaxation rate decreased, with increasing agarose concentration. In addition, increasing agarose content led to larger magnitude changes in orientation direction and alignment strength that were more localized near the indenter. Results suggest that non-fibrillar material significantly contributes to the behavior of co-gels in indentation, likely by reducing permeability and resisting volume change, thereby providing insight into the properties of artificial and native tissues subjected to non-tensile loading.
Keywords: co-gel model, indentation, non-fibrillar matrix, collagen gel, agarose
INTRODUCTION
Connective soft tissues have complex mechanical properties that depend on the constituent collagen fiber network and the surrounding non-fibrillar matrix. The mechanical role of non-fibrillar material and the nature of its interactions with the collagen network, which have important implications for understanding tissue behavior in health and disease, remain poorly understood. Inadequate mechanical characterization of the non-fibrillar matrix is due, in part, to the lack of a simple experimental model system with which to explore and characterize these properties and relationships.
Our group and others have used reconstituted type I collagen gels to probe general properties of soft tissues and evaluate relationships between microstructural characteristics and corresponding macroscale properties.e.g.,1-5 Collagen gels serve as valuable tissue analogs because their properties can be easily modified during fabrication, but they are limited by the lack of non-fibrillar components (e.g., proteoglycans, glycosaminoglycans, glycoproteins, minor collagens, cells, etc.) that are present in native tissues. A recent study6 reported greatly increased storage modulus in shear for collagen gels with low quantities of agarose added during formation, with minimal concomitant changes to the architecture of the collagen fiber network. Extending this idea, we recently suggested7 that a collagen-agarose co-gel could enable us to explore the mechanical role of non-fibrillar matrix and could serve as a model system for evaluating fiber-matrix interactions in soft tissues. In our previous study,7 we characterized the concentration-dependent properties of collagen-agarose co-gels subjected to uniaxial tensile testing. Specifically, the addition of agarose altered the elastic/viscoelastic mechanical properties, reorganization of the microstructural network, and lateral contraction of tensile-loaded soft tissue analogs. These mechanical and structural changes occurred as a function of non-fibrillar matrix (agarose) content, even though the dominant load-supporting mechanism of fiber-reinforced soft tissues under tension is generally assumed to be collagen, thereby demonstrating that non-fibrillar material can significantly affect the mechanical behavior of soft tissues.
In addition to tensile loading, many collagenous soft tissues are also subjected to more complex, non-tensile physiologic loads. Within orthopaedic tissues, for example, articular cartilage supports primarily compressive load during normal tissue function, while meniscus and intervertebral discs (IVD) experience a combination of compression, shear, and tensile forces in vivo.e.g.,8-10 In addition, some tissues that are generally assumed to be loaded only in tension can be subjected to non-tensile physiologic forces. For example, the rotator cuff tendons in the shoulder likely experience compression, shear, and transverse tensile loading due to interactions with neighboring anatomy, and many tendons and ligaments are subjected to compressive loads as they bend around bones to aid in joint motion (e.g., flexor tendons). Tissue composition in these areas of non-tensile loading becomes altered,11-14 developing compositional content more similar to compression-loaded tissues such as cartilage, meniscus, and IVD (e.g., increased proteoglycan and glycosaminoglycan). Thus, in these tissues non-fibrillar matrix increases in response to, and appears to be critical in the mechanical support of, complex loads. The specific mechanical role of non-fibrillar matrix in such an environment, however, remains unclear. The collagen-agarose co-gel model presents an ideal opportunity to explore the properties of, and interactions between, fiber and matrix tissue constituents, particularly in a non-tensile loading condition. Therefore, the objective of this study was to evaluate the mechanical and structural properties of collagen-agarose co-gels under indentation to understand better the nature of, and relationships between, the collagen fiber network and non-fibrillar matrix of simplified tissue analogs.
METHODS
Sample preparation
Collagen-agarose co-gels were prepared using a protocol from our previous study,7 which was adapted from Ulrich et. al.6 A stock 1.5 mg/mL collagen solution was prepared by combining appropriate volumes of 2.2 mg/mL bovine dermal collagen (Organogenesis, Canton, MA), 1M 4-(2-hydroxyethyl)-1-piperazineethanesulfonic acid (HEPES, Cellgro, Manassas, VA), 10X Modified Eagle's Medium (MEM, Sigma-Aldrich, St. Louis, MO), 0.1M NaOH (Sigma), and fetal bovine serum (HyClone, Logan, UT). A stock 2% w/v agarose solution was prepared by dissolving low-melting-point agarose powder (A9414, Sigma) in Dulbecco's Modification of Eagle's Medium (DMEM, Cellgro). Collagen and agarose stock solutions were combined with additional DMEM to yield gel solutions containing 1.0 mg/ml collagen and 0% (NoAg), 0.125% (LoAg), or 0.25% (HiAg) w/v agarose. Gels were cast in rectangular Teflon molds (31×8×5mm) with glass rods at each end attached to Teflon pins to enable loading of samples onto the mechanical test setup after gelation.5 Solution-filled molds were kept at 4°C for 4 minutes to initiate agarose gelation, transferred to 37°C for 30 minutes to promote collagen self-assembly, and then stored at 4°C until mechanical testing.
Indentation testing
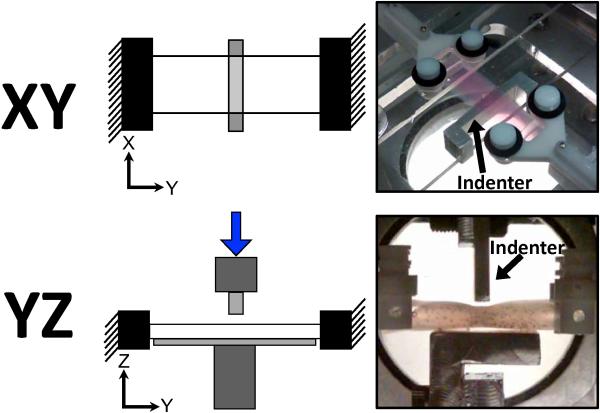
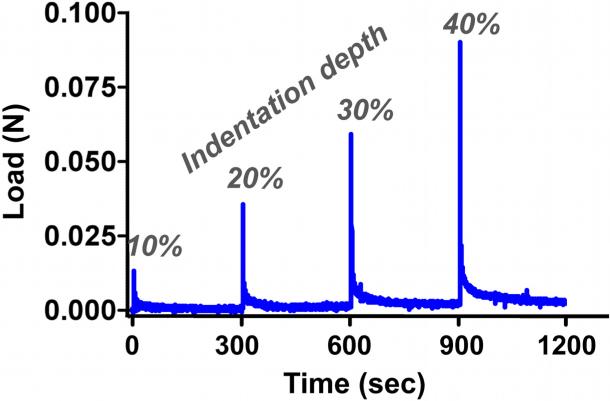
Samples were placed in a water bath at room temperature and loaded in one of two custom-built indentation test systems (Figure 1) integrated with an Instron biaxial test machine (Instron, Norwood, MA). In both test setups, the Y-axis was defined along the long axis of the sample, and two grips kept the y-length constant throughout testing. The X-axis was along the width of the sample, which was a free surface during testing. The Z-axis was along the thickness of the samples, and was the direction in which indentation was applied. In the XY test setup, samples were positioned so that digital images from quantitative polarized light imaging (QPLI),15 which quantifies direction and strength of collagen fiber alignment, could be captured along the length-width sample plane (Figure 1, top). In this configuration, a clear Plexiglas™ support brace was brought into contact with the top surface of the samples, and loading was administered by raising an indentation bar (attached to a Plexiglas™ plate) into the bottom surface of the samples according to the loading protocol (described below). In the YZ test setup, samples were rotated 90° about the Y-axis and images captured along the length-thickness sample plane (Figure 1, bottom). In this configuration, a vertical indentation bar and support brace were attached to grips along the perpendicular axis of the biaxial device. The loading protocol, in both cases, consisted of a uniaxial pre-strain of 6.25%, followed by four incremental stress-relaxation indentation steps of 10% of the sample thickness (up to 40% maximum indentation) at 10%/second, interspersed with 300-second relaxation intervals (Figure 3). QPLI image sets were captured after application of the pre-strain (zero indentation) and immediately after each indentation step (10, 20, 30 and 40%). Importantly, the same loading regime was applied to the test samples in both the XY and YZ indentation setups. Specifically, indenter shape, indenter dimensions, axis of applied load (relative to the sample), indentation depths, displacement rates, and hold times were the same in both XY/YZ testing. The only difference in the two setups is that, relative to the XY configuration, the sample, grips, and indenter are rotated 90° about the long axis of the sample for the YZ configuration, such that fiber alignment data can be captured in the length-thickness plane rather than the length-width plane. For each test configuration (XY and YZ) and gel composition (NoAg, LoAg, HiAg), at least eight samples were tested (i.e., n≥8).
Figure 1.
Schematics (left) and photos (right) of test configurations for XY (top) and YZ (bottom) indentation testing (indenter moves in the Z-direction)
Figure 3.
Typical indentation load-time curve with indentation depths indicated
Data analysis
Peak and relaxed loads for each indentation step were determined for each sample and averaged by group. Indentation stresses were computed by dividing peak load values by the area of sample-indenter contact (8 mm × 2.35 mm = 18.8 mm2) and were then plotted against indentation strain values at each step. Indentation modulus was then computed, using linear regression, as the slope of the last three points (20-40% indentation displacement) of the stress-strain curves. Reduced relaxation curves were created at each indentation step by plotting load values (normalized by peak load) at nine equally spaced points on a log time scale (from 0-300 seconds). Average relaxation curves for each gel type (at each indentation step) were compared, and the dependence of relaxation behavior on indentation depth was evaluated by comparing relaxation curves for all indentation steps within each gel composition (e.g., NoAg).
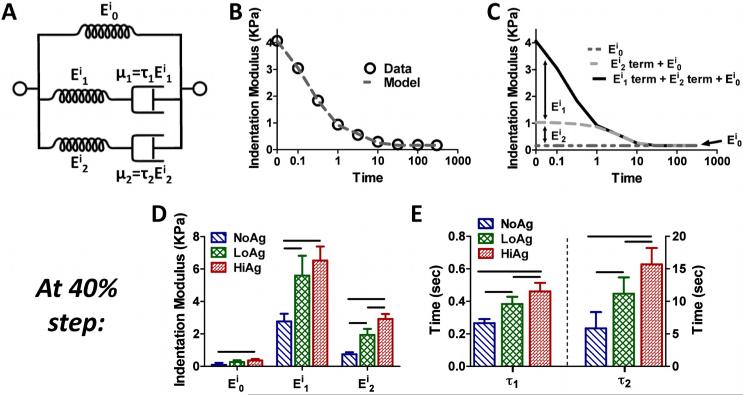
In order to quantify the relative contributions of the elastic and viscous components of the overall viscoelastic response, the relaxation data at each displacement step were fit to a two-relaxation-time solid linear model, as done previously7 for collagen-agarose co-gels in tension. This simple viscoelastic model consists of a spring in parallel with two Maxwell elements (spring in series with a dashpot) and is described mathematically as:
where Eij are indentation modulus values, τj are relaxation time constants, μj are viscosity coefficients, and t is relaxation time (0-300 seconds for each step). For each sample, at each indentation step, stress values were divided by indentation strain to compute Eitotal, which was then fit to the model equation using least squares minimization.
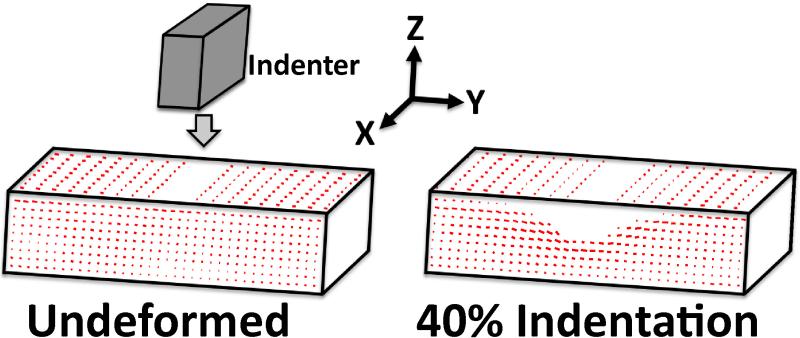
Two-dimensional fiber alignment maps were calculated for each sample at each indentation step, where pixel-wise angle and retardation values indicate the average direction and strength of collagen fiber alignment, respectively (Figure 2). QPLI parameter values were averaged across a superimposed grid (15×35 for XY; 35×10 for YZ), and 2D “difference” maps were computed for each sample by subtracting pre-strain angle/retardation values from corresponding values at each indentation step. Average XY and YZ difference maps were computed for each gel composition, and 3D difference maps were constructed by projecting average 2D maps onto orthogonal surfaces of a rectangular hexahedron.
Figure 2.
Alignment maps for one NoAg sample in the undeformed state (left) and under 40% indentation (right); lines indicate average collagen fiber orientation, where line length corresponds to strength of alignment
Statistical analysis
All mechanical test data were grouped by gel type (NoAg, LoAg, and HiAg) and plotted as mean values ± 95% confidence intervals. Peak and relaxed loads were evaluated using repeated measures two-way ANOVAs with Bonferroni post-tests. At each indentation step, normalized load values during relaxation and parameters of the two-relaxation-time solid linear model were compared across gel types using one-way ANOVA followed by post-hoc t-tests and Bonferroni corrections. For all statistical analyses, significance was set at p<0.05.
RESULTS
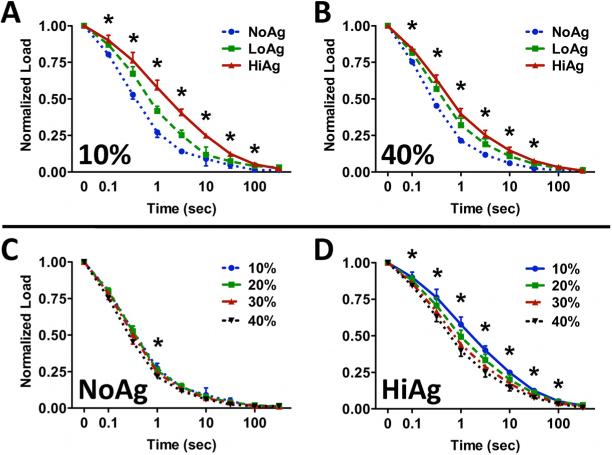
As demonstrated by a representative load-time curve (Figure 3), peak loads increased at each successive indentation step, followed by near complete relaxation to pre-strain levels. Both peak (Figure 4A) and relaxed (Figure 4B) loads increased significantly with increasing indentation step (p<0.0001) and increasing agarose concentration (p<0.0001), with NoAg and LoAg samples exhibiting load values approximately 25% and 75% of the HiAg values, respectively. At each indentation step, the rate of stress-relaxation decreased monotonically for increasing agarose, with significant differences between sample types evident throughout relaxation (Figure 5). At 10% indentation, the average time to reach 0.25 normalized load was 1.35 s and 9.96 s for NoAg and HiAg, respectively (Figure 5A), and at 40% indentation the times were 0.90 s and 3.19 s, respectively (Figure 5B). The relaxation behavior of NoAg was independent of indentation depth (Figure 5C), while the rate of relaxation for HiAg samples increased significantly with indentation depth (Figure 5D). There were no significant differences between gel types in the amount of total relaxation achieved (last data point on each relaxation curve). It should be noted that load values are reported only for YZ tests because XY load data exhibited some noise artifact resulting from physical elevation of the indentation platform; the same loading protocol was used for both test configurations, so YZ load data could be assumed to be representative of the mechanical response of samples in both XY and YZ testing.
Figure 4.
Average (A) peak and (B) relaxed loads increased significantly with increasing agarose concentration at each indentation depth; (C) peak indentation modulus also increased with agarose concentration (mean ± 95%CI; n=8/group; * and horizontal bars for p ≤ 0.05)
Figure 5.
(A, B) Relaxation curves under indentation demonstrate decreased relaxation rate with increasing agarose concentration, with differences between groups becoming less pronounced with increasing indentation depth; (C) NoAg samples do not exhibit a relaxation rate dependence on indentation depth, which is apparent for (D) HiAg samples (mean ± 95%CI; n=8/group, * for p ≤ 0.05)
The two-relaxation-time constant linear solid model (Figure 6A) provided excellent fits to experimental data (e.g., Figure 6B). In this formulation, Ei0 represents the indentation modulus at the end of the relaxation period, Ei1 and τ1 correspond to early behavior (~0.5 s), and Ei2 and τ2 describe the late-time (~10 s) response (Figure 6C). Each of the five model parameters increased with increasing agarose concentration: while there were only moderate increases in Ei0 across sample types, Ei1 and Ei2 values increased significantly from NoAg to LoAg to HiAg (e.g., at 40% indentation; Figure 6D). This was also true for the relaxation time constants, τ1 and τ2, which both increased significantly with agarose concentration (e.g., at 40% indentation; Figure 6E).
Figure 6.
(A) Schematic representing the two-relaxation-time solid linear model (Eij = elastic moduli; μj = material coefficients of viscosity; τj = relaxation time constants); (B) example model fit to experimental indentation modulus values; (C) evaluation of the data in (B) shows the relative contribution of each term of the solid linear model to the overall time-dependent Eitotal, specifically, the relaxed (Ei0), early-time (Ei1 term), and late-time (Ei2 term) components; both (D) elastic moduli and (E) relaxation time constants (shown at 40% displacement) increased with increasing agarose concentration (mean ± 95%CI; n=6-8/group; horizontal bar=significant differences)
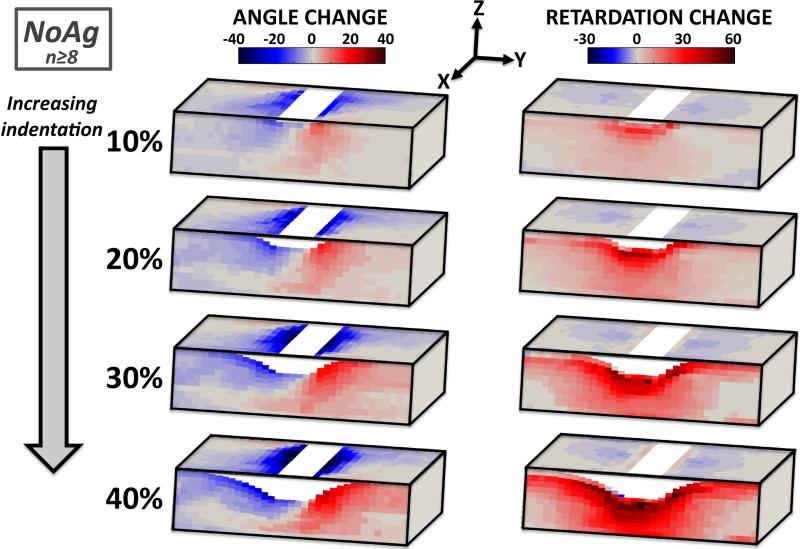
Three-dimensional collagen fiber difference maps show the progression of angle and retardation changes (corresponding with changes in orientation and strength of alignment, respectively) with increasing indentation (e.g., NoAg, Figure 7). In these maps, gray represents areas of no change (relative to the pre-strain values), while blue and red correspond to areas of negative and positive value changes, respectively. Under increasing indentation, fibers rotated away from the indenter in the XY plane and became oriented along the surface boundary of the deforming sample in the YZ plane (Figure 7, left column). In terms of retardation change, NoAg samples became less aligned in the XY plane under increasing indentation, but much more strongly aligned in the YZ plane (Figure 7, right column).
Figure 7.
Average angle (left) and retardation (right) difference maps for NoAg samples show dramatic changes with increasing indentation; fibers rotate away from the indenter towards the Z-direction, becoming much more highly aligned in the YZ plane (gray=no change from undeformed)
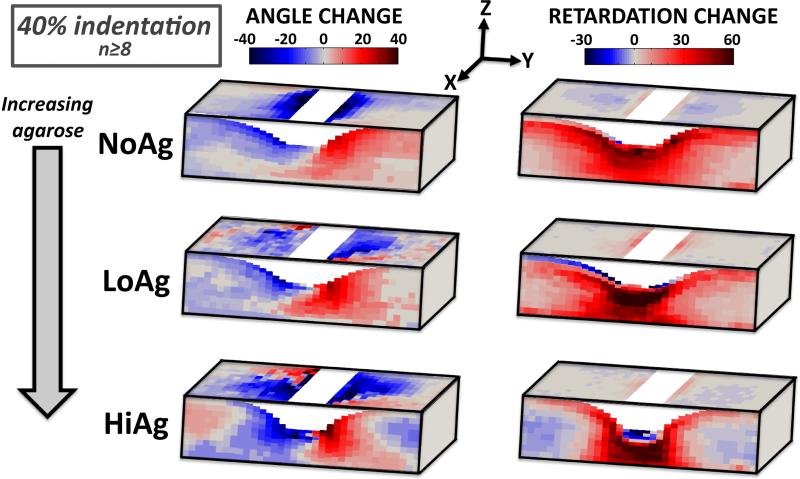
In order to assess the effect of agarose concentration on microstructural reorganization, 3D difference maps were compared across the three gel types (e.g., at 40% indentation, Figure 8), where some clear and striking differences were apparent. For angle and retardation values, the magnitude of changes (i.e., intensity of color in the difference maps) in the YZ plane increased with increasing agarose content. In addition, the spread of changes (along the sample length in the y-direction) decreased with increasing agarose, such that angle/retardation change for the HiAg samples was more localized to regions near the indenter as compared to LoAg and NoAg samples. In fact, this observation was confirmed quantitatively by calculating the relative y-direction length (measured in grid units) that contained 50% of the total angle/retardation change; the size of the affected region significantly decreased with increasing agarose concentration. Specifically, the average length of the affected region for NoAg samples (~1/3 of total sample length) decreased by ~6% for LoAg samples, and by an additional ~6% for HiAg samples, confirming that agarose led to changes that were more concentrated near the indenter. Finally, there were large changes in orientation angle in the XY plane for all three groups, but the effect of changes in this plane was muted by very low retardation values. In other words, the weak XY alignment suggests that angle changes in this plane are likely to have less mechanical relevance than the YZ plane, where measured angle changes correspond with increasingly strong alignment. Taken together, these results demonstrate that the addition of agarose resulted in increased magnitude of changes to the microstructural organization that were more focused and localized to regions near the indenter.
Figure 8.
Average angle (left) and retardation (right) difference maps at 40% indentation demonstrate altered fiber kinematics with increasing agarose; changes in orientation angle and strength of alignment are more localized in regions near the indenter for LoAg, and especially HiAg (gray=no change from undeformed)
DISCUSSION
As shown previously via scanning electron microscopy,6,7 agarose added to type I collagen gels forms a fine web-like matrix, which is interspersed among the collagen fibers. Agarose does not appear to alter the formation or structural topology of the collagen network, nor does the self-assembly of collagen fibers appear to disrupt agarose gelation, as indicated by a comparison of co-gel images and images of collagen- and agarose-only gels.7 Thus, agarose served as a model non-fibrillar matrix component, by which we could examine the contribution of non-fibrillar matrix to tissue properties under indentation.
The addition of agarose resulted in significant differences in the mechanical and structural properties of co-gels (Table 1). Increased peak and relaxed loads for LoAg, and to a larger extent HiAg, show that the agarose matrix that formed around the collagen network increased resistance to indentation load (Figure 4A-B). Relaxation behavior was also different between groups, with slower relaxation rates for increasing agarose concentration (Figure 5). These differences can be interpreted in the context of the well-established biphasic theories for hydrated tissues.e.g.,16-18 Within that conceptual framework, one can view the collagen-agarose co-gel as a three-component mixture of collagen, agarose, and water. The agarose attracts water, which provides greater resistance to compression at equilibrium, consistent with the lower Poisson's ratios observed for HiAg gels in uniaxial tension in our previous study.7 In addition, the smaller pore size of the agarose network leads to lower water permeability, which in turn slows the relaxation of the material by increasing the time required for water to be squeezed out. Further insight into the relaxation behavior of the co-gels can be obtained by examining the parameters from the two-relaxation-time solid linear model (Figure 6). Very small Ei0 values imply a high degree of total relaxation for each gel type, although there was some dependence on composition, where increasing agarose content led to decreased total relaxation (similar to what can be inferred by jointly considering Figures 4A and 4B). Very large Ei1 values indicate that most of the relaxation of the indentation modulus occurred in the early period (~0.3-0.5 s), with a smaller portion (corresponding to smaller Ei2 values) relaxing at later times (~5-15 s). Approximately an order of magnitude separated the two time constants (τ1 and τ2), showing two distinct relaxation behaviors. Finally, each of the indentation moduli and both relaxation time constants increased with increasing agarose content, demonstrating agarose-induced changes to the indentation response (i.e., greater loads and decreased relaxation rate) that were consistent across time-scales. As mentioned earlier, such a response may be due to decreased permeability and increased resistance to volume change that occurs when incorporating agarose in the co-gels.
Table 1.
Summary of mechanical and organizational changes that occur as agarose content increases from 0% (NoAg) to 0.25% (HiAg) for samples subjected to indentation (current study) and to uniaxial tension7; key similarities and differences described in text
| QPLI | Load | Relaxation | Compressibility | |||||
|---|---|---|---|---|---|---|---|---|
| ΔAngle | ΔRetard. | Peak | Relax | Rate | % | ΔVolume | Poisson's | |
| Indentation | ↑ magnitude ↓ spread |
↑ magnitude ↓ spread |
↑ | ↑ | ↓ | ← → | ↓ | NA |
| Tension | ←→ magnitude |
↓ magnitude | ↓ | ↑ | ↓ | ↓ | NA | ↓ |
Another aspect of the stress-relaxation data was the difference in indentation depth dependence. Specifically, the profile of the reduced relaxation curves for NoAg was the same whether at low (e.g., 10%) or high (e.g., 40%) levels of indentation (Figure 5C). For HiAg samples, in contrast, relaxation rate increased with increasing indentation depth (Figure 5D). Such rate dependence, which may be due to nonlinear permeability at high solid volume fraction in co-gels, merits further investigation.
This study applied polarized light imaging (combined with two custom indentation devices; Figure 1) to quantify 3D collagen fiber alignment (e.g., Figure 2) and track fiber kinematics of samples under load (e.g., Figure 7). While other techniques, such as diffusion tensor magnetic resonance imaging,19,20 have been used to quantify 3D collagen fiber organization in loaded soft tissues, our polarized light technique (which was previously validated21,22) allows fast data acquisition, alignment analysis over the entire time course of an experiment, and requires a relatively simple and inexpensive experimental setup. On the other hand, our approach is not suitable for all tissues since it requires samples of appropriate dimensions and density to allow for transmittance of polarized light, as well as two nominally identical samples to be subjected to each of the two orthogonal test setups. In evaluating co-gels in this study, it was assumed that QPLI measured only the collagen fiber network. It is possible that the presence of agarose in the co-gels may have interfered with angle and retardation measurements, but preliminary evaluation of the optical properties (i.e., birefringence) of 0.25% w/v agarose-only gels in tensile tests yielded very low retardation values that increased negligibly as a function of strain (~5° retardation for agarose-only vs. ~30° for a similarly loaded collagen-only gel at 10% tensile strain).
In this study, results from the polarized light analysis demonstrated complex 3D fiber kinematics under indentation (Figure 7). As the indentation depth increased, collagen fibers rotated away from the indenter and into the Z-direction along the sample boundary, simultaneously decreasing alignment in the XY plane but increasing alignment in the YZ plane. The amount of fiber rotation and concomitant changes in strength of alignment increased as a function of indentation depth, with changes at 40% indentation affecting nearly the entire sample volume. All samples were nearly isotropic prior to testing (not shown), however the small tensile pre-load applied to each sample prior to indentation did cause some longitudinal fiber alignment prior to testing. Thus, the negative retardation change in the XY plane indicates a return towards isotropy in this plane. Also, a small area of increased retardation near the indenter in the XY plane is visible in the difference maps at higher indentation (Figure 7, left), corresponding to fibers that became more aligned in a direction parallel to the indenter.
Besides tracking fiber kinematics as a function of indentation depth, the polarized light dataset in this study also demonstrated differences in fiber organization between the different gel formulations (NoAg, LoAg, HiAg; Figure 8). Increased agarose content led to greater magnitudes of change in angle/retardation values, which were also more focused in areas near the indenter. Specifically, the NoAg samples exhibited moderate angle and retardation changes that spanned nearly the full sample length, while the HiAg samples exhibited more dramatic changes that were restricted to areas more immediate to the indenter. In addition, for HiAg samples, angle changes were observed far from the indenter, but these changes were muted by decreased retardation in these areas. Thus, agarose has a strong, but localized effect on collagen fiber reorganization under indentation, perhaps due to a restriction on relative collagen fiber movement caused by the interfusing agarose matrix, which limits the distance over which the applied load affects the microstructure. Differences in microstructural reorganization may also be caused, at least in part, by the resistance to volume change that occurs with the presence of agarose.
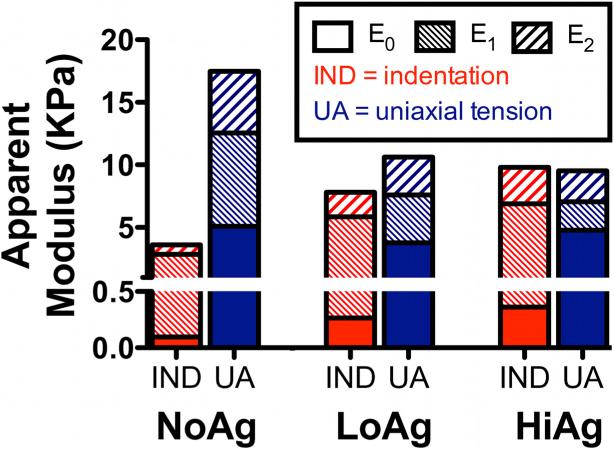
Previously, we evaluated collagen-agarose co-gels as a model for non-fibrillar matrix in dog-bone shaped samples subjected to incremental stress-relaxation tests in uniaxial tension.7 The current study subjected rectangular samples with the same composition to incremental stress-relaxation tests in indentation. A comparison of summarized results from both studies offers some interesting similarities and differences (presented as changes that occur with increasing agarose concentration; Table 1). In both cases, the introduction of agarose led to slower relaxation rates (and in the case of tensile tests, decreased relaxation %) and, as mentioned previously, an increased resistance to volume changes. While trends for relaxed load were the same for both test types (increased with increasing agarose), peak loads increased with agarose under indentation and decreased in extension. This contrasting response may be due to differences in collagen network reorientation between the two test types, as measured via QPLI data (Table 1, first column): under tension, agarose limited the ability of the collagen fibers to reorient towards the direction of loading, resulting in a less strongly aligned fiber population (decreased magnitude of retardation change) that was less able to sustain load. Contrastingly, in indentation agarose centralized the area of tissue affected by the imposed load, resulting in increased fiber alignment near the indenter (increased magnitude of retardation change) that was better able to sustain load. Another possibility is that pressurization of interstitial water during the peak loading creates a negative contribution to the total normal stress, which would tend to reduce the total measured force in extension but increase the total measured force in indentation. Additional insight regarding the multiaxial viscoelastic co-gel properties is offered by comparing the model parameters for indentation and uniaxial tensile testing. In particular, indentation modulus values were compared to the apparent modulus values from tensile tests, including the relative contributions of each component (E0 = equilibrium, E1 = early-time, E2 = late-time) to the total modulus (Figure 9). Due to differences in how these moduli were computed, a direct comparison of the magnitude of indentation moduli to tensile moduli is not justified. However, comparing the concentration-dependent effects due to agarose and the relative contribution of each component of the model offers insight into multiaxial properties of these gels. For example, as agarose concentration increases (left to right in Figure 9), indentation modulus increases, but tensile modulus decreases, demonstrating dramatic differences in how non-fibrillar matrix affects the response to different loading regimes. The E0 (equilibrium) component increases with agarose in indentation but not tension, suggesting that the equilibrium properties in indentation result from the volume preserving agarose, while tensile equilibrium is largely due to the collagen.
Figure 9.
Comparison of average modulus values from indentation testing (IND) and uniaxial tension (UA; published previously7) at the maximum displacement step (40% IND depth; 20% UA displacement), including relative contributions of each component of the total apparent modulus (E0 = equilibrium, E1 = early-time, E2 = late-time); several interesting observations can be made in comparing results among two different test modalities and across different sample compositions (see text for a more detailed discussion)
In terms of applying the results of this study to consider properties of native tissues, one example would be an analogy between the collagen-agarose co-gel and transversely-loaded tendons and ligaments. Tendons support primarily tensile loads, but many (e.g., rotator cuff tendons, flexor tendons) are also subjected to compression/indentation-type loading as they interact with neighboring anatomy or pass over bones. Tendon tissues that experience large transverse compressive loads contain increased amounts of non-fibrillar material (i.e., proteoglycan (PG) and glycosaminoglycan (GAG)) and tend to have lower moduli in uniaxial extension.11-14,23-25 In such cases, increased non-fibrillar matrix is assumed to provide support for the compressive loads, albeit at the expense of tensile properties. The differences observed between the NoAg and HiAg gels in tension and indentation are consistent with the idea that the increased PG and GAG content in locations of higher compressive loading allows the tissue to withstand higher forces for both short (peak) and long (relaxed) times. The specific way in which the non-fibrillar matrix of a tissue (such as tendon) allows it to support multiaxial physiological loads was not answered by this study, and remains an open question.
A central purpose of our collagen-agarose co-gel studies was to develop a simple experimental model system, improving incrementally on our collagen gel tissue analogs, that would allow investigation of the mechanical role of non-fibrillar matrix under multiaxial loading. Agarose was selected as a representative non-fibrillar material because of several characteristics suited to our needs: agarose is a biocompatible polysaccharide, it can retain water when formed as a gel, and it was previously shown6 to intersperse successfully between the fibers of a collagen network. In addition, agarose, as an uncharged molecule, does not introduce the complexities that, for example, hyaluronic acid would. Although the non-fibrillar matrix in tissue (i.e., PG and/or GAG) generally has a high fixed charge density, our goal in this study was to explore a system that exhibits significant incompressibility via hydration but not significant charge effects, thus permitting study of only one factor at a time. Expressed in the language of theoretical mechanics of articular cartilage,26,27 the agarose can be considered a biphasic (solid + water) rather than a triphasic (solid + water + ions) system. Thus, agarose was introduced as a second, non-collagenous component to our tissue analogs and represents a simple experimental model system to evaluate the contributions of the non-fibrillar matrix to overall tissue properties.
In this study, agarose led to concentration-dependent changes in the organizational, mechanical, and structural properties of collagen-agarose co-gel tissue analogs. While not intended to represent a specific constituent of native tissues, the changes due to the addition of agarose presented here and in our previous work7 suggest that non-fibrillar material may significantly contribute to the properties and behavior of artificial and native soft tissues subjected to a variety of physiologically relevant loading protocols. Future work will utilize our group's multiscale modeling approach5,28 to further explore the types and behavior of fiber-matrix interactions on the microscale and elucidate how these relationships lead to mechanical and structural changes such as those presented in this study.
ACKNOWLEDGMENTS
The authors gratefully acknowledge financial support from the National Institutes of Health (R01-EB005813 and F32-EB012352).
REFERENCES
- 1.Wood GC, Keech MK. The formation of fibrils from collagen solutions. 1. The effect of experimental conditions: kinetic and electron-microscope studies. Biochem J. 1960;75:588–98. doi: 10.1042/bj0750588. [DOI] [PMC free article] [PubMed] [Google Scholar]
- 2.Roeder BA, Kokini K, Sturgis JE, Robinson JP, Voytik-Harbin SL. Tensile mechanical properties of three-dimensional type I collagen extracellular matrices with varied microstructure. J Biomech Eng. 2002;124(2):214–22. doi: 10.1115/1.1449904. [DOI] [PubMed] [Google Scholar]
- 3.Thomopoulos S, Fomovsky GM, Holmes JW. The development of structural and mechanical anisotropy in fibroblast populated collagen gels. J Biomech Eng. 2005;127(5):742–50. doi: 10.1115/1.1992525. [DOI] [PubMed] [Google Scholar]
- 4.Jhun CS, Evans MC, Barocas VH, Tranquillo RT. Planar Biaxial Mechanical Behavior of Bioartificial Tissues Possessing Prescribed Fiber Alignment. J Biomech Eng. 2009;131:081006. doi: 10.1115/1.3148194. [DOI] [PMC free article] [PubMed] [Google Scholar]
- 5.Sander EA, Stylianopoulos T, Tranquillo RT, Barocas VH. Image-based multiscale modeling predicts tissue-level and network-level fiber reorganization in stretched cell-compacted collagen gels. Proc Natl Acad Sci USA. 2009;106(42):17675–80. doi: 10.1073/pnas.0903716106. [DOI] [PMC free article] [PubMed] [Google Scholar]
- 6.Ulrich TA, Jain A, Tanner K, Mackay JL, Kumar S. Probing cellular mechanobiology in three-dimensional culture with collagen-agarose matrices. Biomaterials. 2010;31(7):1875–1884. doi: 10.1016/j.biomaterials.2009.10.047. [DOI] [PubMed] [Google Scholar]
- 7.Lake SP, Barocas VH. Mechanical and structural contribution of non-fibrillar matrix in uniaxial tension: a collagen-agarose co-gel model. Ann Biomed Eng. 2011 doi: 10.1007/s10439-011-0298-1. 10.1007/s10439-011-0298-1. [DOI] [PMC free article] [PubMed] [Google Scholar]
- 8.Fithian DC, Kelly MA, Mow VC. Material properties and structure-function relationships in the menisci. Clin Orthop Relat Res. 1990;(252):19–31. [PubMed] [Google Scholar]
- 9.Starke C, Kopf S, Grobel KH, Becker R. Tensile forces at the porcine anterior meniscal horn attachment. J Orthop Res. 2009;27(12):1619–24. doi: 10.1002/jor.20949. [DOI] [PubMed] [Google Scholar]
- 10.Wang S, Xia Q, Passias P, Wood K, Li G. Measurement of geometric deformation of lumbar intervertebral discs under in-vivo weightbearing condition. J Biomech. 2009;42(6):705–11. doi: 10.1016/j.jbiomech.2009.01.004. [DOI] [PubMed] [Google Scholar]
- 11.Berenson MC, Blevins FT, Plaas AH, Vogel KG. Proteoglycans of human rotator cuff tendons. J Orthop Res. 1996;14(4):518–25. doi: 10.1002/jor.1100140404. [DOI] [PubMed] [Google Scholar]
- 12.Koob TJ, Vogel KG. Site-related variations in glycosaminoglycan content and swelling properties of bovine flexor tendon. J Orthop Res. 1987;5(3):414–24. doi: 10.1002/jor.1100050314. [DOI] [PubMed] [Google Scholar]
- 13.Riley GP, Harrall RL, Constant CR, Chard MD, Cawston TE, Hazleman BL. Glycosaminoglycans of human rotator cuff tendons: changes with age and in chronic rotator cuff tendinitis. Ann Rheum Dis. 1994;53(6):367–76. doi: 10.1136/ard.53.6.367. [DOI] [PMC free article] [PubMed] [Google Scholar]
- 14.Vogel KG, Ordog A, Pogany G, Olah J. Proteoglycans in the compressed region of human tibialis posterior tendon and in ligaments. J Orthop Res. 1993;11(1):68–77. doi: 10.1002/jor.1100110109. [DOI] [PubMed] [Google Scholar]
- 15.Tower TT, Neidert MR, Tranquillo RT. Fiber alignment imaging during mechanical testing of soft tissues. Ann Biomed Eng. 2002;30(10):1221–33. doi: 10.1114/1.1527047. [DOI] [PubMed] [Google Scholar]
- 16.Mow VC, Kuei SC, Lai WM, Armstrong CG. Biphasic creep and stress relaxation of articular cartilage in compression: Theory and experiments. J Biomech Eng. 1980;102(1):73–84. doi: 10.1115/1.3138202. [DOI] [PubMed] [Google Scholar]
- 17.Barocas VH, Tranquillo RT. An anisotropic biphasic theory of tissue-equivalent mechanics: the interplay among cell traction, fibrillar network deformation, fibril alignment, and cell contact guidance. J Biomech Eng. 1997;119(2):137–45. doi: 10.1115/1.2796072. [DOI] [PubMed] [Google Scholar]
- 18.Stylianopoulos T, Yeckel A, Derby J, Luo... X. Permeability calculations in three-dimensional isotropic and oriented fiber networks. Physics of Fluids. 2008 doi: 10.1063/1.3021477. [DOI] [PMC free article] [PubMed] [Google Scholar]
- 19.de Visser SK, Bowden JC, Wentrup-Byrne E, Rintoul L, Bostrom T, Pope JM, Momot KI. Anisotropy of collagen fibre alignment in bovine cartilage: comparison of polarised light microscopy and spatially resolved diffusion-tensor measurements. Osteoarthritis Cartilage. 2008;16(6):689–97. doi: 10.1016/j.joca.2007.09.015. [DOI] [PubMed] [Google Scholar]
- 20.Pierce DM, Trobin W, Trattnig S, Bischof H, Holzapfel GA. DT-MRI based numerical simulation of collagen fiber deformation in human articular cartilage.. ASME Summer Bioengineering Conference; Lake Tahoe, CA. 2009.p. 203921. [Google Scholar]
- 21.Tower TT. Polarimetric characterization of fiber alignment in tissues and bipololymer gels. University of Minnesota; Minneapolis, MN: 2000. [Google Scholar]
- 22.Tower TT, Tranquillo RT. Alignment maps of tissues: II. Fast harmonic analysis for imaging. Biophys J. 2001;81(5):2964–71. doi: 10.1016/S0006-3495(01)75936-X. [DOI] [PMC free article] [PubMed] [Google Scholar]
- 23.Lake SP. Anisotropic, inhomogeneous and nonlinear structure-function of human supraspinatus tendon. University of Pennsylvania; Philadelphia, PA: 2009. [Google Scholar]
- 24.Lake SP, Miller KS, Elliott DM, Soslowsky LJ. Effect of fiber distribution and realignment on the nonlinear and inhomogeneous mechanical properties of human supraspinatus tendon under longitudinal tensile loading. J Orthop Res. 2009;27(12):1596–602. doi: 10.1002/jor.20938. [DOI] [PMC free article] [PubMed] [Google Scholar]
- 25.Vogel KG, Koob TJ. Structural specialization in tendons under compression. Int Rev Cytol. 1989;115:267–93. doi: 10.1016/s0074-7696(08)60632-4. [DOI] [PubMed] [Google Scholar]
- 26.Lai WM, Hou JS, Mow VC. A triphasic theory for the swelling and deformation behaviors of articular cartilage. J Biomech Eng. 1991;113(3):245–58. doi: 10.1115/1.2894880. [DOI] [PubMed] [Google Scholar]
- 27.Gu WY, Lai WM, Mow VC. A triphasic analysis of negative osmotic flows through charged hydrated soft tissues. J Biomech. 1997;30(1):71–8. doi: 10.1016/s0021-9290(96)00099-1. [DOI] [PubMed] [Google Scholar]
- 28.Stylianopoulos T, Barocas VH. Multiscale, structure-based modeling for the elastic mechanical behavior of arterial walls. J Biomech Eng. 2007;129(4):611–8. doi: 10.1115/1.2746387. [DOI] [PubMed] [Google Scholar]


