

Abstract
The eyes of newborn mice are relatively underdeveloped and the lids remain closed for the first 2 weeks after birth. There after the eyes undergo a period of rapid growth for several weeks. Eventually the eyes reach an age at which many ocular structures stabilize for the remainder of the animal’s life, or for others, growth is significantly slowed. The central corneal thickness (CCT) is a parameter commonly reported in corneal studies. However there is a large discrepancy in values reported for adult mice as well as a lack of comprehensive values covering the time from birth through adulthood. In this study we report, for the first time, the use of spectral domain optical coherence tomography (SD-OCT) for in situ and in vivo determination of CCT from P0 to P250 for C57BL/6 mice. SD-OCT provided a reliable measure of CCT and we fit the data to an exponential rise to maximum growth curve resulting in a value of 49μm for P0 and a maximum adult value of 106μm. By comparison, corneas processed for conventional histology produced CCT values approximately 30–35% thicker and with greater variability. Ex vivo real-time imaging during fixation revealed swelling and gross distortion of the cornea beginning after only 10–15 minutes in fixative. The fixation artifacts were not observed when the cornea was processed using an optimized microwave fixation protocol. CCT values measured in corneas fixed with the microwave process compared favorably with values obtained with SD-OCT. We conclude that for corneal research, mice younger than 8 weeks of age should not be considered as adults since they are still in a rapid phase of growth up until that time. In addition we report the first use of microwave-processed histological specimens for visualizing the murine cornea. Tissue processed in this manner has minimal artifacts, a CCT equivalent to that measured in vivo by SD-OCT and ultrastructural detail comparable to conventional fixation methods.
Keywords: cornea, C57BL/6, development, OCT, microwave, histology
1. Introduction
Wild type C57BL/6 mice are widely used to study normal corneal structure (Ecoiffier et al., 2009), while mutant C57BL/6 mice with targeted deletions in cell adhesion molecules (Gagen et al., 2010), chemokines (Chintakuntlawar and Chodosh, 2009) and proteoglycans (Carlson et al., 2010; Hayashi et al., 2010; Lee et al., 2009) have contributed much to our understanding of how the cornea responds to injury and infection. Despite their widespread use in corneal research, there is a surprising lack of information regarding postnatal corneal development and apparently no consensus as to when the cornea is fully developed in the C57BL/6 mouse.
A biometric parameter commonly reported in the literature is the central corneal thickness (CCT) which may be used to evaluate normal corneal development and to diagnose a variety of ocular/corneal pathologies (Ashwin et al., 2009; Doughty and Zaman, 2000; Fontes et al., 2010; Hager et al., 2009; Insull et al., 2010; Montiani-Ferreira et al., 2003) as well as pre- and post-surgical conditions (Maldonado et al., 2009). It is also a consideration in contact lens fitting and continuing care for contact lens wearers (Martin et al., 2007; Oh et al., 2009). The CCT in humans has been measured using several in vivo modalities including, optical pachymetry, ultrasound pachymetry, specular microscopy, confocal microscopy, and optical low-coherence interferometry. Measuring the corneal thickness in a mouse, which is roughly one-fifth the thickness and diameter of the human cornea, presents a challenge and many of the human measurement techniques are not applicable to the mouse. Since the CCT is one consideration in determining the maturation level of the cornea, accurate measurement of corneal thickness is desirable.
In the past, histology was the only method for determining murine corneal thickness, and is still a frequently reported method although it produces a large range of CCT values even for the same age, sex and mouse strain. Published biometric data show a wide-range of values for corneal thickness. Recently, for example, one study reported a mean CCT for C57BL/6 adult mice as 74.7±8.6 μm (Haddadin et al., 2009) and another reported 137.0±14.0 μm (Henriksson et al., 2009). Both were measurements from histological sections. Histological artifacts including shrinking, swelling and distortion, which occur frequently, undoubtedly affect the native thickness of the cornea.
Not only is there a large variability in adult CCT values reported, but there is also apparently no published data on the CCT of C57BL/6 mice beginning from birth. One study reports the CCT for CD1 mice from birth to 12 weeks (Song et al., 2003) and measurements were made using confocal microscopy through-focus. Schmucker and Schaeffel (Schmucker and Schaeffel, 2004) reported early corneal thickness changes for C57BL/6 mice from P25-P53 using frozen sections and optical low coherence interferometry and Zhou and colleagues(Zhou et al., 2008) measured corneas with a custom built optical coherence tomography instrument from mice age P22 -P102.
Clearly, there is a need to develop a simple method for accurately measuring the CCT in the mouse as a means of monitoring postnatal development of the mouse cornea through to adulthood. This information would accomplish several goals. First, it would define the growth kinetics of the cornea and define the age at which the cornea reaches its adult thickness. Second, it would provide a baseline with which to determine if artifacts (shrinkage, swelling) exist in corneas prepared for histological analysis. Finally, if routinely-fixed histological artifacts are detected, it should be possible to modify the fixation protocol to yield artifact-free corneal tissue sections that preserve the true biometric dimensions of the mouse cornea.
The purpose of this study was to evaluate postnatal corneal growth and development in C57BL/6 mice by obtaining accurate CCT values. Using spectral domain optical coherence tomography (SD-OCT), we show CCT data can be obtained and used to monitor postnatal corneal development. Moreover, the CCT information is a useful benchmark for evaluating corneal histology and correcting histological artifacts.
2. Materials and Methods
2.1. Animals
All animals used in this study were C57BL/6 strain obtained from an established inbred colony bred and housed in our facility. All animals were treated according to the guidelines described in the Association for Research in Vision and Ophthalmology Statement for the Use of Animals in Vision and Ophthalmic Research and University of Houston animal handling guidelines. Each animal was euthanized with CO2 asphyxiation followed by cervical dislocation for those more than 2 weeks old, and by isoflurane overdose for younger mice.
2.2. SD-OCT
To achieve the highest resolution and thus a more accurate CCT measurement, the Spectralis (Heidelberg Engineering, Dossenheim, Germany) Spectral Domain Optical Coherence Tomography (SD-OCT) instrument was used for in vivo and in situ measurements. It is designed for retinal imaging and therefore required optical modification for corneal scanning. To achieve focus on the cornea, a 30 diopter aspheric lens was attached to the front of the instrument. The optimum focal power and reference arm setting for image acquisition were determined and the same settings were used for all subsequent scans. The accuracy of the SD-OCT axial thickness determination was assessed using two approaches. In the first, a number 1.5 microscope glass coverslip was imaged by SD-OCT and the thickness was compared to that obtained using digital calipers (accuracy of 0.01mm) and that obtained by through-focus imaging on an Olympus IX70 inverted microscope equipped with a 40× objective lens (N.A. 1.4). In a similar manner, miniature polymethyl-methacrylate (PMMA) contact lenses of 1.4mm radius of curvature were scanned for center thickness with the SD-OCT and compared with the thickness estimate provided by through-focus imaging on an IX70 Olympus inverted microscope. In each case, for the SD-OCT, appropriate compensation was made for the difference in index of refraction between glass, PMMA, and mouse cornea (1.523, 1.495 and 1.4015, respectively).
For SD-OCT corneal imaging, euthanized male and female mice (n=36) were immediately secured in a 50ml plastic tube (VWR Lab Shop, Batavia, IL) with a cutout for the nose and mouth as well as openings for the eyes. Very young mice were attached to a wooden tongue depressor for support. The corneas were scanned in a series producing a sequence of horizontal cross-sectional views encompassing the entire cornea. Additionally, a series of radial scans was performed covering 360 degrees. When imaging neonates prior to lid opening (≤ 14 days), the animals were euthanized and lids were carefully removed before scanning. Eyes were kept moist by occasional misting with ophthalmic irrigating solution (OCuSOFT, Inc., Rosenberg, TX). Mice greater than 4 weeks of age (n = 15) were anesthetized with ketamine/xylazine intraperitoneal injection (100/10 mg/Kg) and scanned with SD-OCT in the same manner as the euthanized animals. The same animals were subsequently sacrificed, fixed and processed for histological sectioning.
Three scans were taken for each eye and the CCT was measured at the geometric center of the corneal cross sections. Each cross section measured was obtained by selecting the scan which passed through the center of the pupil and with the iris plane perpendicular to the scanning beam. Three measurements were made for each scan, one at the center and one 50 μm on either side of center. ImageJ software was used to create a “profile plot” (linear plot of image reflectivity). Peaks on the profile representing the anterior and posterior corneal surfaces were selected for measurements. The measurements were obtained in pixels and the appropriate pixel to μm conversion factor was applied.
2.3. Conventional histology
After observing initial obvious processing artifacts, several modifications to our protocol were investigated and the data presented were obtained with the method that consistently produced the best results. From our experience, removing corneas in situ could not be accomplished without altering the corneal shape even when the eyes were pre-fixed with topical application of glutaraldehyde fixative prior to removing the cornea. Therefore whole right and left eyes were immediately harvested from euthanized male and female mice (n = 39) briefly fixed (10 minutes, RT) in 0.1M sodium cacodylate buffer (pH 7.2) containing 2.5% glutaraldehyde, the corneas were then removed and placed in the same fixative for another 2 hours Corneas were post fixed in 2% osmium tetroxide in 0.1M sodium cacodylate buffer, dehydrated in an increasing series of acetone (30, 50, 70, 90, 100, 100%; 15 minutes each), and embedded in Embed 812 resin (Electron Microscopy Sciences, Hatfield, PA). Transverse microscope sections (0.5 μm) through the center of the cornea were cut with an ultramicrotome (RMC, MT7000) and stained with Toluidine blue.
Initial light microscopic tissue processing produced stromal artifacts. and subsequently the fixative solution was changed to 2.0% glutaraldehyde in 0.08M sodium cacodylate (Doughty et al., 1997). However, the incidence and severity of artifacts remained the same, hence CCT data from both fixative solutions were combined for analysis.
Using a 20× objective (N.A. 0.75) a limbus-to-limbus digital montage was created (Sony Coolsnap camera) for each corneal transverse section using a DeltaVision Core deconvolution microscope system running SoftWorx software (Applied Precision, Isaquah, WA). A grid of three parallel lines spaced 50μm apart was over-laid on the montage at the geometric center and the total, epithelial, and stromal corneal thickness measured at each line with ImageJ software (NIH). The pixel to μm conversion factor was determined by measuring the full width of the image in μm using the SoftWorx software measuring tool and dividing the image size (1024 pixels) by this amount.
2.4. Microwave histology
In an attempt to improve the fixation conditions and avoid distortion artifacts, eyes from mice (n = 24) at various ages were processed using a vacuum-assisted PELCO Biomicrowave (Ted Pella, Inc., Redding, CA). Even though whole eyes could be processed using the recommended protocol from the microwave manufacturer without gross morphological distortion and minimal interlamellar separations, there was microscopic evidence of inadequate fixation. Subsequently, modifications to the protocol were investigated to optimize the protocol used in this study. Whole eyes were removed from euthanized mice, placed in fixative (2.5% glutaraldehyde in 0.1M sodium cacodylate buffer, pH 7.2), and immediately processed in the microwave under vacuum, as follows: The eyes received microwave radiation for 1 minute on-1 minute off-1 minute on, at 150 watts. The whole eyes were then removed from the microwave, placed on a bed of paraffin, and the cornea removed by a single cut with a thin double-edged razor blade. The cornea was placed back in fixative and the 3 minute microwave fixation cycle was repeated. The remainder of the protocol was as recommended by the microwave manufacturer which included the same post-fixation processes as with conventional fixation only performed with the microwave. With microwave processing, the eyes were only exposed to glutaraldehyde fixative solution for 8–10 minutes and the entire fixation process up to resin polymerization was completed in approximately 75 minutes as compared to 72 hours, or more, in conventional processing. CCT values of microwave fixed samples were obtained in the same fashion as with conventional histology specimens.
2.5. Evaluation of ex vivo fixation effects using Visante (Zeiss) OCT imaging
To evaluate conventional fixation-induced artifacts (shrinkage, swelling and general distortion) eyes complete with extraocular muscles were removed from euthanized mice (n=9, >8 weeks of age) and a plastic clip was attached to the extraocular tissue. This allowed the eye to be held without any force being applied to the globe. The suspended eyes were then immersed in fixative in a plastic chamber with a glass coverslip observation window glued in-place to optimize scanning. The chamber was then placed in front of the Visante (Carl Zeiss Meditec, Dublin, CA) OCT such that the axis of the OCT was perpendicular to the iris plane and centered on the pupil. Scans were obtained every 5 minutes up to 60 minutes of total time in fixative.
2.6. Ultrastructural morphology
Representative tissue blocks from adult mice (8–12 weeks) prepared using conventional processing and ones prepared using microwave processing were sectioned transversely with an ultramicrotome (RMC, MT 7000) at a thickness of 80–100nm and stained with uranyl acetate and lead citrate. Images were obtained using an FEI Tecnai 12 transmission electron microscope equipped with an Ultrascan 1000 digital camera. Collagen fibril diameter and interfibril spacing were measured as previously described (Petrescu et al., 2007). Briefly, using cross-sectional views, individual fibril diameters were measured and the center to center distances measured to the surrounding 6–7 fibrils. Images were captured at 49,000× magnification and measured using ImageJ.
2.7. Statistical analysis
Statistical analyses were made using Student’s t-test for two groups and ANOVA with Tukey post-test for multiple comparisons were used for comparisons among three groups. A p value of < 0.05 was considered significant. Developmental growth curves were generated using the exponential rise to maximum equation. All data are shown as mean ± SEM.
3. Results
3.1. Accuracy of SD-OCT measurements
Accuracy of thickness measurements obtained by the optically modified Spectralis SD-OCT instrument was first assessed by measuring a flat glass coverslip whose thickness was determined using digital calipers (170±0μm) and microscopic through focus (174±4μm). Employing the default μm/pixel used by Spectralis software for thickness measurements and after the adjustment for index of refraction (1.523 compared to 1.4015 for the mouse cornea), the SD-OCT measurements of the glass coverslip (176±2 μm) were not significantly different from those obtained by digital calipers or through-focus. Secondly, in order to assess the effect of curvature, a PMMA contact lens with a radius of curvature similar to a mouse cornea (1.4mm) was measured. The contact lens thickness measured 272±5 μm with through-focus imaging on the Olympus IX70 and 270±0 μm with SD-OCT. The shape of the cornea is somewhat distorted with Spectralis (increased convexity) as it is designed to image the concave retina and not the convex surface of the cornea. The glass cover slip image produced a curved (concave) image that could be mathematically corrected. Even though lateral dimensions were affected, the transverse (anterior/posterior) dimensions measured were accurate and consistent. Collectively, these calibration measurements confirm the accuracy of the SD-OCT for axial thickness measurements.
3.2. CCT growth curve determined by SD-OCT measurements
SD-OCT produced images with a resolution (approximately 4μm) approaching that of low powered light microscopy (Figure 1). Although individual lamellar layers are not discernible, there is evidence of a horizontal organization to the stroma. The images cover limbus to limbus, provide excellent visualization of the iris and show the anterior portion of the crystalline lens.
Figure 1.
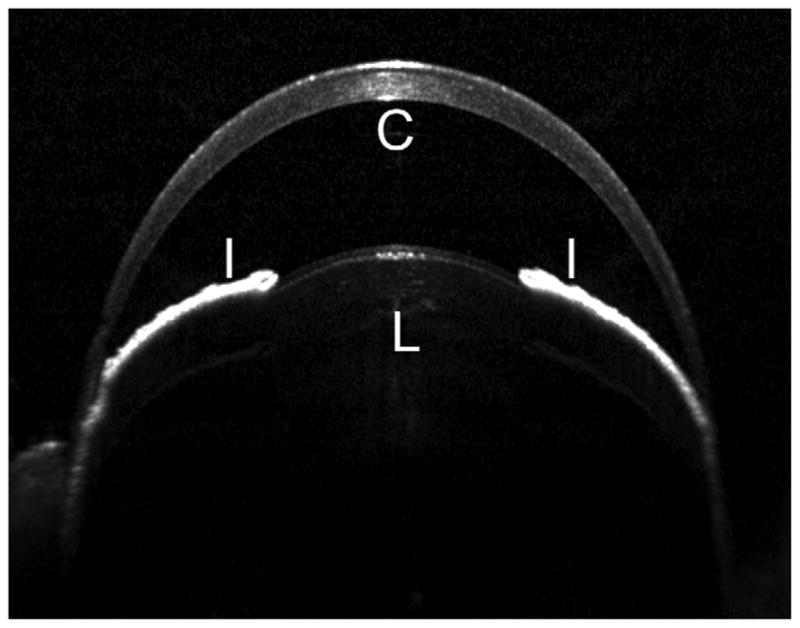
Anterior segment image obtained by Spectralis SD-OCT in 10 week old mouse. The Spectralis SD-OCT provides images approaching what might be seen with low powered light microscopy. This image is typical of imaging obtained from an adult C57BL/6 mouse. Symbols: C, cornea; I, iris; L, lens.
In order to characterize the rate of growth of the central cornea, after confirming the accuracy of SD-OCT thickness measurements, CCT data were obtained for mice ranging in ages from P0 to P250. With no significant difference found between anesthetized and euthanized animals, nor between males and females (data not shown), CCT data presented in Figure 2 include data from all mice. The data show that during the first few weeks postnatal there is a rapid increase in central corneal thickness and by P55 it has achieved 95% of its maximum value, after which it begins to level off. The maximum CCT predicted from fitting the exponential rise to maximum equation to the data (r2=0.84) is 106μm. The average of the measured values for greater than 55 days of age was 103±2μm. In summary, thickness measurements obtained by SD-OCT were shown to be accurate, and when applied to the murine cornea, to provide accurate CCT measurements representative of the native cornea.
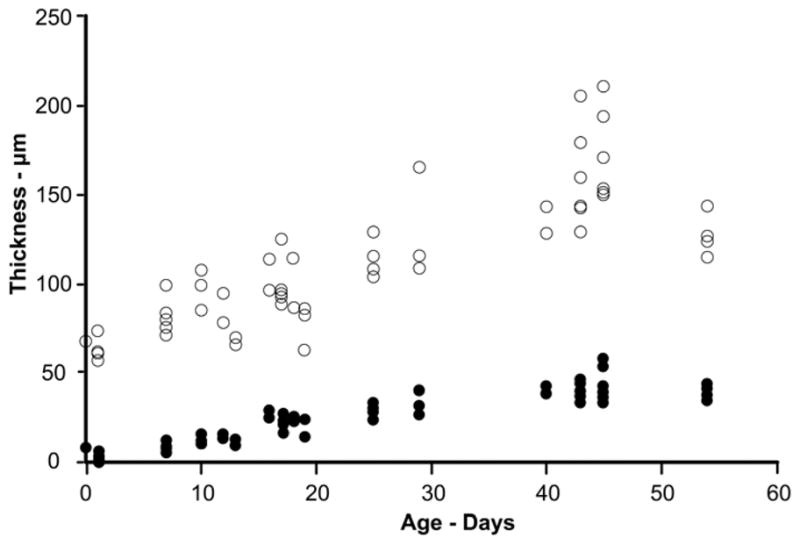
Figure 2.

CCT growth curves determined by SD-OCT and by conventional histology. Conventional fixation (open circles) produced more variable CCT values with a maximum mean value of 141μm. SD-OCT (filled circles) values were less variable and had a maximum mean value of 106μm; the age at which they reached 95% of maximum was 50 days and 55 days, respectively. The two curves represent the data fit to the exponential rise to maximum equation (CCT = CCT0+a*(1-e−b*age), r2=0.56 and 0.84 for conventional histology and SD-OCT, respectively.
3.3. Limitations of conventional histology CCT measurements
Measuring the CCT using conventional histology sections produced considerable variation in values and some of the corneal transverse sections were distorted in shape and many had separations between the stromal lamellae some of which were quite large (Figure 3, Panel A). Separations were more evident in the posterior stroma, but occasionally included the anterior stroma as well. In a few cases the whole stroma appeared obviously thickened, without large lamellar separations. It was of interest to note that the very young corneas (prior to lid opening) were more resistant to separations (data not shown). As mentioned in the methods, the central corneal measurements were made by randomly placing three lines in the geometric center. In many cases measurements were made in areas where there were separations between lamellae. This resulted in a large variation in the measured thickness and a high mean value as compared to SD-OCT (Figure 2). The initial, P0 CCT was similar to the SD-OCT value of approximately 50μm and rose to about 140μm (>2.5 fold increase) before beginning to level off at 50 days (95% of maximum) of age after which it remained constant. The maximum CCT predicted from fitting the exponential rise to maximum equation to the data (r2=0.56) is 141μm while the average of the measured values for greater than 50 days was 138±5μm or approximately 33% thicker than what was found with SD-OCT and with greater variability.
Figure 3.

Corneal histology following conventional or microwave-assisted fixation. Corneal sections processed by conventional fixation frequently contained numerous interlamellar separations (A). In contrast microwave fixation minimized separations and produced a 30–35% thinner stromal thickness (B). Visante ex vivo imaging showed gross distortion and swelling with conventional fixation (C) and minimal or no distortion without swelling when microwave processed (D).
The epithelium is only 1–2 cell layers thick at birth with an average thickness of 5–6 μm and rapidly increases in number of layers and thickness during P0-P50 after which it levels off. The percentage of the total corneal thickness attributed to the epithelium increases (approximately 10% to 30%) during the same time period before leveling off. It is readily apparent from Figure 4 that most of the histological variability in CCT is due to variations in stromal thickness rather than epithelial thickness.
Figure 4.
Stromal compared to epithelial thickness histological variability. With age, the epithelium increases in thickness (filled circles) up until approximately P45 and shows minimal variability in values as compared to stromal thickness (open circles). These data are from conventional processed histological samples and demonstrate that the stroma produces the bulk of the CCT variability. For each cornea examined, an epithelial and stromal thickness measurement was obtained resulting in equivalent numbers of observations at each age.
Our results show that conventional histological processing of mouse corneas produced CCT values that were not representative of in vivo values as shown by SD-OCT. Clearly, the stroma is prone to artifactual separations between lamellae and generalized thickening beyond what can be explained by these separations. Hence, in order to collect meaningful morphological and ultrastructural details, a method of tissue preparation that minimizes artifacts induced by processing is desirable.
3.4. Fixative induced distortions
The primary fixative utilized for our conventional histology was glutaraldehyde, which would be expected to penetrate a 100 μm cornea in approximately 30 minutes (Hayat, 1981) and crosslinks resident proteins. Post-fixation with osmium tetroxide enhances the process by stabilizing cell membrane lipids. Cells are killed while tissues stabilize during primary fixation and this seems the most likely step in processing to induce artifacts. In order to assess the overall effects of glutaraldehyde, whole eyes were imaged by OCT during fixation in real-time.
Ex vivo scanning revealed distortion of the shape and swelling of the cornea with exposure to glutaraldehyde. With a concentration of 2.5%, the distortion began after about 10–15 minutes and after 30 minutes it was severe, sometimes ultimately resulting in total loss of the anterior chamber. The CCT during this time increased by 25–35%. When the concentration of glutaraldehyde was reduced to 2.0% the distortion took longer to occur, however the CCT increased by the same amount after 60 minutes (data not shown). Figure 5 shows an example of a whole eye in 2.5% glutaraldehyde initially (Panel A) and then after 30 minutes (Panel B). The same eye processed for microscopy showed large lamellar separations.
Figure 5.
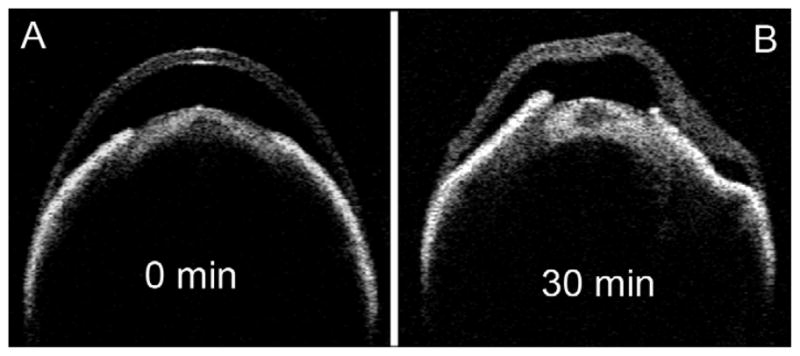
Time-lapse images of a representative single eye exposed to conventional fixative. The Visante OCT was used for ex vivo imaging of the whole eye immediately after placing in 2.5% glutaraldehyde fixative solution (A) and after 30 minutes (B). Distinct stromal swelling and distortion are evident by 30 minutes.
In order to produce histological specimens with minimal artifacts it seemed imperative that the exposure time to glutaraldehyde be minimized while at the same time providing adequate preservation of the tissue.
3.5. Microwave tissue preservation
To determine if histological artifacts could be reduced and thereby preserve the native corneal thickness, corneas were prepared using an optimized microwave protocol. Microwave fixed corneas had few or no lamellar separations (Figure 3, Panel B), when compared to conventional fixation, (Figure 3, Panel C) were without gross corneal distortion (Figure 3, Panel D), and appeared to be well fixed when examined by electron microscopy. At the ultrastructural level, the stroma of microwave processed corneas was compact and did not exhibit interlamellar separations compared to conventionally fixed corneas (Figure 6, Panels A and B) while the preservation of keratocyte cytoplasmic structure was similar to that obtained with conventional fixation (Figure 6, Panels C and D). The mean microwave processed CCT beyond 8 weeks was 99 (±2) μm and this value is in close agreement with in vivo CCT estimates made by SD-OCT (Figure 7). In addition, the epithelial thickness determined from conventional histology agreed with that obtained from measuring microwave-fixed sections, suggesting that most of the artifactual increase in CCT following conventional processing occurs within the stroma. Table 1 shows the values for collagen fibril diameter and Table 2 for the interfibrillar spacing in the anterior and posterior central cornea for specimens prepared by conventional fixation versus microwave processed. No difference in fibril diameter was observed between the two fixation processes. However, the interfibrillar spacing was statistically different with approximately 20% less anteriorly, and 35% less posteriorly in the microwave processed specimens compared to the conventional processed corneas. Collectively, our results support microwave-assisted histological processing as a method which produces CCT values not significantly different than SD-OCT values, while providing superior stromal ultrastructural preservation compared to conventional histological processing.
Figure 6.

Corneal ultrastructure after conventional or microwave-assisted fixation protocol. This figure represents the right and left eyes of the same 8 week old mouse. Transmission electron microscopy shows interlamellar separation in a conventional processed specimen (A, arrow). In most cases the separations were associated with the locations of keratocytes (white asterick). By comparison, microwave processing shows minimal separations (B). At higher magnification (different location within the same cornea as the image directly above) the microwave specimen (D) shows comparable ultrastructure preservation than the conventional specimen (C). White arrowheads show good preservation of rough endoplasmic reticulum within the keratocytes. (A&B scale bar = 2 μm, C&D scale bar = 0.5 μm)
Figure 7.

Comparison of CCT determined from SD-OCT, microwave processed histology sections, and conventional histology sections. At 7 weeks and greater conventional processed CCT values (black bars) are significantly greater compared to matching SD-OCT (white bars) and microwave processed (hatched bars) measurements (ANOVA, Tukey post-test, *p < 0.05).
Table 1.
Collagen fibril diameter (mice 8–12 weeks)
| Fibril Diameter (nm)
| ||
|---|---|---|
| Conventional (n=3) | Microwave (n=4) | |
| Anterior | 24.3±0.5 | 25.8±0.6 |
| Posterior | 25.2±0.8 | 27.3±0.5 |
Table 2.
Spacing between collagen fibril centers (mice 8–12 weeks)
| Interfibrillar Spacing (nm)
| ||
|---|---|---|
| Conventional (n=3) | Microwave (n=4) | |
| Anterior | 67.8±2.8 | 53.6±1.1* |
| Posterior | 75.8±1.1 | 55.9±2.3* |
p < 0.05 compared to conventional histology
4. Discussion
Consistent with the purpose of this study, postnatal corneal growth and development in C57BL/6 mice were elucidated by validating the SD-OCT as a method for obtaining accurate CCT values and measuring the CCT of mice from P0 to P250. These CCT data were used, not only to monitor postnatal corneal development, but also as a benchmark for evaluating corneal histology prepared by conventional and microwave fixation.
A comprehensive normal growth curve was established for C57BL/6 mice and corroborated by measurements of microwave-fixed histological sections. Our results show that the C57BL/6 mouse is born with a CCT of approximately 50–60 μm. During the first 7–8 weeks it shows rapid thickening, more than doubling in thickness, after which it remains nearly constant at about 103 μm (SD-OCT, mean value >8 weeks) or 99 μm (microwave histology, mean value >8 weeks). The mouse is essentially born pre-mature with the eyelids not opening until approximately day 12–14, after which the cornea undergoes maturational changes for several weeks (Chakravarti et al., 2006; Jester et al., 2007; Nagasaki and Zhao, 2003; Schmucker and Schaeffel, 2004; Song et al., 2003; Zhou et al., 2008; Zieske, 2004). Several parameters of eye growth and maturation either level off or slow to a minimal rate of change for the remainder of their adult life (Jun et al., 2006; Zhou et al., 2008). The CCT developmental curve provides an important gauge for eye development in general, and suggests that animals younger than 7–8 weeks should not be considered adults for corneal research since they are still in a phase of rapid growth and development. However, in many murine corneal studies, mice as young as 6 weeks of age are often used and assumed to represent the mature, fully developed cornea.
It has recently been reported that there is a range in mean CCT values in 17 different strains of adult mice ranging from approximately 90μm to 124 μm (similar measurements by cryosections and ultrasound pachymetry) (Lively et al., 2010). Our study was confined to a colony of inbred C57BL/6 mice and it remains to be shown whether or not other strains of mice would exhibit an age-dependent growth curve temporally similar. When considering animal models for corneal research it is therefore important to consider the age of the mouse in the context of the specific strain.
Obtaining accurate CCT data is necessary, for example, for monitoring corneal development and for determining volumetric values to assess cell density and surface area ratios (Gagen et al., 2010). Frequently, the process of fixing corneal tissue results in separations between the stromal lamellae, and/or shrinkage or swelling of tissues, obviously adding error to thickness measurements. When measuring stromal or total corneal thickness, or calculating volume, these separations cannot be ignored. In addition, when investigators are looking at interactions between stromal cells and surrounding collagen, the separations may obscure the actual physical juxtapositions. Histology specimens are subjected to harsh fixative and preparatory procedures which have the potential to produce artifacts. Since there are many methods for fixing corneal tissue, they may all produce somewhat different results.
Corneal specimens prepared for light and electron microscopy are commonly preserved using glutaraldehyde as a primary fixative with fixation times varying from hours to a few days. For electron microscopy, osmium post-fixation is also typically incorporated into the process, after which the tissue is dehydrated. In each step of the tissue preparation there is potential for artifactual alteration. During this process metabolic activity ceases, which results in cell permeability and ion concentration changes (Hayat, 1981). While the osmolarity of solutions used is a consideration for avoiding artifactual changes in tissue and cell volume, the specific ion concentration is even more important (Doughty, 2000). As observed in our ex vivo imaging, our standard fixative solution, with an osmolarity of approximately 450 mOsm caused considerable distortion (apparent overall shrinkage) of the intact eyeball and a paradoxical increase in corneal thickness (as much as 35%) beginning after about 15 minutes. Ex vivo scans with fixative solutions containing glutaraldehyde dramatically demonstrated significant distortion and swelling and separations between lamellae.
It has been shown that stromal lakes (inter/intralamellar spaces) are a typical consequence of stromal edema (Quantock et al., 1991). In our study, there was no reason to expect that the corneas would be edematous as the eyes were not inflamed and had been harvested from healthy mice and processed immediately after enucleation (the absence of edema was also confirmed with SD-OCT). An obvious conclusion was that the fixation process was inducing interlamellar separations (and distortions). This was confirmed with ex vivo imaging of the eyes during the process of fixation. It was also interesting to note that in nearly every case the separations occurred coincident with the location of keratocytes and were much more likely to occur in the posterior stroma, as opposed to the anterior. It was also noted that separations were minimal in mice prior to eyelid opening. These findings suggest keratocytes are the “weak link” in stromal tethering and prone to “letting go” during swelling. A possible explanation for the increased tendency of the posterior stroma to exhibit interlamellar separations may lie in the organizational and compositional differences between anterior and posterior stroma. It has been well established that there is a higher keratocyte density, a lower keratan sulphate to chondroitin/dermatan sulphate ratio, and less proneness to swelling in the anterior stroma (Meek et al., 2003). Interestingly, very young corneas have more densely packed keratocytes and relatively low amounts of keratan sulphate (Song et al., 2003), which may make them less susceptible to edema and interlamellar separation after fixation.
In the current study, CCT measurements obtained with SD-OCT avoided the potential for distortions and artifacts resulting from fixative effects and it was established as a valid and reliable method for CCT determination in the mouse. The SD-OCT, designed for scanning the retina, was easily modified with a 30D ophthalmic condensing lens attached to the front of the instrument. Measuring objects of known thickness established the validity of using the SD-OCT for thickness measurements. Results for CCT obtained by SD-OCT were much less variable and thinner on average than values obtained from conventional histology samples. This alone was evidence that CCT values obtained from conventional histology samples were influenced by artifacts occurring during fixation. This was corroborated by data obtained from microwave processed samples which showed minimal separations and CCT values within a few microns of the SD-OCT. SD-OCT yielded a CCT value that became the goal to maintain during tissue fixation. Microwave processing minimized the fixation time and eliminated the artifactual lamellar separations while maintaining the CCT values estimated from SD-OCT data and provided reliable morphometric data representative of the native, unfixed cornea. Collagen fibril diameter was essentially the same with microwave-processing as with conventional histology processing and similar to values reported for x-ray diffraction analysis. However, collagen fibril packing was tighter in the microwave processed corneas (Table 1). This leads to the conclusion that, other than interlamellar separations, the thicker stroma seen in conventional histology sections is also due to an increase in interfibrillar spacing.
Microwave-assisted tissue fixation has been described in the literature since the early 1970’s but is still not a commonly used method for either light or electron microscopy even though it accomplishes the entire fixation process in 1–2 hours with results as good, or better, than conventional fixation protocols requiring several days processing time (Ferris et al., 2009; Wendt et al., 2004). The energy absorbed from microwave radiation produces heat and molecular motion. In the current study unwanted heating of specimens is averted by using a low wattage magnetron setting and incorporating a cold-spot water-filled heat sink. The microwave-generated molecular motion combined with vacuum processing greatly enhances fixative penetration and reduces the distorting effects of fixative osmolarity (Wendt et al., 2004).
Corneas prepared in the microwave were exposed to each of the chemicals for very brief times. For example the total time in glutaraldehyde-containing fixative was 10 minutes or less, which was less than the time in which distortion was seen to occur in the ex vivo experiments. The histological sections produced were, not only, generally free of lamellar separations, they showed evidence of satisfactory ultrastructural preservation. There was considerable discrepancy between the CCT of the conventionally-fixed corneas as compared to the microwave-fixed corneas. It is compelling to consider the microwaved corneas, without the separations, as representing the “truer” CCT. Using a microwave-assisted histological protocol, it is possible to preserve the anatomical dimensions and ultrastructure of the mouse cornea and avoid the harsh deformational effects (shrinkage or swelling) that accompany routine histologic preparations. The microwave protocol, in conjunction with electron microscopy, further extends the morphologic detail provided by SD-OCT and light microscopy, and provides a superior method for obtaining high resolution corneal images free of fixation-induced distortional artifacts.
In summary, this study provides, for the first time, a comprehensive growth curve of CCT for C57BL/6 mice from birth through adulthood based on in vivo/in situ data obtained by SD-OCT and confirmed by histological sections prepared using microwave radiation. To our knowledge this is the first reported use of SD-OCT or microwave processed histological sections for murine CCT measurements.
Highlights.
Our results suggest that for corneal research, C57BL/6 mice younger than 8 weeks of age should not be considered as adults
The adult central corneal thickness for C57BL/6 mice is approximately 106μm
Spectralis SD-OCT provides high resolution images of the murine anterior segment
Conventional histology fixation processing is prone to stromal artifacts
Microwave tissue processing minimizes fixation artifacts
Acknowledgments
This work is supported by the National Eye Institute grants EY17120, EY001139, and P30EY007551. The authors thank Evelyn Brown and Margaret Gondo for providing excellent technical support.
Footnotes
Publisher's Disclaimer: This is a PDF file of an unedited manuscript that has been accepted for publication. As a service to our customers we are providing this early version of the manuscript. The manuscript will undergo copyediting, typesetting, and review of the resulting proof before it is published in its final citable form. Please note that during the production process errors may be discovered which could affect the content, and all legal disclaimers that apply to the journal pertain.
References
- Ashwin PT, Shah S, Pushpoth S, Wehbeh L, Ilango B. The relationship of Central Corneal Thickness (CCT) to Thinnest Central Cornea (TCC) in healthy adults. Cont Lens Anterior Eye. 2009;32:64–67. doi: 10.1016/j.clae.2008.07.006. [DOI] [PubMed] [Google Scholar]
- Bergmanson JP. Corneal histology can be conducted without any obvious and distracting artifacts. Cont Lens Anterior Eye. 2008;31:177–178. doi: 10.1016/j.clae.2008.06.001. [DOI] [PubMed] [Google Scholar]
- Carlson EC, Sun Y, Auletta J, Kao WW, Liu CY, Perez VL, Pearlman E. Regulation of corneal inflammation by neutrophil-dependent cleavage of keratan sulfate proteoglycans as a model for breakdown of the chemokine gradient. J Leukoc Biol. 2010;88:517–522. doi: 10.1189/jlb.0310134. [DOI] [PMC free article] [PubMed] [Google Scholar]
- Chakravarti S, Zhang G, Chervoneva I, Roberts L, Birk DE. Collagen fibril assembly during postnatal development and dysfunctional regulation in the lumican-deficient murine cornea. Dev Dyn. 2006;235:2493–2506. doi: 10.1002/dvdy.20868. [DOI] [PubMed] [Google Scholar]
- Chintakuntlawar AV, Chodosh J. Chemokine CXCL1/KC and its receptor CXCR2 are responsible for neutrophil chemotaxis in adenoviral keratitis. J Interferon Cytokine Res. 2009;29:657–666. doi: 10.1089/jir.2009.0006. [DOI] [PMC free article] [PubMed] [Google Scholar]
- Doughty MJ. Swelling of the collagen-keratocyte matrix of the bovine corneal stroma ex vivo in various solutions and its relationship to tissue thickness. Tissue Cell. 2000;32:478–493. doi: 10.1016/s0040-8166(00)80004-x. [DOI] [PubMed] [Google Scholar]
- Doughty MJ, Bergmanson JP, Blocker Y. Shrinkage and distortion of the rabbit corneal endothelial cell mosaic caused by a high osmolality glutaraldehyde-formaldehyde fixative compared to glutaraldehyde. Tissue Cell. 1997;29:533–547. doi: 10.1016/s0040-8166(97)80054-7. [DOI] [PubMed] [Google Scholar]
- Doughty MJ, Zaman ML. Human corneal thickness and its impact on intraocular pressure measures: a review and meta-analysis approach. Surv Ophthalmol. 2000;44:367–408. doi: 10.1016/s0039-6257(00)00110-7. [DOI] [PubMed] [Google Scholar]
- Ecoiffier T, Yuen D, Chen L. Differential distribution of blood and lymphatic vessels in the murine cornea. Invest Ophthalmol Vis Sci. 2009;51:2436–2440. doi: 10.1167/iovs.09-4505. [DOI] [PMC free article] [PubMed] [Google Scholar]
- Ferris AM, Giberson RT, Sanders MA, Day JR. Advanced laboratory techniques for sample processing and immunolabeling using microwave radiation. J Neurosci Methods. 2009;182:157–164. doi: 10.1016/j.jneumeth.2009.06.002. [DOI] [PubMed] [Google Scholar]
- Fontes BM, Ambrosio R, Jr, Jardim D, Velarde GC, Nose W. Corneal biomechanical metrics and anterior segment parameters in mild keratoconus. Ophthalmology. 2010;117:673–679. doi: 10.1016/j.ophtha.2009.09.023. [DOI] [PubMed] [Google Scholar]
- Gagen D, Laubinger S, Li Z, Petrescu MS, Brown ES, Smith CW, Burns AR. ICAM-1 mediates surface contact between neutrophils and keratocytes following corneal epithelial abrasion in the mouse. Exp Eye Res. 2010;91:676–684. doi: 10.1016/j.exer.2010.08.007. [DOI] [PMC free article] [PubMed] [Google Scholar]
- Haddadin RI, Oh DJ, Kang MH, Filippopoulos T, Gupta M, Hart L, Sage EH, Rhee DJ. SPARC-null mice exhibit lower intraocular pressures. Invest Ophthalmol Vis Sci. 2009;50:3771–3777. doi: 10.1167/iovs.08-2489. [DOI] [PubMed] [Google Scholar]
- Hager A, Wegscheider K, Wiegand W. Changes of extracellular matrix of the cornea in diabetes mellitus. Graefes Arch Clin Exp Ophthalmol. 2009;247:1369–1374. doi: 10.1007/s00417-009-1088-4. [DOI] [PubMed] [Google Scholar]
- Hayashi Y, Call MK, Chikama T, Liu H, Carlson EC, Sun Y, Pearlman E, Funderburgh JL, Babcock G, Liu CY, Ohashi Y, Kao WW. Lumican is required for neutrophil extravasation following corneal injury and wound healing. J Cell Sci. 2010;123:2987–2995. doi: 10.1242/jcs.068221. [DOI] [PMC free article] [PubMed] [Google Scholar]
- Hayat MA. Fixation for electron microscopy. Academic Press; New York: 1981. [Google Scholar]
- Henriksson JT, McDermott AM, Bergmanson JP. Dimensions and morphology of the cornea in three strains of mice. Invest Ophthalmol Vis Sci. 2009;50:3648–3654. doi: 10.1167/iovs.08-2941. [DOI] [PMC free article] [PubMed] [Google Scholar]
- Insull E, Nicholas S, Ang GS, Poostchi A, Chan K, Wells A. Optic disc area and correlation with central corneal thickness, corneal hysteresis and ocular pulse amplitude in glaucoma patients and controls. Clin Experiment Ophthalmol. 2010;38:839–844. doi: 10.1111/j.1442-9071.2010.02373.x. [DOI] [PubMed] [Google Scholar]
- Jester JV, Lee YG, Huang J, Houston J, Adams B, Cavanagh HD, Petroll WM. Postnatal corneal transparency, keratocyte cell cycle exit and expression of ALDH1A1. Invest Ophthalmol Vis Sci. 2007;48:4061–4069. doi: 10.1167/iovs.07-0431. [DOI] [PubMed] [Google Scholar]
- Jun AS, Chakravarti S, Edelhauser HF, Kimos M. Aging changes of mouse corneal endothelium and Descemet’s membrane. Exp Eye Res. 2006;83:890–896. doi: 10.1016/j.exer.2006.03.025. [DOI] [PubMed] [Google Scholar]
- Lee S, Bowrin K, Hamad AR, Chakravarti S. Extracellular matrix lumican deposited on the surface of neutrophils promotes migration by binding to beta2 integrin. J Biol Chem. 2009;284:23662–23669. doi: 10.1074/jbc.M109.026229. [DOI] [PMC free article] [PubMed] [Google Scholar]
- Lively GD, Jiang B, Hedberg-Buenz A, Chang B, Petersen GE, Wang K, Kuehn MH, Anderson MG. Genetic dependence of central corneal thickness among inbred strains of mice. Invest Ophthalmol Vis Sci. 2010;51:160–171. doi: 10.1167/iovs.09-3429. [DOI] [PMC free article] [PubMed] [Google Scholar]
- Maldonado MJ, Lopez-Miguel A, Nieto JC, Cano-Parra J, Calvo B, Alio JL. Reliability of noncontact pachymetry after laser in situ keratomileusis. Invest Ophthalmol Vis Sci. 2009;50:4135–4141. doi: 10.1167/iovs.09-3408. [DOI] [PubMed] [Google Scholar]
- Martin R, de Juan V, Rodriguez G, Cuadrado R, Fernandez I. Measurement of corneal swelling variations without removal of the contact lens during extended wear. Invest Ophthalmol Vis Sci. 2007;48:3043–3050. doi: 10.1167/iovs.06-1372. [DOI] [PubMed] [Google Scholar]
- Meek KM, Leonard DW, Connon CJ, Dennis S, Khan S. Transparency, swelling and scarring in the corneal stroma. Eye (Lond) 2003;17:927–936. doi: 10.1038/sj.eye.6700574. [DOI] [PubMed] [Google Scholar]
- Montiani-Ferreira F, Petersen-Jones S, Cassotis N, Ramsey DT, Gearhart P, Cardoso F. Early postnatal development of central corneal thickness in dogs. Vet Ophthalmol. 2003;6:19–22. doi: 10.1046/j.1463-5224.2003.00196.x. [DOI] [PubMed] [Google Scholar]
- Nagasaki T, Zhao J. Centripetal movement of corneal epithelial cells in the normal adult mouse. Invest Ophthalmol Vis Sci. 2003;44:558–566. doi: 10.1167/iovs.02-0705. [DOI] [PubMed] [Google Scholar]
- Oh JH, Yoo C, Kim YY, Kim HM, Song JS. The effect of contact lens-induced corneal edema on Goldmann applanation tonometry and dynamic contour tonometry. Graefes Arch Clin Exp Ophthalmol. 2009;247:371–375. doi: 10.1007/s00417-008-0954-9. [DOI] [PubMed] [Google Scholar]
- Petrescu MS, Larry CL, Bowden RA, Williams GW, Gagen D, Li Z, Smith CW, Burns AR. Neutrophil interactions with keratocytes during corneal epithelial wound healing: a role for CD18 integrins. Invest Ophthalmol Vis Sci. 2007;48:5023–5029. doi: 10.1167/iovs.07-0562. [DOI] [PMC free article] [PubMed] [Google Scholar]
- Quantock AJ, Meek KM, Brittain P, Ridgway AE, Thonar EJ. Alteration of the stromal architecture and depletion of keratan sulphate proteoglycans in oedematous human corneas: histological, immunochemical and X-ray diffraction evidence. Tissue Cell. 1991;23:593–606. doi: 10.1016/0040-8166(91)90016-m. [DOI] [PubMed] [Google Scholar]
- Schmucker C, Schaeffel F. In vivo biometry in the mouse eye with low coherence interferometry. Vision Res. 2004;44:2445–2456. doi: 10.1016/j.visres.2004.05.018. [DOI] [PubMed] [Google Scholar]
- Song J, Lee YG, Houston J, Petroll WM, Chakravarti S, Cavanagh HD, Jester JV. Neonatal corneal stromal development in the normal and lumican-deficient mouse. Invest Ophthalmol Vis Sci. 2003;44:548–557. doi: 10.1167/iovs.02-0592. [DOI] [PMC free article] [PubMed] [Google Scholar]
- Wendt KD, Jensen CA, Tindall R, Katz ML. Comparison of conventional and microwave-assisted processing of mouse retinas for transmission electron microscopy. J Microsc. 2004;214:80–88. doi: 10.1111/j.0022-2720.2004.01310.x. [DOI] [PubMed] [Google Scholar]
- Zhou X, Shen M, Xie J, Wang J, Jiang L, Pan M, Qu J, Lu F. The development of the refractive status and ocular growth in C57BL/6 mice. Invest Ophthalmol Vis Sci. 2008;49:5208–5214. doi: 10.1167/iovs.07-1545. [DOI] [PubMed] [Google Scholar]
- Zieske JD. Corneal development associated with eyelid opening. Int J Dev Biol. 2004;48:903–911. doi: 10.1387/ijdb.041860jz. [DOI] [PubMed] [Google Scholar]