Abstract
We present a method for correcting coherence gate curvature caused by scanning-induced path length variations in spectral-domain high-NA optical coherence imaging systems. These variations cause curvature artifacts in optical coherence tomography and effectively restrict the field of view in optical coherence microscopy (OCM). Here we show that the coherence gate curvature can be measured and corrected by recovering the phase of the analytic signal from a calibration image. This phase information can be used directly to process OCM images allowing the coherence gate curvature, as well as any order of system dispersion, to be corrected in a computationally efficient manner. We also discuss the use of various image quality metrics that can be used to adjust the calibrated phase in order to keep the coherence and confocal gates aligned in tissue.
Since the introduction of optical coherence tomography (OCT), various beam delivery designs have been developed to accommodate different applications and variations of OCT. Some of these designs are non-telecentric, meaning that the backfocal plane of the scan lens does not coincide to the pivot of the scanning mechanism. Scanning of the beam in a nontelecentric system results in path length variations, which cause a shift in the coherence gate across the field of view. Even in systems that are designed to be telecentric, it is often difficult to achieve perfect alignment to completely eliminate path length variations, especially in more complex designs with multiple lenses and galvanometers [1]. Curvature of the coherence gate results in curvature artifacts in OCT images and restricts the field of view in optical coherence microscopy (OCM) by causing a separation of the coherence and confocal gates [2]. While coherence gate curvature can be largely ignored in low-NA systems, it is notably problematic for high-NA systems and phase-sensitive techniques.
OCM is an imaging technique that uses coherence gating to perform optical sectioning [3], and frequently augments the spatial confocal gating in confocal microscopy. Although not all OCM systems utilize very high NA, it is often needed in order to maximize resolution or to enable integration with other imaging modalities, such as multi-photon microscopy (MPM) [4]. High-NA OCM systems ideally utilize nontelecentric sample arm designs in order to fill the back aperture of the objective lens without clipping the beam during scanning. The coherence gate curvature results in nonuniform image intensity and resolution, effectively limiting the field of view. High-NA OCM systems have typically avoided these aberrations by acquiring images with stage scanning [5], limiting the field of view [6], or using a common path interferometer [7]. However, all of these approaches greatly limit the practical use of this technique.
In this Letter, we present a method for correcting coherence gate curvature in spectral-domain low-coherence imaging systems. By recovering the phase of the analytic signal from a calibration image, path length variations caused by beam scanning can be compensated. In OCM, this phase information can be directly utilized to extract the optimal en face image in a computationally efficient manner. In addition, utilizing the phase inherently corrects any order of dispersion and spectrometer nonlinearity, eliminating an additional processing step. While we focus on the use of this technique for OCM, we note that it can also be used to correct for phase variations in phase-sensitive techniques, such as interferometric synthetic aperture microscopy [8], as well as for correcting curvature artifacts in high-NA OCT systems.
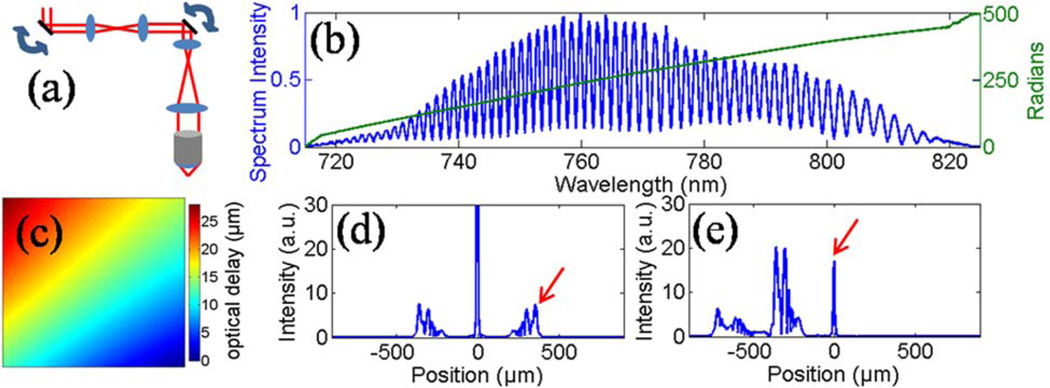
A schematic of a simplified nontelecentric system is shown in Fig. 1(a). As the beam pivots around the input aperture, the optical path length to the flat focal plane increases. Two-dimensional scanning of the beam results in a curved coherence gate, which has a circular pattern [Fig. 1(b)]. Figure 1(c) plots the maximum path length variation across a fixed field of view as well as the Rayleigh range of the focused beam for different focal lengths of the lens. These values were calculated by tracing of the chief ray in this simple single lens system. Fixed values of 500 µm for the field of view (FOV) and 15 mm for the input beam diameter were used. True high-NA focusing optics are significantly more complex than a single lens and, thus, these values are only approximations. Nonetheless, the simple lens example demonstrates why high-NA systems experience the most dramatic coherence gate curvature artifacts. In this study, we demonstrate correction of coherence gate curvature for an integrated MPM and spectral-domain OCM system that has been previously described [9]. The sample arm consists of a pair of galvanometers separated by a 1:1 telescope, followed by a beam-expanding telescope that fills the back aperture of a 20×, 0.95 NA water immersion objective (Olympus, Inc.) with an effective focal length of 9 mm [Fig. 2(a)].
Fig. 1.
(Color online) (a) Schematic for a simplified non-telecentric beam-scanning system. The dotted gray line shows the flat focal plane, while the dashed gray curve shows the curved coherence gate. (b) Scanning in two dimensions results in a circular pattern of path length variations across the field of view. (c) The calculated maximum path length difference plane across a fixed FOV (solid blue curve) and the Rayleigh range of the focused beam as a function of the focal length (dashed red curve).
Fig. 2.
(Color online) (a) Schematic of the sample arm. (b) The spectral interference pattern and the unwrapped phase of the analytic signal with a mirror at the focus of the sample arm. (c) Image mapping the optical delay to the focal plane, showing the curvature of the coherence gate caused by scanning over an ~200 µm FOV. (d) FFT of the raw spectrum. (e) FFT after multiplying the spectrum by the conjugate of the measured spectral phase profile. The arrows indicate the focus depth.
The method of coherence gate curvature correction is based on characterizing the system by using a mirror in the sample arm positioned in the beam focus and aligned to maximize collection of the backreflected light. An image of the mirror allows the two-dimensional coherence gate curvature to be measured. This is accomplished by obtaining the phase of the analytic signal of the interference pattern at each position of the beam via the Hilbert transform after subtraction of the background. The interference and the unwrapped phase profile for a single axial scan are shown in Fig. 2(b). The phase profile consists of a linear portion, which corresponds to the optical delay, and higher-order terms, which are caused by dispersion. The coherence gate curvature is shown in Fig. 2(c) by mapping the slope of linear portion of the phase profile for each position of the beam. The pattern is not circular, as would be expected from Fig. 1 due to imperfect alignment of the pairs of telescopes and galvanometers.
The calibrated spectral phase profiles provide a convenient method to process OCM data. Figure 2(d) shows the FFT of the raw spectral interference pattern from the mirror without any dispersion compensation [Fig. 2(b)]. Because of high-order dispersion in this system caused by the wavelength-dependent polarization from the supercontinuum source [9], the signal from the mirror has strong sidelobes. By first multiplying the spectral interference by the conjugate of the raw calibrated phase, the scattering signal from the focus is shifted to the dc position of the FFT, in addition to simultaneously correcting any order of dispersion [Fig. 2(e)]. By using the phase profile determined at each beam position, the curved coherence gate is flattened and moved to dc, while giving the optimal axial point spread function.
The corrected en face OCM image corresponding to the focal plane can be extracted from a raw data set using the following equation:
| (1) |
where x and y represent the lateral spatial dimensions and k represents the spectrum wavenumber. A(x,y) is the OCM image, and S(x,y,k) and ϕ(x,y,k) are the raw spectrum and the raw calibrated phase profile, respectively. Each pixel of the OCM image is computed by multiplying the raw spectrum by its corresponding calibrated phase profile and summing over the wavenumber, k. This simultaneously corrects the coherence gate curvature and optimally compensates dispersion, combining the necessary processing steps to rapidly extract the optimal en face image. This method of OCM processing reduces the computational complexity from O(N log N) to O(N) for one spectrum when compared to extracting the depth corresponding to focus after taking the FFT of each spectrum by utilizing a peak find. In addition, the calibrated phase profile provides a more-accurate correction of the coherence gate than the peak find method. In our implementation of these two methods, we observed a decrease in processing time from 6.1 to 1.9 s for extracting an OCM image from the data volume (256 × 256 × 2048 pixels). The 1.9 s processing time is sufficient to enable image acquisition at a speed limited only by the frame rate of the line CCD, in this case, 32 kHz. Improvements in the implementation of this algorithm are possible if needed for line-scan cameras with faster acquisition rates or for swept source systems. Recently, a high-speed processing architecture for single-plane OCM extraction showed an improvement factor of ~30 when compared to using the FFT [10].
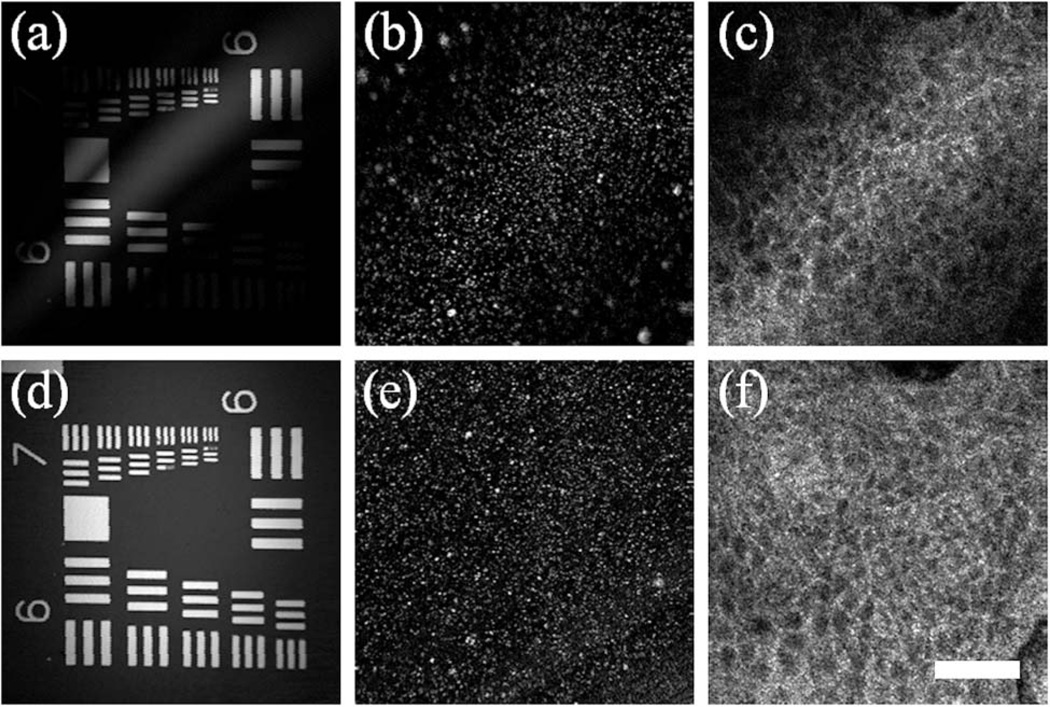
Once the phase profiles are measured from a mirror, they can be utilized for acquiring corrected images from real samples. Figure 3(a) shows an OCM image of a standard USAF resolution chart processed without correcting the path length variations. Because of the curved coherence gate, the intensity across the flat sample varies dramatically and resembles the pattern of the coherence gate curvature [Fig. 2(b)]. In Fig. 3(b), the same image is shown with the coherence gate curvature corrected. As most practical applications involve three-dimensional (3D) samples, Fig. 3(c) shows an uncorrected image of 50 nm Fe2O3 particles embedded in silicone gel. In this 3D sample, the upper left and bottom right corners correspond to areas that are not in the focal plane and, therefore, have a noticeably lower resolution and lower intensity due to blurring and attenuation, respectively, by lying outside of the confocal gate. By utilizing the calibrated phase information, the image corresponding to the focal plane is recovered, showing uniform resolution and intensity [Fig. 3(d)]. The coherence gate curvature correction is also shown for in vivo human skin epidermis images [Figs. 3(e) and 3(f)], with similar improvement to the signal strength and resolution, increasing the usable field of view.
Fig. 3.
OCM images of (a), (b) a standard USAF resolution chart, (c), (d) 50 nm Fe2O3 particles embedded in silicon gel, and (e), (f) in vivo human skin epidermis. Images are shown in (b), (d), (f) with and (a), (c), (e) without correcting the coherence gate curvature. The scale bar is 45 µm.
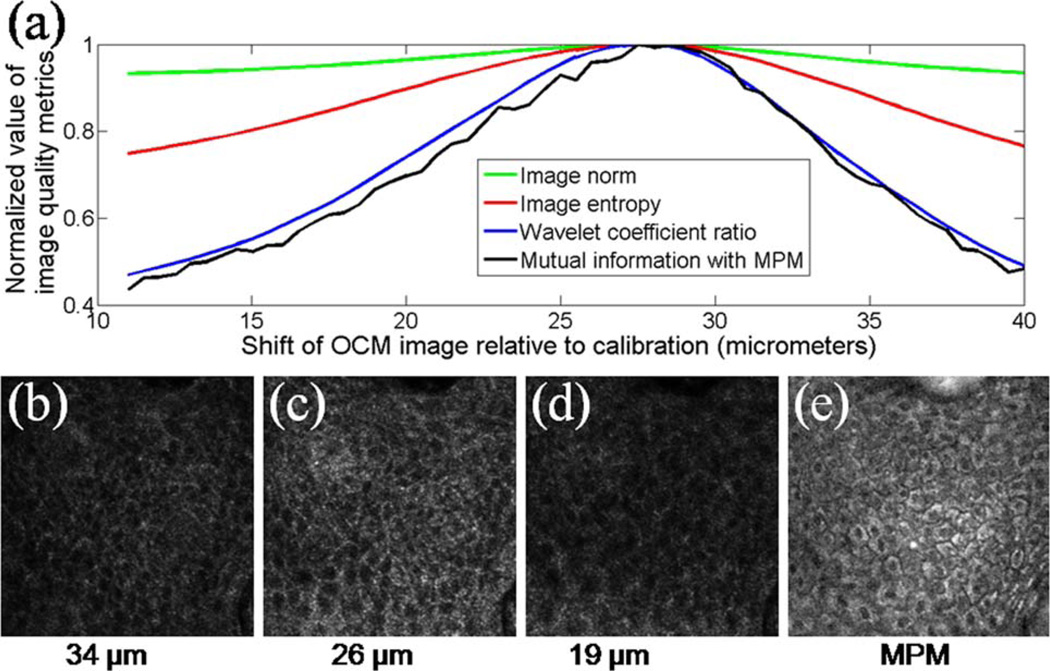
In OCM, adjustment of the coherence gate is often necessary to keep it aligned with the focal plane in tissue samples, to account for the sample refractive index [11]. We compared various image quality metrics that can be used to automatically align the confocal and coherence gates. OCM-MPM images from the epidermis of in vivo human skin were acquired. Several corrected en face OCM planes were processed at different delays by adding a linear phase ramp with varying slopes to the calibrated phase profiles. Various metrics were used on the processed OCM images to find the optical delay that corresponds to the focus. The following metrics were used: the Euclidean norm, histogram entropy, a ratio of the Debauchie wavelet coefficients [12], and mutual information with the MPM autofluorescence image. In Fig. 4(a), the normalized values of these metrics as a function of depth with respect to the calibrated focus position are plotted. The different metrics peak at roughly the same position, identifying the delay that corresponds to focus. The ratio of the wavelet coefficients and the mutual information both provide a significantly higher contrast between in-focus and out-of-focus depths and are, therefore, the best suited to implement OCM autofocusing [11]. The OCM images below, at, and above focus are shown in Figs. 4(b)–4(d), respectively. The MPM image used for the mutual information metric is shown in Fig. 4(e). This MPM image was acquired at a different depth than the OCM images because, in this system, the OCM and MPM are performed with different beams with slightly different collimations [9], leading to a shift of the focal positions.
Fig. 4.
(Color online) (a) Image quality metrics that can be used to find the depth corresponding to the focus. Metrics are plotted as a function of shift from the calibration focus for OCM images of in vivo human skin epidermis. OCM images are shown at (b) 34, (c) 26, and (d) 19 µm, along with (e) a corresponding MPM image. To reduce speckle, the OCM images in (b)–(d) are averages of three en face planes.
In conclusion, coherence gate curvature induced by beam scanning can be corrected by using the phase of the analytic signal from calibration data. For OCM, this phase information provides a convenient method to extract the optimized en face plane corresponding to the focus in a computationally efficient manner. Adjustments to the calibrated phase profiles can be made based on various image quality metrics to correct for misalignment of the coherence and confocal gate. This processing approach addresses key challenges of high-NA optical coherence microscopy and extends the feasibility of this method. This approach is also suitable for correcting scanning-induced phase variations that can be detrimental to phase-sensitive variations of OCT, as well as to correct curvature artifacts in high-NA OCT systems.
Acknowledgments
This research was supported in part by grants from the National Science Foundation (NSF) (CBET 08-52658 ARRA) and the National Institutes of Health (NIH) (RC1 CA147096, R21/R33 CA115536). Additional information can be found at http://biophotonics.illinois.edu.
References
- 1.Pircher M, Baumann B, Gotzinger E, Sattmann H, Hitzenberger CK. Opt. Lett. 2009;34:1750. doi: 10.1364/ol.34.001750. [DOI] [PMC free article] [PubMed] [Google Scholar]
- 2.Podoleanu AG, Seeger M, Dobre GM, Webb DJ, Jackson DA, Fitzke FW. J. Biomed. Opt. 1998;3:12. doi: 10.1117/1.429859. [DOI] [PubMed] [Google Scholar]
- 3.Izatt JA, Hee MR, Owen GM, Swanson EA, Fujimoto JG. Opt. Lett. 1994;19:590. doi: 10.1364/ol.19.000590. [DOI] [PubMed] [Google Scholar]
- 4.Beaurepaire E, Moreaux L, Amblard F, Mertz J. Opt. Lett. 1999;24:969. doi: 10.1364/ol.24.000969. [DOI] [PubMed] [Google Scholar]
- 5.Vinegoni C, Ralston T, Tan W, Luo W, Marks DL, Boppart SA. Appl. Phys. Lett. 2006;88:053901. [Google Scholar]
- 6.Tang S, Krasieva TB, Chen Z, Tromberg BJ. J. Biomed. Opt. 2006;11:020502. doi: 10.1117/1.2193428. [DOI] [PubMed] [Google Scholar]
- 7.Joo C, Kim KH, de Boer JF. Opt. Lett. 2007;32:623. doi: 10.1364/ol.32.000623. [DOI] [PubMed] [Google Scholar]
- 8.Ralston TS, Marks DL, Carney PS, Boppart SA. Nature Phys. 2007;3:129. doi: 10.1038/nphys514. [DOI] [PMC free article] [PubMed] [Google Scholar]
- 9.Graf BW, Jiang Z, Tu H, Boppart SA. J. Biomed. Opt. 2009;14:034019. doi: 10.1117/1.3147422. [DOI] [PMC free article] [PubMed] [Google Scholar]
- 10.Chelliyil RG, Ralston TS, Marks DL, Boppart SA. J. Biomed. Opt. 2008;13:044013. doi: 10.1117/1.2960018. [DOI] [PMC free article] [PubMed] [Google Scholar]
- 11.Aguirre AD, Sawinski J, Huang SW, Zhou C, Denk W, Fujimoto JG. Opt. Express. 2010;18:4222. doi: 10.1364/OE.18.004222. [DOI] [PMC free article] [PubMed] [Google Scholar]
- 12.Kautsky J, Flusser J, Zitova B, Simberova S. Pattern Recogn. Lett. 2002;23:1785. [Google Scholar]


