

Abstract
Background
The genetic architecture of body weight and body composition is complex because these traits are normally influenced by multiple genes and their interactions, even after controlling for the environment. Bayesian methodology provides an efficient way of estimating these interactions.
Subjects and measurements
We used Bayesian model selection techniques to estimate the effect of epistatic interactions on age-related body weight (at 3, 6, and 10 weeks) and body composition (organ weights and fat-related traits) in an F2 sample obtained from a cross between high-growth (M16i) mice and low-growth (L6) mice.
Results
We observed epistatic and main-effect quantitative trait loci (QTL) that controlled both body weight and body composition. Epistatic effects were generally more significant for WK3 and WK6 than WK10. Chromosomes 5 and 13 interacted strongly to control body weight at 3 weeks. A pleiotropic QTL on chromosome 2 was associated with body weight and some body composition phenotypes. Testis weight was regulated by a QTL on chromosome 13 with a significantly large main effect.
Conclusion
By analyzing epistatic interactions, we detected QTL not found in a previous analysis of this mouse population. Hence, the detection of gene-gene interactions may provide new information about the genetic architecture of complex obesity-related traits and may lead to the detection of additional obesity genes.
Keywords: Bayesian methods, body weight, epistasis, obesity, quantitative trait loci
Introduction
Body weight and other obesity-related phenotypes are complex traits that are controlled by both genetic and environmental factors.1-3 The genetic factors controlling growth, body weight, and body composition are complex and age-dependent.4-10 In chickens and mice, for example, different sets of quantitative trait loci (QTL) affect early and late growth. Gene-gene interactions also vary with age and may be more important than main effects during early growth.6,11 Hence, epistasis plays a significant role in the genetics of growth and body composition.8 Including epistatic interactions in QTL analysis may lead to the detection of QTL with weak marginal effects but strong interactive effects and thereby improve our understanding of the etiology of obesity as well as the genetic factors that underlie other complex traits.
Traditional statistical methods have been used for detecting epistasis,7,12 but detecting epistasis becomes increasingly difficult as the number of QTL increases. In addition, conventional methods use two-QTL models for detecting gene-gene interactions.13,14 In contrast, statistical inferences in a Bayesian framework are based on the joint posterior distribution of all unknowns in the model given the observed data.3 These unknowns, which can include the number and locations of QTL as well as their main and epistatic effects, can be estimated by generating posterior samples from the joint posterior distribution. A Bayesian model selection technique for identifying epistatic QTL for complex traits has been developed.15 Bayesian methods provide an efficient and relatively simple way of estimating these effects.
The mouse sample used in this study was derived from parental lines selected for high 3–6-week body weight gain (M16i) and low 6-week body weight gain (L6). Initial studies on this sample involved the use of composite interval mapping and focused mainly on detecting main effects.9,16 Significant QTL effects were observed for growth on chromosomes 1, 3, 6, 10, 11, and 17; chromosomes 2, 15, and 17 were the most important for obesity-related phenotypes. However, few epistatic interactions were detected. A recent study used Bayesian techniques for detecting epistasis in a backcross sample derived from other mouse lines10 QTL with main and epistatic effects were detected for growth and body composition on several chromosomes. Perhaps not surprisingly, no main-effect QTL were present at all ages and the effect of epistasis differed with age. Some QTL had pleiotropic effects on growth and body composition. However, that study used a backcross population, which only allowed the detection of additive effects and additive-additive interactions.
Our objectives were to determine the effect of gene-gene interactions on growth and body composition in an F2 mouse population using Bayesian model selection techniques and to ascertain the changes in these epistatic effects with increases in body weight during development.
Materials and Methods
Mouse sample
Details on the mouse population, marker genotyping, and trait phenotypes were provided previously;9,16 a summary is provided here. A total of 993 mice were bred from two lines of mice selected for increased 3–6 week weight gain (M16i) and low 6-week weight (L6). The M16i line was derived from an outbred ICR population whereas the L6 line was derived from a cross of four inbred lines. L6 males were mated with M16i females; the resulting F1 mice were inter se mated (no full-sib pairings) in two consecutive replicates encompassing a total of 64 full-sib F2 families.9,16 These mice were reared at 21°C in a 12:12h light:dark cycle and 55% relative humidity. Food and water were supplied ad libitum. All animals were handled according to Institutional Animal Care and Use Committee guidelines.
Body weight was recorded for all F2 mice at weeks 3 (WK3), 6 (WK6), and 10 (WK10). Tail length (TAIL) was measured at week 10 as an indicator of skeletal growth; the mice were then euthanized by cervical dislocation. Wet weights of the heart (HRT), liver (LIV), spleen (SPL), right kidney (KID), right testis (TES), right hind limb subcutaneous fat pad (SCF), and right epididymal fat pad (EPF) were recorded. Empty body weight (EBW), or body weight without ingesta, was also recorded. The trait FAT was calculated as the sum of SCF and EPF. Body composition traits were only recorded for males. The spleen was used for DNA extraction.
Marker genotyping
We genotyped 63 fully informative microsatellite markers spanning the 19 autosomes. The marker linkage map covered 1200 cM (Kosambi) with an average spacing of 28 cM. Marker genotypes were determined by polymerase chain reaction and agarose gel electrophoresis. A dominant marker at the Ped locus was genotyped in the F2 mice to determine whether one or two M16i alleles were present. Segregation distortion was evaluated by chi-square testing. Detection and correction of genotyping errors was conducted with MAPMAKER.17 Linkage maps were generated with MAPMAKER/EXP and QTL analysis was carried out after marker distances were estimated.
Statistical analysis
The 13 phenotypes described above were analyzed using the Bayesian model selection method.15,18 These Bayesian methods were implemented in the freely available package R/qtlbim.19 Our Bayesian procedure proceeded as follows. We partitioned each chromosome into 1-cM grids, resulting in 1200 possible loci across the genome. These preset loci were considered as possible positions of QTL. Before mapping QTL, we calculated the probabilities of genotypes at these preset loci given the observed marker data. We placed an upper bound on the number of QTL included in the model for each trait. This upper bound was chosen based on the number of significant QTL detected in the traditional interval mapping.15 For most of the traits analyzed, the upper bound was 20. We simultaneously modeled main (additive and dominance) effects of QTL, epistatic (additive-additive, additive-dominance, dominance-additive, and dominance-dominance) effects of QTL, and effects of environmental variables (covariates). We used Cockerham's genetic model to construct main effects of QTL and epistatic interactions between QTL and we applied conventional methods used in hierarchical linear models to construct environmental effects.15,18 We included covariates in the model: the replicate and sex indicators was treated as fixed binary covariate and the family indicator was treated as a categorical random covariate in the analysis of growth traits. Body composition traits were corrected for body weight at WK10. The priors on each parameter were specified.15,18 The Bayesian model selection framework enabled us to simultaneously infer the number and positions of multiple QTL and their main and epistatic effects.
We fit the models using R/qtlbim,19 which implements the Markov chain Monte Carlo (MCMC) algorithm.18 The MCMC algorithm generates posterior samples from the joint posterior distribution of all parameters in the model, proceeding by sampling each parameter from its conditional posterior distribution using the latest values of all other unknowns and the observed data. Each iteration of the MCMC algorithm cycles through all elements of the unknowns. This process continues for many iterations to obtain random samples from the joint posterior distribution.
For each analysis, the MCMC sampler was run for 1.2×10⁵ iterations after the first 1,000 iterations as burn-in were discarded. To reduce serial correlation in the stored samples, the chain was thinned by one in k = 40, yielding 3×10³ samples for posterior analysis. Convergence diagnostics and mixing behavior assessed using graphical and numerical methods provided by R/qtlbim showed that the chains converged and mixed well.
We used various methods to graphically and numerically summarize and interpret the posterior samples. The posterior inclusion probability for each locus was estimated as its frequency in the posterior samples. Each locus may be included in the model through its main effects and/or interactions with other loci (epistasis). The larger the effect size for a locus, the more frequently the locus is sampled. Taking the prior probability into consideration, we used the Bayes factor (BF) to show evidence for inclusion against exclusion of a locus. The Bayes factor for a locus is defined as the ratio of the posterior odds to the prior odds for inclusion against exclusion of the locus. Traditionally, a BF threshold of 3, or 2loge (BF) = 2.1, supports a claim of significance.20 We can separately estimate the posterior inclusion probability and corresponding Bayes factors of main effects and epistasis. The genetic effects and the proportions of phenotypic variance explained by the different effects were also estimated.
Results
Main-effect QTL
Bayesian analysis detected significant main-effect QTL for body weight at weeks 3, 6 and 10, as well as TAIL on several chromosomes. Significant main effects for WK3 explained ∼2-4% of the phenotypic variance and were detected on chromosomes 2, 3, 6, 8 and 11. Significant main effects on chromosomes 2 and 3 explained the highest proportion of the phenotypic variance for WK6. Main effects accounted for ∼2 to 8% of the variance for body weight at week 10. A QTL on chromosome 19 with marginal effects on WK3 was not observed in older mice. Also, a main effect QTL on chromosome 6 was associated with WK3 and WK6 but not with WK10. A pleiotropic QTL on chromosome 2 had significant effects on all growth-related traits.
Several QTL with marginal effects on organ and empty body weight (EBW) were detected on many chromosomes. Main effects ranged from ∼ 0.2 to 10% of the variance. Overall, a strong main-effect QTL for TES on chromosome 13 explained the highest proportion of the variance (∼10%). A pleiotropic QTL on chromosome 2 with main effects on body weight at weeks 3, 6 and 10 was also associated with heart weight. Pleiotropic effects were also detected for a QTL on chromosome 9 for HRT and SPL. When WK10 was excluded as a covariate from the model, EBW explained the highest proportion of the variance for main effects (∼80%). Furthermore, a significant QTL on chromosome 2 had pleiotropic effects on HRT, LIV, SPL and KID.
A number of significant QTL for SCF, EPF, and FAT were detected. Quantitative trait loci with marginal and pleiotropic effects on EPF and FAT were located on chromosomes 2 and 14. The phenotypic variance of SCF was largely explained by a main effect QTL on chromosome 10.
QTL with epistatic effects
Epistasis had significant effects on growth in young mice on chromosomes 4, 9 and 11 (Figure 1). Age-related epistatic effects were observed in this study. For instance, an epistatic QTL on chromosome 4 was not significant at other ages. Similarly, epistatic QTL on chromosomes 10 and 12 were only associated with WK6. Nevertheless, a QTL on chromosome 11 had significant effects at all ages. Figure 2 demonstrates the effects of epistatic QTL on all chromosomes for WK3. Early growth was mostly influenced by dominance-dominance effects. Additive-dominance and dominance-additive effects were observed on chromosomes 5 and 13. No additive-additive effects were detected. Where strong epistasis was detected, further analysis was conducted to determine the strength of gene-gene interactions among chromosomes. A strong interactive effect was observed between chromosomes 5 and 13 for week 3 body weight (Figure 4A).
Figure 1.
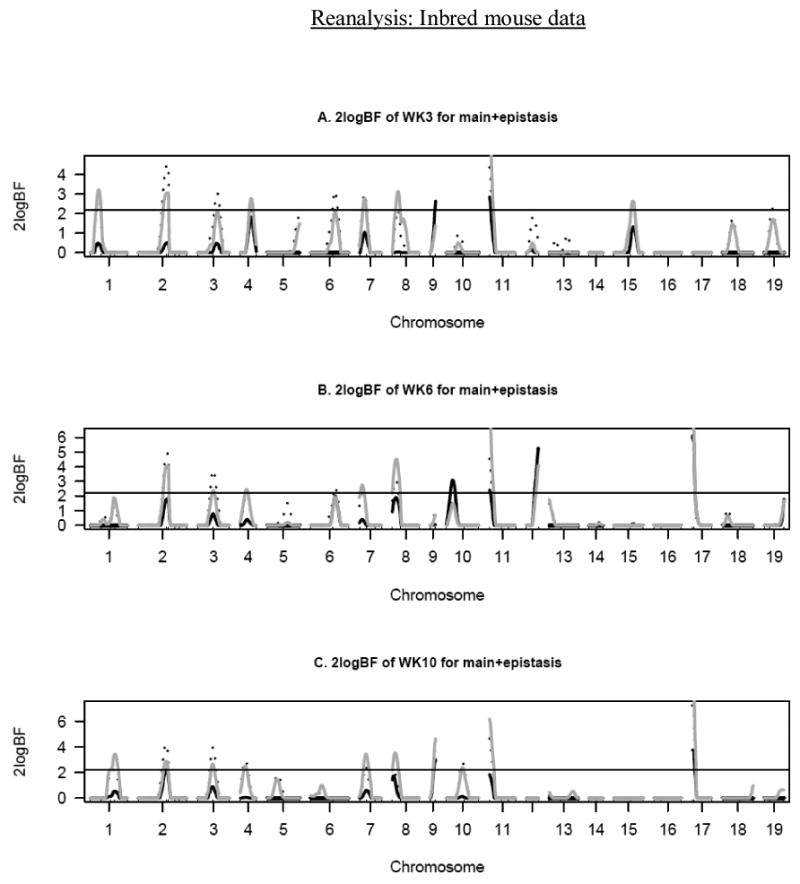
One-dimensional profiles of Bayes factors rescaled as 2logeBF for main (dotted black lines), epistatic effects (solid black lines) and sex-specific effects (solid grey lines). A: body weight at week 3 (WK3), B: body weight at week 6 (WK6), C: body weight at week 10 (WK10). The horizontal lines represent the significance threshold of 2logeBF = 2.1.
Figure 2.
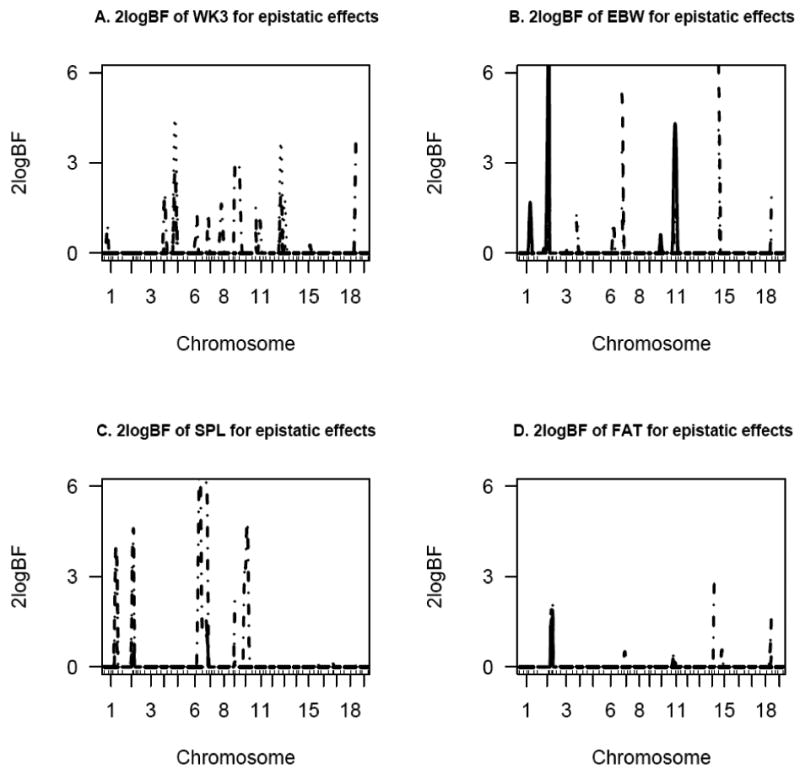
One dimensional profiles of Bayes factors rescaled as 2logeBF for WK3, EBW, SPL, and FAT for selected chromosomes for epistatic effects – solid, dashed, dotted and solid-dotted lines represent additive-additive, additive-dominance, dominance-additive and dominance-dominance effects, respectively.
Figure 4.
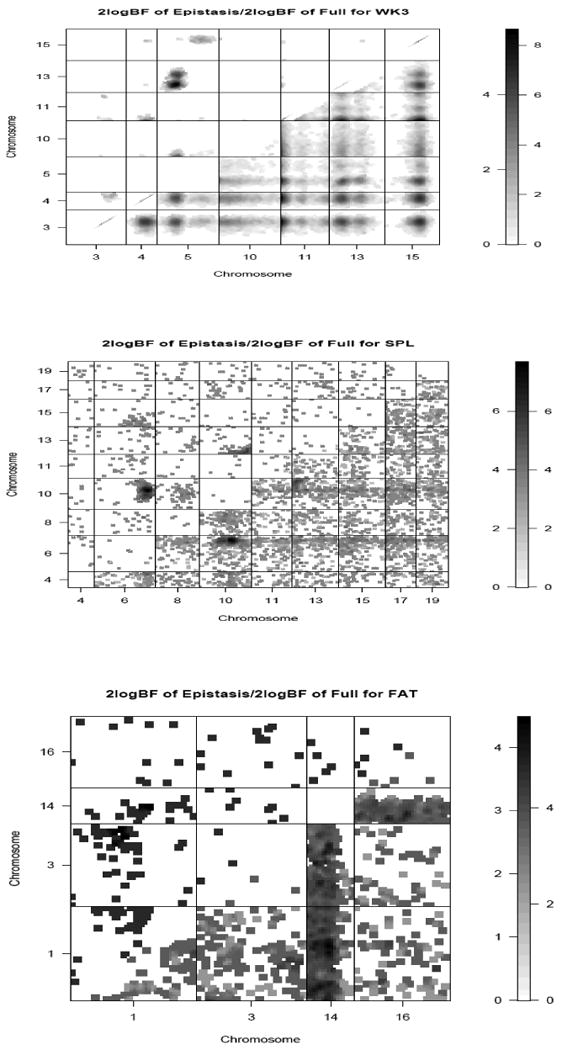
Two-dimensional profiles of Bayes factors (rescaled as 2logeBF) for WK3, SPL, and FAT for selected chromosomes. The upper diagonal shows the Bayes factor for the epistatic model, the lower diagonal shows the Bayes factor for the full model with epistasis compared with no QTL.
Epistasis played a significant role in the regulation of EBW, SPL and FAT (Figure 2). Several additive-additive, additive-dominance and dominance-additive effects were detected for EBW. Spleen weight was influenced by significant (BF > 4) dominance-dominance effects on chromosomes 6, 7 and 10 (Figure 2C). Other interactive effects were identified on chromosomes 1, 2, 7 and 9. The only additive-additive effect for FAT was detected on chromosome 2 which was also associated with other epistatic effects. Additionally, a strong dominance-dominance effect was observed for this trait on chromosome 14. When organ weights were adjusted for body weight at week 10, no epistatic effects were identified for EBW (Figure 3A). For SPL, correcting for WK10 resulted in the detection of few epistatic effects. Fat weight was mainly associated with additive-additive and dominance-dominance effects (Figure 3C). An interactive effect was observed between QTL on chromosomes 6 and 10 for SPL (Figure 4B).
Figure 3.
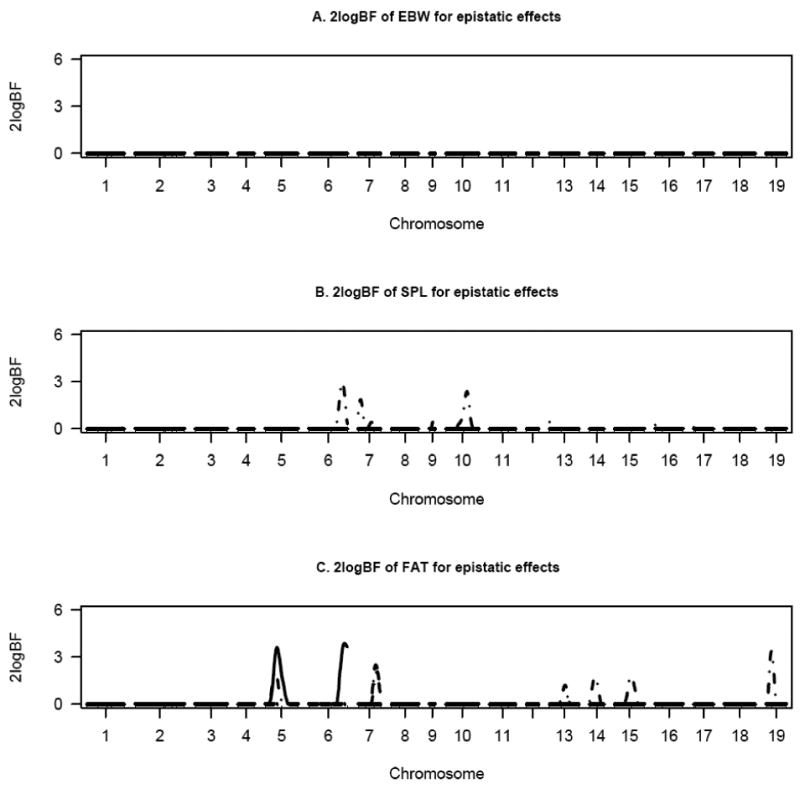
One dimensional profiles of Bayes factors rescaled as 2logeBF for WK3, EBW, SPL, and FAT (adjusted for final body weight) for selected chromosomes for epistatic effects – solid, dashed, dotted and solid-dotted lines represent additive-additive, additive-dominance, dominance-additive and dominance-dominance effects, respectively.
Sex-specific effects
Significant sex-dependent QTL were detected on several chromosomes. A sex-specific QTL on chromosome 11 was detected for all ages and explained ∼2-4% of the phenotypic variance. A significant sex-specific QTL on chromosome 15 was only associated with WK3. No sexual dimorphism was observed for body weight on chromosomes 14 and 16.
Discussion
Growth and body composition are complex traits that are controlled by multiple loci that interact with each other as well as with the environment. The detection of these interrelationships by conventional QTL mapping methods becomes complex as the number of interactions increases. This study used a Bayesian model selection method15 for the joint estimation of the number and position of QTL associated with growth, obesity, and body composition and their main and epistatic effects. These parameters were estimated by assigning prior distributions to all unknowns in the model and then generating a joint posterior distribution of all unknown variables.
Growth, age-related BW, and TAIL
Many main-effect, epistatic and sex-specific QTL were associated with BW at weeks 3, 6, and 10. A QTL on chromosome 2 had significant marginal effects on body weight at all ages. Other studies showed that chromosome 2 plays a significant role in the genetics of growth, body weight, and body composition regardless of the founding population or type of cross, indicating that this QTL has a strong main effect on body weight.3,10,21-23
Previous studies on this population using non-Bayesian statistical methods detected few epistatic interactions among growth QTL.9 However, the existence of these effects was evident in that work, especially for week-3 body weight. In addition, some studies have detected strong epistatic effects for growth using other mouse crosses.24,25 Our use of Bayesian analysis led to the detection of strong gene-by-gene interactions for BW at week 3. For instance, we detected epistatic QTL with strong effects on chromosomes 5 and 13, which were not identified in the previous analysis. The epistatic interaction between these two chromosomes explained a significant proportion of the phenotypic variance. The additional growth QTL detected in this study (compared to the study by Rocha et al. 2004) may be the result of our use of Bayesian methods.
Several studies have reported differences in the genetic control of early and late growth.4-6 Such differences are not unusual because there is a relatively low genetic correlation between early and late growth.4,26 Growth dynamics are made more complex by the significance of gene-by-gene interactions differing at various ages.4,6 This phenomenon was evident in our study. A QTL on chromosome 2 was significantly associated with growth at all ages but epistatic effects were more significant for late growth than early growth at this locus. These results for chromosome 2 confirm the results by Yi et al.10 who detected a higher level of epistasis in older mice using a backcross population that also used M16i as one of the parental strains. Nevertheless, our results generally indicate a stronger effect of epistasis at early ages than later ages.
A main-effect QTL on chromosome 6 was associated with WK3 and WK6 but not WK10. Similarly, an epistatic QTL on chromosome 4 was only detected for WK3. These findings are consistent with those of other workers who detected separate sets of main-effect QTL for early and late growth in mice.5,10
A QTL that explained 20% of the phenotypic variance for tail length was observed on chromosome 1.30 We identified main and epistatic QTL for TAIL on chromosomes 3 and 13 these only explained a very small proportion of the variance (< 2%).
Organ weights
Many chromosomes were significantly associated with main-effect and epistatic QTL for organ weight. When organ weights were unadjusted for WK10, a QTL on chromosome 2 was significantly associated with HRT, LIV, KID and SPL. However, the inclusion of final body weight as a covariate removed this pleiotropic effect hence separate sets of QTL may regulate organ weight adjusted and unadjusted for body weight.16 Results from a number of studies showed that a high phenotypic correlation exists among weights of liver, heart, kidney, and spleen.25,27 Similar observations were made by other researchers using the same mouse population used here.16 Furthermore, two QTL located at two separate regions on chromosome 2 had pleiotropic effects on all four traits.16 Nevertheless, different genes may be involved in the regulation of these phenotypes.
Several QTL with substantial (2log BF>2) epistatic effects on organ weight were detected by the Bayesian model selection method. Others also showed the effect of epistasis on organ weight.7 These workers located several epistatic QTL for growth and body composition by simultaneous interval mapping and observed that epistasis explains a significant proportion of the genetic variance for fat-related phenotypes, kidney and spleen weight, but not liver weight; marginal effects were detected on chromosomes 5, 7, and 9 for liver weight. For kidney weight, marginal effects were detected on chromosomes 2 and 7, and epistasis was observed on chromosomes 1, 2, 9, and 15. For spleen weight, epistatic and main-effect QTL were observed on chromosomes 1, 10, 11, 12, and 16. Significant interactions among loci were observed for organ-related QTL. Overall, our findings were somewhat different except for a few chromosomes. Observations for marginal HRT QTL were similar to other 16 for chromosomes 2 and 10. However, we detected additional QTL on chromosomes 4 and 9. These differences in results for HRT, LIV, KID, and SPL may be attributed to differences in the mouse crosses and/or statistical methods.
We found a QTL with a very significant effect (2logBF >12) on TES on chromosome 13. Other authors located highly significant 9,28 and suggestive QTL 29 for testis weight on the same chromosome.
Fat-related loci
Main-effect and epistatic QTL for fat were detected using the multiple regression method.25 These effects as well as pleiotropy accounted for 63% of the phenotypic variance in an F2 mouse population. QTL with significant main effects on fat-related traits were detected by composite interval mapping in the same population as that used in this study, but no epistatic interactions were detected.16 We located several QTL with interactive effects on EPF and FAT in this cross. The epistatic effect of the loci on chromosomes 5, 6 and 7 explained a large proportion of the phenotypic variance for EPF and FAT. A main-effect QTL for fat traits was observed on chromosome 5 by adjusting for week-12 body weight.10
No QTL were detected on chromosome 15 for SPF and EPF. Also, this chromosome had a small effect on FAT (2logBF< 2). An association between strongly interactive QTL on chromosome 15 and body fat was observed in several studies.3,7,10,31 QTL with strong marginal effects on body fat were also detected on this chromosome.16,32 Some authors indicated that results obtained from studies on epistasis depend on the statistical method used.7 The differences in results may also be attributed to differences in the genetic background of the mice and environmental effects.
We observed a number of QTL with pleiotropic effects on body weight and body fat. For example, the QTL on chromosome 2 was associated all body weight and some fat and organ-related phenotypes. The pleiotropic effect of QTL on body fat and body weight was reported in several studies for diverse mouse populations. For example, a pleiotropic QTL for fat and body weight was observed on chromosome 2 from a cross of NZB/BINJ and SM/J mice.21 Others detected a QTL with similar effects on chromosomes 7 and 11 in an F2 population of DU6i × DBA/2 mice.25 Body weight and body fat were found to be highly correlated.16
Conclusion
Using the Bayesian model selection method, we detected several QTL with main, epistatic and sex-specific effects on body weight and obesity-related phenotypes. When this population was used for the detection of QTL for similar traits using the composite interval mapping method, very few epistatic interactions were identified. The use of Bayesian model selection detected many QTL with marginal and epistatic effects as well as epistatic interactions among chromosomes. The detection of epistatic interactions provides new information about the genetic factors underlying body weight and other obesity-related phenotypes and may lead to the detection of other obesity genes.
Acknowledgments
This research was partly supported by National Institutes of Health Grants GM069430, DK056336, and HL072757.
References
- 1.Comuzzie AG, Allison DB. The search for human obesity genes. Science. 1998;280:1374–1377. doi: 10.1126/science.280.5368.1374. [DOI] [PubMed] [Google Scholar]
- 2.Tiwari HK, Allison DB. Do allelic variants of SLC6A14 predispose to obesity? J Clin Invest. 2003;112:1633–1636. doi: 10.1172/JCI20448. [DOI] [PMC free article] [PubMed] [Google Scholar]
- 3.Yi N, Diament A, Chiu S, et al. Characterization of epistasis influencing complex spontaneous obesity in the BSB model. Genetics. 2004;167:399–409. doi: 10.1534/genetics.167.1.399. [DOI] [PMC free article] [PubMed] [Google Scholar]
- 4.Cheverud JM, Routman EJ, Duarte FAM, van Swinderen B, Cothran K, Perel C. Quantitative trait loci for murine growth. Genetics. 1996;142:1305–1319. doi: 10.1093/genetics/142.4.1305. [DOI] [PMC free article] [PubMed] [Google Scholar]
- 5.Vaughn TT, Pletscher LS, Peripato A, et al. Mapping quantitative trait loci for murine growth: a closer look at genetic architecture. Genet Res. 1999;74:313–322. doi: 10.1017/s0016672399004103. [DOI] [PubMed] [Google Scholar]
- 6.Carlborg O, Kerje S, Schutz K, Jacobsson L, Jensen P, Andersson L. A global search reveals epistatic interaction between QTL for early growth in the chicken. Genome Res. 2003;13:413–421. doi: 10.1101/gr.528003. [DOI] [PMC free article] [PubMed] [Google Scholar]
- 7.Carlborg O, Brockmann GA, Haley CS. Simultaneous mapping of epistatic QTL in DU6i × DBA/2 mice. Mamm Genome. 2005;16:481–494. doi: 10.1007/s00335-004-2425-4. [DOI] [PubMed] [Google Scholar]
- 8.Segal NL, Allison DB. Twins and virtual twins: bases of relative body weight revisited. Int J Obes. 2002;26:437–441. doi: 10.1038/sj.ijo.0801941. [DOI] [PubMed] [Google Scholar]
- 9.Rocha JL, Eisen EJ, Van Vleck LD, Pomp D. A large-sample QTL study in mice: I. Growth. Mamm Genome. 2004;15:83–99. doi: 10.1007/s00335-003-2312-x. [DOI] [PubMed] [Google Scholar]
- 10.Yi N, Zinniel DK, Kim K, et al. Bayesian analysis of multiple epistatic QTL models for body weight and body composition in mice. Genet Res. 2006;87:45–60. doi: 10.1017/S0016672306007944. [DOI] [PMC free article] [PubMed] [Google Scholar]
- 11.Ishikawa A, Hatada S, Nagamine Y, Namikawa T. Further mapping of quantitative trait loci for postnatal growth in an intersubspecific backcross of wild Mus musculus castaneus and C57BL/6J mice. Genet Res. 2005;85:127–137. doi: 10.1017/S001667230500738X. [DOI] [PubMed] [Google Scholar]
- 12.Fijneman RJ, De Vries SS, Jansen RC, Dermant P. Complex interactions of new quantitative trait loci, Sluc1, Sluc2, Sluc3, and Sluc4, that influence the susceptibility to lung cancer in the mouse. Nat Genet. 1996;14:465–467. doi: 10.1038/ng1296-465. [DOI] [PubMed] [Google Scholar]
- 13.Boer MP, ter Braak CJF, Jansen RC. A penalized likelihood method for mapping epistatic quantitative trait loci with one-dimensional genome searches. Genetics. 2002;162:951–960. doi: 10.1093/genetics/162.2.951. [DOI] [PMC free article] [PubMed] [Google Scholar]
- 14.Kao CH, Zeng ZB. Modeling epistasis of quantitative trait loci using Cockerham's model. Genetics. 2002;160:1243–1261. doi: 10.1093/genetics/160.3.1243. [DOI] [PMC free article] [PubMed] [Google Scholar]
- 15.Yi N, Yandell BS, Churchill GA, Allison DB, Eisen EJ, Pomp D. Bayesian model selection for genome-wide epistatic quantitative trait loci analysis. Genetics. 2005;170:1333–1344. doi: 10.1534/genetics.104.040386. [DOI] [PMC free article] [PubMed] [Google Scholar]
- 16.Rocha JL, Eisen EJ, Van Vleck LD, Pomp D. A large-sample QTL study in mice: II. Body composition. Mamm Genome. 2004;14:100–113. doi: 10.1007/s00335-003-2308-6. [DOI] [PubMed] [Google Scholar]
- 17.Paterson A, Lander E, Lincoln S, Hewitt J, Peterson S, Tanksley S. Resolution of Quantitative Traits into Mendelian Factors Using a Complete RFLP Linkage Map. Nature. 1988;335:721–726. doi: 10.1038/335721a0. [DOI] [PubMed] [Google Scholar]
- 18.Yi N, Shriner D, Banerjee S, Mehta T, Pomp D, Yandell BS. An efficient Bayesian model selection approach for interacting QTL models with many effects. Genetics. 2007;176:1865–1877. doi: 10.1534/genetics.107.071365. [DOI] [PMC free article] [PubMed] [Google Scholar]
- 19.Yandell BS, Mehta T, Banerjee S, et al. R/qtlbim: QTL with Bayesian interval mapping in experimental crosses. Bioinformatics. 2007;23:641–634. doi: 10.1093/bioinformatics/btm011. [DOI] [PMC free article] [PubMed] [Google Scholar]
- 20.Kass RE, Raftery AE. Bayes factors. J Am Stat Assoc. 1995;90:773–795. [Google Scholar]
- 21.Lembertas AV, Perusse L, Chagnon YC, et al. Identification of an obesity quantitative trait locus on mouse chromosome 2 and evidence of linkage to body fat and insulin on the human homologous region20q. J Clin Invest. 1997;100:1240–1247. doi: 10.1172/JCI119637. [DOI] [PMC free article] [PubMed] [Google Scholar]
- 22.Jerez-Timaure NC, Kearney F, Simpson EB, Eisen EJ, Pomp D. Characterization of QTL with major effects on fatness and growth on mouse chromosome 2. Obes Res. 2004;9:1408–1420. doi: 10.1038/oby.2004.177. [DOI] [PubMed] [Google Scholar]
- 23.Vitarius JA, Sehayek E, Breslow JL. Identification of quantitative trait loci affecting body composition in a mouse intercross. Proc Natl Acad Sci U S A. 2006;103:198690–19685. doi: 10.1073/pnas.0609232103. [DOI] [PMC free article] [PubMed] [Google Scholar]
- 24.Routman EJ, Cheverud JM. Gene effects on a quantitative trait: two-locus epistatic effects measured at microsatellites markers and at estimated QTL. Evolution. 1997;51:1654–1662. doi: 10.1111/j.1558-5646.1997.tb01488.x. [DOI] [PubMed] [Google Scholar]
- 25.Brockmann GA, Kratzsch J, Haley CS, Renne U, Schwerin M, Karle S. Single QTL effects, epistasis, and pleiotropy account for two-thirds of the phenotypic F2 variance of growth and obesity in DU6i × DBA/2 mice. Genome Res. 2000;10:1941–1957. doi: 10.1101/gr.gr1499r. [DOI] [PMC free article] [PubMed] [Google Scholar]
- 26.Abdellatif MA. Genetic study of Dandawary chickens: I. Heritabilities and genetic correlations of body weight and weight gain. Genet Sel Evol. 1989;21:81–92. [Google Scholar]
- 27.Leamy LJ, Pomp D, Eisen EJ, Cheverud JM. Pleiotropy of quantitative trait loci for organ weights and limb bone lengths mice. Physiol Genomics. 2002;10:21–29. doi: 10.1152/physiolgenomics.00018.2002. [DOI] [PubMed] [Google Scholar]
- 28.Zidek V, Musilova A, Pintir J, Simakova M, Pravenec M. Genetic dissection of testicular weight in the mouse with the BXD recombinant inbred strains. Mamm Genome. 1998;9:503–505. doi: 10.1007/s003359900808. [DOI] [PubMed] [Google Scholar]
- 29.Le Roy I, Tordjman S, Migliore-Samour D, Degrelle H, Roubertoux PL. Genetic architecture of testis and seminal vesicle weights in mice. Genetics. 2001;158:333–340. doi: 10.1093/genetics/158.1.333. [DOI] [PMC free article] [PubMed] [Google Scholar]
- 30.Morris KH, Ishakawa A, Keightley PD. Quantitative trait loci for growth traits in C57BL/6J × DBA/2J mice. Mamm Genome. 1999;10:225–228. doi: 10.1007/s003359900977. [DOI] [PubMed] [Google Scholar]
- 31.Warden CH, Fisler JS, Shoemaker SM, et al. Identification of four chromosomal loci determining obesity in a multifactorial mouse model. J Clin Invest. 1995;95:1545–1552. doi: 10.1172/JCI117827. [DOI] [PMC free article] [PubMed] [Google Scholar]
- 32.West DB, Goudey-Lefevre J, York B, Truett GE. Dietary obesity linked to genetic loci on chromosomes 9 and 15 in a polygenic mouse model. J Clin Invest. 1994;94:1410–1416. doi: 10.1172/JCI117477. [DOI] [PMC free article] [PubMed] [Google Scholar]