

Abstract
A vast number of non-covalent interaction energies at the counterpoise corrected CCSD(T) level have been collected from the literature to build a diverse new dataset. The whole dataset, which consists of 2027 CCSD(T) energies, includes most of the published data at this level. A large subset of the data was then used to train a novel, B3LYP specific, empirical correction scheme for non-covalent interactions and basis set superposition error (abbreviated as B3LYP-MM). Results obtained with our new correction scheme were directly compared to benchmark results obtained with B3LYP-D31 and M06-2X2 (two popular density functions designed specifically to accurately model non-covalent interactions). For non-covalent complexes dominated by dispersion or dipole-dipole interactions all three tested methods give accurate results with the medium size aug-cc-pVDZ3–6 basis set with MUE’s of 0.27 (B3LYP-MM), 0.32 (B3LYP-D3) and 0.47 kcal/mol (M06-2X) (with explicit counterpoise corrections). These results validate both B3LYP-D3 and M06-2X for interactions of this type using a much larger data set than was presented in prior work. However, our new dispersion correction scheme shows some clear advantages for dispersion and dipole-dipole dominated complexes with the small LACVP* basis set, which is very popular in use due to its low associated computational cost: The MUE for B3LYP-MM with the LACVP* basis set for this subset of complexes (without explicit counterpoise corrections) is only 0.28 kcal/mol, compared to 0.65 kcal/mol for M06-2X or 1.16 kcal/mol for B3LYP-D3. Additionally, our new correction scheme also shows major improvements in accuracy for hydrogen-bonded systems and for systems involving ionic interactions, for example cation-π interactions. Compared to B3LYP-D3 and M06-2X, we also find that our new B3LYP-MM correction scheme gives results of higher or equal accuracy for a large dataset of conformer energies of di- and tripeptides, sugars, and cysteine.
Introduction
Density Functional Theory (DFT)7 has become an indispensable computational method to solve real world problems with quantum mechanics. The success of DFT is mainly based on its excellent balance between computational cost and accuracy, which is obtained with popular density functionals, such as B3LYP8–11. B3LYP has shown good accuracy and transferability for thousands of real world systems studied during the past 15 years and therefore has become the most popular density functional for application studies in the chemical literature. However, even though B3LYP shows remarkable accuracy for many real world problems12,13, it fails to accurately represent London Dispersion Interactions14–17. Since this type of weak non-covalent interactions plays a crucial role in chemistry18–20 and biology21–23, this represents a serious limitation for the B3LYP functional. A variety of ways to improve upon B3LYP for non-covalent interactions have been proposed in the recent literature, ranging from new density functionals24,25,26 such as M06-2X2 to a posteriori corrections for existing density functionals,1,27–31 to name just a few of the most popular approaches. For a more detailed discussion of such methods we refer the reader to the recent review literature.32–35
It becomes an important task to benchmark the significant number of promising DFT methods in order to be able to recommend the best ones to the users. For this it is crucial to have benchmark datasets as large and diverse as possible in hand. The field of producing benchmark interaction energy data has been pioneered by Hobza and coworkers with their S22 dataset36,37 which has become a standard test set for non-covalent interactions. Since the publication of the S22 dataset, a substantial amount of new high level benchmark non-covalent interaction energy data has appeared in the literature (for all citations, see the supporting information). However, since most of this data is scattered throughout the literature, assembling all of it into one database is necessary, if one wants to use it for benchmarking or training purposes. This task has been started by Hobza and coworkers with the Benchmark Energy & Geometry Database (BEGDB) database,38 which contains most of the benchmark data produced in the Hobza group. In this work we have tried to complete one of the tasks started with the BEGDB project, which is to create one large benchmark interaction energy database that contains almost all CCSD(T) data currently available in the literature. With a thorough literature search we were able to assemble a dataset of 2027 counterpoise corrected interaction energies at the CCSD(T) level. Furthermore, we also compiled a database of CCSD(T)/cbs level conformational energies of di-, tripeptides, sugars and cysteine from the literature.1,38,54 For future use, our databases are supplied as a whole in the supporting information in their current forms. However, an updated version of both databases will also be made accessible on the Friesner group webpage at http://theochem.chem.columbia.edu/group once this manuscript is published.
We employed our very large and diverse interaction energy database to benchmark two DFT methodologies that both have displayed good performance for non-covalent interactions, M06-2X2 (a relatively new density functional) and B3LYP-D31 (an a posteriori correction scheme for the popular B3LYP density functional) when evaluated using smaller data sets. While B3LYP-D3 involves an empirical functional form as well as a few global, empirical parameters, most of its parameters are calculated using ab initio methods. Therefore B3LYP-D3 is generally referred to as a semiempirical correction scheme.1 Using part of our new interaction energy and conformational energy dataset as the training set, we also parameterized a novel empirical correction scheme for the B3LYP functional (abbreviated as B3LYP-MM). Our correction scheme not only improves the treatment of London Dispersion Interactions with B3LYP but also includes a version that corrects for basis set superposition error (BSSE)39 if this is not treated explicitly. It was specifically designed to yield good accuracy with any basis set with and without explicit counterpoise corrections.40 Since B3LYP-D3 and M06-2X were not designed to correct for the large BSSE present with small basis sets, it is not surprising that we find major improvements in accuracy compared to the other benchmarked methods for the small LACVP*41 basis set (which is very popularly used because of its relatively low computational cost) without explicit counterpoise corrections. While with B3LYP-MM we get an overall mean unsigned error (MUE) of only 0.41 kcal/mol without explicit counterpoise correction and the LACVP* basis set, the corresponding MUE’s with the other methods are significantly larger with 1.20 kcal/mol for M06-2X and 2.11 kcal/mol for B3LYP-D3. With our new correction scheme special care was also taken to obtain high accuracy for hydrogen-bonded systems (for which BSSE is often especially large due to the small distances involved) and for systems with ionic interactions, including those with cation-π interactions.
Our correction is simply added to the B3LYP energy and depends only on nuclear coordinates in the same spirit as the correction schemes developed by Grimme and coworkers,1,28. It therefore has the big advantage of very low numerical complexity, which makes implementation of gradients and second derivatives into any existing quantum chemical code a relatively simple task. Furthermore, the time needed to calculate the correction is negligible, making the corrected DFT as fast as the original uncorrected version. The correction consists of three additive parts: A simple Lennard-Jones potential, a linear hydrogen bonding correction term as well as a linear cation-π correction term. Currently, the parameters of the Lennard-Jones correction term depend only on atomic numbers and are independent of the atomic environments, while the hydrogen bonding correction parameters are identical for all types of hydrogen bonds.
Applying combination rules for the pair wise parameters of the Lennard Jones terms allows us to keep the total number of freely adjustable parameters low. Currently, the correction contains only one parameter for each atom type (currently H, C, N, O, F, S and Cl are implemented). For positive ions such as Li+ or Na+ Lennard-Jones terms are not needed. Lennard-Jones correction terms are also excluded for ammonium hydrogens (any hydrogen attached to a positively charged sp3 nitrogen) since such hydrogens carry a substantial positive charge. Besides, there are four additional adjustable parameters, one global scaling factor for Van der Waals radii, two parameters for the hydrogen bonding correction as well as one adjustable parameter for the cation-π correction term. All 11 adjustable parameters were optimized via a least squares fit to our very large and diverse dataset of non-covalent interaction energies as well as to the dataset of conformational energies.
Our correction scheme is able to yield better accuracy for small basis sets, hydrogen bonded and charged systems mainly due to the following five major differences to similar solutions developed by others: 1,28,32
The functional form of our dispersion correction consists of a simple Lennard-Jones 6–12 potential, in contrast to most other correction schemes that contain attractive r−6 and r−8 terms damped at short distances.
Our correction is only applied for atom-pairs more than three covalent bonds apart from each other, since we believe that special corrections should be developed for the covalent bonding region. Such corrections for covalent bonds as well as corrections for transition metals are currently being developed in our group.42–45 Our final goal is to merge all different correction types into a general correction scheme for B3LYP.
Hydrogen bonds are treated specially with our correction scheme. First, the Lennard Jones dispersion correction term is not included for any hydrogen heavy atom pair involved in a hydrogen bond. Second, a linear repulsive correction term is applied for all hydrogen heavy atom pairs involved in a hydrogen bond, mainly in order to correct for BSSE (which we find to be especially strong for hydrogen bonds due to the short distances between the atoms involved).
Cation-π interactions obtain a special treatment with our correction scheme as well. First, the Lennard-Jones dispersion correction terms are not included for any positively charged metal ions such as Li+ or Na+ or for any ammonium hydrogens (any hydrogen attached to a positively charged sp3 nitrogens) since the positive charge of an ammonium type cation is mostly localized on the hydrogens. Second, a linear repulsive correction term is applied for cation-π interactions involving simple metal cations such as Li+ or Na+.
Since BSSE is highly dependent on the basis set used, the parameters of the correction were made dependent on the basis set and on whether counterpoise corrections are applied.
The paper is organized as follows. In the methods section, our dataset and correction scheme are discussed in detail. In the results section, the performance of our B3LYP-MM correction scheme will be compared to the accuracy of M06-2X and B3LYP-D3. Finally, in the conclusion, we summarize the comparisons of the various approaches.
Methods
Interaction Energy Database
We assembled our non-covalent interaction energy database from 34 publications in the literature (The citations for all the literature used for the database are given in the supplementary information). Relevant data from the BEGDB project38 was downloaded from http://www.begdb.com. Some publications did not report molecular coordinates but we were able to obtain most of them through correspondence with the authors.
The database contains mostly interaction energies at the counterpoise corrected CCSD(T)/cbs level, which represents the current gold standard for benchmark non-covalent interaction energies of medium sized molecules.46–49 The acronym CCSD(T)/cbs represents MP250,51 interaction energies (extrapolated to the complete basis set limit), which have been corrected for higher order correlation effects at the CCSD(T) level52,53 with a small or medium size basis set.36,48 Recent studies have shown that for some complexes of the S22 dataset, errors due to small basis sets employed to compute the CCSD(T) correction terms can be as large as 0.6 kcal/mol.64, 65 Unfortunately, up to date, only a few highly accurate CCSD(T)/cbs interactions energies (with the CCSD(T) correction term extrapolated to the basis set limit) exist due to the extraordinary cost of such calculations, especially when applied to medium sized molecules. Since for this study our main goal was to build a very large and diverse dataset with reasonable accuracy, we assembled our interaction energy dataset from almost all CCSD(T)/cbs interaction energies published in the literature without further pruning of the dataset with respect to quality of the CCSD(T) corrections. The dataset will however be updated in the future to reflect better quality best estimates for interaction energies as they will become available in the literature. Furthermore, the very flexible B3LYP-MM methodology will easily allow refitting of the correction parameters to a dataset of more accurate interaction energies as these become available. Besides CCSD(T)/cbs level interaction energies, several data points with interaction energies at the counterpoise corrected CCSD(T) level obtained with a medium or large basis set are also included in the database. In total, the database contains 2027 counterpoise corrected CCSD(T) interaction energy data points. For the benchmark studies reported in this work, non-covalent complexes with strongly repulsive interaction energies (> 5.0 kcal/mol) were not included, mainly because the precise accuracy of the model at such geometries is generally unimportant in practical applications, as these geometries are rarely occupied due to the strongly repulsive interaction energy. Complexes containing elements other than H, C, N, O, F, S, Cl, Li and Na were not included as well, since currently parameters for B3LYP-MM were only fit for these elements. Even though a few complexes were not used for the benchmark studies, their best estimate interaction energies as well as their coordinates are still given in the supplementary information for potential future use.
The database contains equilibrium structures (96 data points, optimized at the CCSD(T), RI-MP2, MP2 or DFT level) and non-equilibrium structures (1931 data points). It also spans the whole range of non-covalent interactions, ranging from weakly bound dispersion dominated complexes over hydrogen bonded ones to dimers with strong electrostatic interactions. A split up of the database (only the data points that were used for the benchmark studies) into different interaction energy type categories is shown in table 1.
Table 1.
Non-covalent interaction types present in the interaction energy database (Only data used for the benchmark studies in this work was counted. For all the data see the supplementary information).
| Number of Data points | Interaction Energy Range (min/max in kcal/mol) |
|
|---|---|---|
| Dispersion and/or Dipole-Dipole Dominated | 1036 | −11.83 / 3.71 |
| Hydrogen Bonded, not charged | 137 | −22.95 / 0.61 |
| With Ionic Interactions | 542 | −110.80 / 4.62 |
Benchmark data set of relative conformational energies
A dataset of conformer energies at the CCSD(T)/cbs level containing di- and tripeptides as well as sugars and cysteine was compiled from the literature as well. The collection of all possible energy gaps between the different conformers (a total of 700) was used as the benchmark set. The peptide benchmark energies were taken from the BEGDB project of Hobza and coworkers,38,54 while benchmark data for the sugars and cysteine was taken from the SCONF and the CCONF datasets of Grimme and coworkers.1 All benchmark conformer energies as well as the corresponding structures are given together with their original citations in the supplementary information.
Computational Details
All calculations were carried out with the Jaguar software package.55 The pseudospectral methodology,56–60 which significantly speeds up the SCF iterations, was employed. Default grids and SCF convergence criteria as implemented in Jaguar were used. All structures were taken from the benchmark energy database and were not further optimized. Interaction Energies were obtained by subtracting the energies of the monomers (in the geometries of the complex) from the energy of the complex. Counterpoise corrected interaction energies were obtained by employing the methodology of Boys and Bernardi.40 With this methodology, the energies of the monomers are calculated in the basis set of the complex, i.e. basis functions are placed at the positions of all the atoms present in the complex but absent in the monomer. B3LYP-D31 dispersion corrections were calculated with the program provided on Professor Grimme’s website (at http://toc.uni-muenster.de/DFTD3).
Near linear dependencies of basis functions
When one tries to solve the SCF equations for non-covalently bound complexes, one is often confronted with the well-known problem of numerical instabilities arising due to near linear dependencies of non-orthogonal gaussian basis functions on atoms close in space.61 The near linear dependencies are especially pronounced for large basis sets with diffuse functions and can lead to numerical instabilities, especially if approximate numerical techniques (such as the pseudospectral method) are employed to compute integrals. Usually, the closer the non-covalently bonded atoms, the more pronounced the numerical instabilities. The near linear dependencies are manifested in very small eigenvalues of the atomic orbital overlap matrix. Therefore, the simplest solution to the problem of basis set overcompleteness is to diagonalize the overlap matrix to get a set of canonical orbitals as eigenvectors. Then, all canonical orbitals with a corresponding eigenvalue below a threshold ε are discarded. This simple methodology effectively removes near linear dependencies of the basis functions and has been successfully applied with Jaguar with ε= 5.0×10⁻⁴.
One caveat with specifying a fixed eigenvalue cutoff ε is that the number and type of canonical orbitals removed can vary with the molecular geometry. Since the total number of canonical orbitals can change abruptly between two infinitesimally close geometries, the potential energy surfaces can become discontinuous. With ε = 5.0×10⁻⁴ these discontinuities are virtually non-existent with the LACVP* basis set. With the aug-cc-pVDZ basis set3–6 and that ε value the discontinuites are usually small (below 0.1 kcal/mol), they can however in a few cases reach larger values up to 0.3 kcal/mol. We believe that for most applications discontinuities of this magnitude are tolerable, especially since errors from other sources (e.g. stemming from the approximate treatment of electron correlation effects in DFT or from approximate solvation models, etc.) are often of much larger magnitude. However, if very high accuracy is required, a lower cutoff ε might have to be employed in order to minimize the discontinuities further.
Another caveat is that the number and type of canonical orbitals removed can vary between calculations that are used for energy comparisons. For example, since near linear dependencies of basis functions are often present for non-covalent dimers, but absent from the monomeric structures, the dimer is likely to contain fewer canonical orbitals than both monomers together if a fixed value of ε is employed. This will lead to an increased energy of the dimer relative to the energies of the monomers and therefore lead to a less stable complex. However, if the eigenvalue cutoff ε gets small enough, the canonical orbitals removed are already well represented by others and their removal does not significantly increase the energy of the molecule. Furthermore, the destabilization effect on a complex due to removal of canonical orbitals is in opposite direction of the BSSE, which is always stabilizing the complex. Therefore, one might expect some error cancellation with the BSSE if a fixed ε is employed. In practice we have found, that with ε = 5.0×10⁻⁴, interaction energies at the non-counterpoise corrected B3LYP/aug-cc-pVDZ level agree within a few tenths of kcal/mol with their counterpoise corrected counterparts. The same was also found for interaction energies at the B3LYP/aug-cc-pVTZ level. With the LACVP* basis set, there are usually no canonical orbital eigenvalues below ε = 5.0×10⁻⁴, such that the BSSE is not reduced with this methodology.
Corrections for London Dispersion and Basis Set Superposition Error (BSSE)
As many of the numerous correction schemes developed by others,1,28,32 our correction is based on an a posteriori energy correction, solely dependent on nuclear coordinates. Our correction, which comprises of a London Dispersion correction (ELDC), a hydrogen bonding correction term (EHBC) and a cation-π correction term (Eπ+) is simply added to the DFT energy, as described in equation1.
| (1) |
We found that the errors of B3LYP for hydrogen bonded systems and structures with cation π interactions were very different from the errors observed for dispersion and/or dipole-dipole bound complexes. While B3LYP strongly underestimates interaction energies of most dispersion and dipole-dipole bound complexes, it often overestimates interaction energies of hydrogen bonded complexes or such with cation π interactions, especially if no explicit counterpoise corrections are applied. Major reasons for this special behavior of hydrogen bonded complexes and systems with cation π interactions are the very strong electrostatic interactions involved, but also the weak covalent nature of the resulting interactions. To account for the special nature of hydrogen bonds and cation π interactions, the London dispersion correction term is replaced with a special hydrogen bond or cation π correction term (described below) for hydrogen bonded heavy atom hydrogen pairs as well as for cation π bonded atom pairs.
The London dispersion correction is described as a sum of Lennard Jones (LJ) functions (equation 2), where the sum loops over all atom pairs at least four covalent bonds apart from each other.
| (2) |
The parameters rminij represent the minimum distances of the LJ functions, while the parameters εij represent the values of the correction terms at rminij. We found that the simple Lennard Jones 6–12 functional form is well suited to represent dispersion correction terms in the attractive and weakly repulsive region. However, for the strongly repulsive region (with non-bonded atoms jammed into one another), the Lennard Jones potential is likely to greatly overestimate the van der Waals repulsion. Since most structures with strongly repulsive non-bonded contacts represent in fact highly unstable species which are difficult to accurately model even with correlated wave function methods such as CCSD(T), we have not attempted to accurately model the strongly repulsive region with the current version of B3LYP-MM. However, once a larger amount of reliable interaction energy data becomes available for strongly repulsive van der Waals contacts, it will be a relatively easy task to adjust the repulsive functional form of B3LYP-MM to allow accurate modelling of the repulsive region as well. Since Lennard Jones dispersion correction terms are not included for hydrogen bonds as well as for cation π interactions, the repulsive wall of the LJ 6–12 potential does not pose any problem for close hydrogen bond and cation π contacts.
In order to guarantee transferability of the correction, the total number of empirical parameters should be kept small compared to the number of training data points. In order to lower the total amount of empirical parameters, we introduced an empirical combination rule for the atom pair wise ε-parameters (equation 3).
| (3) |
The parameters εi depend only on the atomic number of atom i. This keeps the number of parameters low, but at the same time limits the accuracy of the correction, since atoms in different chemical environments will be treated the same. For this work, ε-parameters were only fit for the most common elements in the dataset (H, C, N, O, F, S and Cl). For metal cations such as Li+ and Na+ as well as for ammonium hydrogens (defined as any hydrogen attached to a positively charged sp3 nitrogen) Lennard-Jones dispersion correction terms are not included since the contribution of dispersion to intermolecular interactions is usually very small for these positive ions. For molecules involving other elements, the correction is currently undefined. However, once even more benchmark interaction energy data becomes available, we are planning to determine ε parameters for more elements.
The pair wise rmin parameters are calculated with the additive combination rule shown in equation 4.
| (4) |
RVDW are experimental Van der Waals Radii obtained from Bondi’s compilation62 (again only dependent on the atomic number of atom i, shown in table 2), while q is a global scaling factor.
Table 2.
The parameters RiVDW (obtained from Bondi’s compilation62).
| Element | RVDW (Å) |
|---|---|
| H | 1.20 |
| C | 1.70 |
| N | 1.55 |
| O | 1.52 |
| F | 1.47 |
| S | 1.80 |
| Cl | 1.75 |
The hydrogen bonding correction term is simply composed of a linear repulsive function with two global parameters r0hb and bhb (equation 5).
| (5) |
The sum in equation 5 runs over all hydrogen – heavy atom pairs, which are hydrogen bonded. rij are the distances between the hydrogen bond acceptor and the hydrogen-bonded hydrogens. Each correction term is only counted if positive, i.e. if rij < r0. Hydrogen bonds were detected with the hydrogen bond detection subroutine implemented in the Schrödinger MMShare software package.63 A hydrogen bond was always assigned if two potentially hydrogen-bonding atoms (hydrogen and hydrogen-bond acceptor with the right Macromodel atom types) were closer than 3.0 Å apart from each other. In order to avoid large discontinuities in the potential energy surfaces with our correction scheme, hydrogen bond donor and acceptor angles were not considered for the assignment of hydrogen bonds. This angle independent hydrogen bond assignment ensures that the only possible discontinuity in the potential energy surface could occur at the cutoff distance of 3.0 Å. However, since all correction terms become negligible at the cutoff distance, this very small discontinuity of the potential energy surface does not pose a problem in practice. This fact is illustrated in Figure 1, which shows potential energy surfaces of formic acid dimer with our correction scheme. Even though formic acid dimer contains two symmetric hydrogen bonds (which will lead to a discontinuity twice as large as with only a single hydrogen bond), Figure 1 shows that the discontinuity in the potential energy surface is virtually non-existent.
Figure 1.

Potential energy surface of the formic acid dimer. Distance between the monomers represents the distance between the two centers of mass. Hydrogen bonds are shown in yellow with the hydrogen bonded distance range (H-heavy-atom distance < 3.0 Å) highlighted in yellow.
The cation-π correction term (equation 6) is also composed of a simple linear repulsive term.
| (6) |
The sum in equation 6 runs over over all metal cation – sp2/sp-carbon pairs. rij are the distances between the atom pairs considered. All sp2/sp-carbons, except carbonyl and immine carbons are counted for the cation-π correction term. Each correction term is only included if positive, i.e. if rij < r0. The parameter r0π+ was set to 5.0 Å and not further optimized.
The parameters εi, q, bhb, r0hb and bπ+ were optimized via a least squares fitting procedure to part of our interaction energy data set as well as to part of the data from the relative conformational energy data set. In order to avoid any discontinuity of the hydrogen bonding correction, the hydrogen bonding correction parameter bhb was constrained to be ≤ 3.0 Å. The determination of optimal parameter values represents a non-linear optimization problem, to which we found a solution with a variant of the Levenberg-Marquardt algorithm as implemented in the leastsq subroutine of the scipy software package (version 0.6.0). About 75% of all interaction energy and conformational energy data was randomly selected and used as the training set for the parameters. The leftover 25% of the data was employed as a test set. In order to ensure, that all types of interactions were well represented in the training and the test set, the random selection procedure for the interaction energy training set was carried out according to the following protocol:
All complexes were assigned to several ε-parameter groups, such that each parameter εi formed one parameter group. A complex was assigned to the parameter group of εi if its interaction energy was dependent on the value of εi. ε-parameter groups of common elements (e.g. C, H or O) contained several hundreds of complexes while other parameter groups, such as e.g. the ones involving F or Cl only had a few tens of members.
In order to ensure that all parameter groups would be represented in the training and the test set with approximately the desired training/test ratio, all parameter groups were ordered according to increasing number of complexes. Each complex was then assigned to one single parameter group according to the following algorithm: First, the paramter group with the least amount of members was assigned all of its members. Then, the second smallest parameter group was assigned all of its members, except the ones already present in the first parameter group. Proceeding in the same manner, the nth smallest parameter group was assigned all of its members except the ones already present in the parameter groups with fewer members.
A little over half of the training set was then selected by randomly choosing 37.5% (rounded down to the nearest integer) of complexes from each parameter group.
The whole dataset was also divided into the three interaction type categories shown in table 1. The three categories are: complexes with only dispersion and dipole-dipole interactions, hydrogen bonded complexes and charged complexes.
The percentage of complexes to be selected for the training set from each interaction type category (defined as f2), was then calculated, such that the final training/test ratio would be around 3/1. f2% of data points from each interaction type category were then randomly selected for the training set, after having removed all complexes already selected for the training set in step 3.
The random selection of the training set together with the least squares fitting was carried out six times for each set of parameters. This allowed us to obtain an estimate of the sensitivity of the parameters on the training set and is a good test to ensure no overfitting. Table 3 shows the mean values of all parameters (for the LACVP* and the aug-cc-pVDZ basis sets) together with their standard deviations as obtained from the six least squares fitting experiments. Optimal parameters were determined for counterpoise and non-counterpoise corrected interaction energies. (The relative conformational energies were never counterpoise corrected, since there is no consistent way to apply counterpoise correction for total energies.
Table 3.
Mean B3LYP-MM parameter values obtained from six least squares fitting experiments. Error bars represent standard deviations.
| Parameter name |
Parameter Units | Basis Set | |||
|---|---|---|---|---|---|
| LACVP* | aug-cc-pVDZ | ||||
| un-Cp-corra | Cp-corrb | un-Cp-corra | Cp-corrb | ||
| εH | (kcal/mol)0.5 | 0.097 ± 0.009 | 0.183 ± 0.002 | 0.306 ± 0.003 | 0.313 ± 0.002 |
| εC | 0.589 ± 0.024 | 0.744 ± 0.003 | 0.660 ± 0.009 | 0.714 ± 0.013 | |
| εN | 0.542 ± 0.019 | 0.744 ± 0.005 | 0.731 ± 0.009 | 0.705 ± 0.011 | |
| εO | 0.215 ± 0.004 | 0.427 ± 0.004 | 0.595 ± 0.012 | 0.633 ± 0.013 | |
| εF | 0.013 ± 0.023c | 0.528 ± 0.022 | 0.362 ± 0.010 | 0.540 ± 0.014 | |
| εS | 1.117 ± 0.067 | 1.393 ± 0.023 | 1.288 ± 0.020 | 1.379 ± 0.027 | |
| εCl | 0.909 ± 0.043 | 1.145 ± 0.023 | 0.701 ± 0.054 | 0.974 ± 0.044 | |
| q | no units | 0.895 ± 0.012 | 0.860 ± 0.001 | 0.859 ± 0.004 | 0.846 ± 0.005 |
| bhb | kcal/(mol × Å) | 1.144 ± 0.024 | 1.094 ± 0.038 | 1.888 ± 0.064 | 1.816 ± 0.090 |
| bπ+ | 0.410 ± 0.004 | 0.248 ± 0.006 | 0.130 ± 0.002 | 0.116 ± 0.004 | |
| r0hb | Å | 3.000d | 2.283 ± 0.006 | 2.047 ± 0.002 | 2.035 ± 0.006 |
| r0π+ | 5.000e | 5.000e | 5.000e | 5.000e | |
Parameters fit to interaction energies without explicit counterpoise corrections.
Fit to counterpoise corrected interaction energies. Relative Conformational energies were never counterpoise corrected.
Parameter was constrained to be positive. During the six fitting experiments parameter values from 0.00 to 0.06 were found.
Parameter reached its maximum value of 3.0 Å during least squares optimization.
Parameter was not optimized but set to 5.0 Å.
The very small standard deviations for each parameter clearly show that there has been no overfitting and that the correction is therefore likely to be transferable to systems not included in the training set. Another fact that supports this conclusion is that the Mean Unsigned Errors (MUEs) as well as the Root mean square deviations (RMSDs) for the randomly selected training and test sets were very similar for all six fitting experiments. RMSDs and MUEs averaged over all six fitting experiments are shown in table 4.
Table 4.
RMSDs and MUEs obtained with B3LYP-MM averaged over the six fitting experiments. Error bars represent standard deviations. (Training set: 1810 ± 6 data points; Test set: 605 ± 6 data points)
| Basis Set | cp corra | MUE (kcal/mol) | RMSD(kcal/mol) | ||
|---|---|---|---|---|---|
| Training set | Test set | Training set | Test set | ||
| LACVP* | no | 0.45 ± 0.01 | 0.45 ± 0.02 | 0.70 ± 0.02 | 0.66 ± 0.05 |
| yes | 0.48 ± 0.01 | 0.49 ± 0.01 | 0.72 ± 0.01 | 0.72 ± 0.03 | |
| aug-cc-pVDZ | no | 0.37 ± 0.01 | 0.36 ± 0.01 | 0.51 ± 0.01 | 0.50 ± 0.02 |
| yes | 0.34 ± 0.01 | 0.35 ± 0.01 | 0.49 ± 0.01 | 0.49 ± 0.02 | |
Whether interaction energies were counterpoise corrected or not. Relative Conformational energies were never counterpoise corrected.
Since we find that BSSE is small with the aug-cc-pVDZ basis set if no halogens are involved, it is not surprising that the optimal values for the correction parameters are very similar with and without counterpoise corrected interaction energies for that basis set (table 3). An exception are the halogen correction parameters εF and εCl, which vary significantly depending on whether explicit counterpoise corrections are included, due to larger counterpoise corrections for complexes involving F or Cl with the aug-cc-pVDZ basis set. For the small LACVP* basis set where BSSE is very significant (often up to several kcal/mol) we find clearly different correction parameters depending on whether counterpoise corrections are applied or not. Again, the halogen correction parameters are especially sensitive to the counterpoise correction issue, due to especially large counterpoise corrections for structures involving halogens..
Results and Discussion
A summary of the overall statistical performance (MUEs, RMSDs and Average Errors) of all the benchmarked methods, B3LYP-D3, M06-2X and B3LYP-MM (this work) is shown in table 5.
Table 5.
RMSDs, MUEs and Average Errors of all benchmarked DFT methods (in kcal/mol). B3LYP-MM represents results obtained with the correction scheme developed in this work.
| Basis Set | Counter- poise corrected |
DFT-Method | Whole Interaction Energy DB (1715 datapointsa) |
Conformational Energies DB (700 data points) |
||||
|---|---|---|---|---|---|---|---|---|
| MUEb | RMSDc | Avgd | MUEb | RMSDc | Avgd | |||
| LACVP* | no | B3LYP-D3 | 2.11 | 2.87 | −2.10 | 0.82 | 1.10 | 0.02 |
| B3LYP-MM | 0.41 | 0.68 | −0.04 | 0.55 | 0.71 | 0.05 | ||
| M06-2X | 1.20 | 1.97 | −0.94 | 0.78 | 1.04 | 0.10 | ||
| B3LYP | 2.75 | 3.66 | 1.35 | 1.54 | 2.03 | 0.32 | ||
| yes | B3LYP-D3 | 1.21 | 1.91 | −0.64 | nae | |||
| B3LYP-MM | 0.41 | 0.65 | 0.18 | 0.67f | 0.87f | −0.03f | ||
| M06-2X | 1.20 | 1.97 | −0.94 | nae | ||||
| B3LYP | 3.53 | 4.87 | 2.81 | |||||
| aug-cc-pVDZ | no | B3LYP-D3 | 0.95 | 1.48 | −0.72 | 0.39 | 0.49 | −0.05 |
| B3LYP-MM | 0.37 | 0.53 | 0.09 | 0.37 | 0.47 | −0.07 | ||
| M06-2X | 0.73 | 1.17 | −0.30 | 0.61 | 0.79 | −0.02 | ||
| B3LYP | 3.11 | 4.36 | 2.73 | 1.57 | 2.15 | 0.25 | ||
| yes | B3LYP-D3 | 0.87 | 1.41 | −0.56 | nae | |||
| B3LYP-MM | 0.32 | 0.48 | 0.11 | 0.38f | 0.49f | −0.09f | ||
| M06-2X | 0.67 | 1.08 | −0.10 | nae | ||||
| B3LYP | 3.25 | 4.57 | 2.89 | |||||
For the following levels of theory fewer number of cases were included due to SCF convergence problems: B3LYP/aug-cc-pVDZ without counterpoise correction (2 cases missing); M06-2X/LACVP* with explicit counterpoise correction (11 cases missing); M06-2X/aug-cc-pVDZ with explicit counterpoise correction (3 cases missing); M06-2X/aug-cc-pVDZ without counterpoise correction (4 cases missing)
Mean Unsigned Error.
Root Mean Square Deviation.
Average Error.
No consistent way to apply counterpoise corrections.
B3LYP energies were obtained without counterpoise corrections, however, the MM correction part was parametrized with counterpoise corrected interaction energies.
In order to see how the benchmarked methods perform for complexes dominated by different kinds of interactions, results for dispersion and dipole-dipole dominated complexes are shown separately in table 6, while table 7 shows separate results for complexes with hydrogen bonds or ionic interactions.
Table 6.
RMSDs, MUEs and Average Errors of all benchmarked DFT methods (in kcal/mol) for dispersion and dipole-dipole dominated complexes. B3LYP-MM represents results obtained with the correction scheme developed in this work.
| Basis Set | Counter- poise corrected |
DFT-Method | Dispersion and Dipole- Dipole Dominated Complexes (1036 datapointsd) |
||
|---|---|---|---|---|---|
| MUEa | RMSDb | Avgc | |||
| LACVP* | no | B3LYP-D3 | 1.16 | 1.38 | −1.15 |
| B3LYP-MM | 0.28 | 0.41 | 0.05 | ||
| M06-2X | 0.65 | 0.92 | −0.26 | ||
| B3LYP | 3.15 | 4.09 | 3.14 | ||
| yes | B3LYP-D3 | 0.55 | 0.80 | 0.33 | |
| B3LYP-MM | 0.33 | 0.46 | 0.21 | ||
| M06-2X | 1.06 | 1.36 | 1.03 | ||
| B3LYP | 4.62 | 5.88 | 4.62 | ||
| aug-cc-pVDZ | no | B3LYP-D3 | 0.37 | 0.50 | −0.02 |
| B3LYP-MM | 0.36 | 0.49 | 0.13 | ||
| M06-2X | 0.53 | 0.73 | 0.01 | ||
| B3LYP | 4.27 | 5.31 | 4.27 | ||
| yes | B3LYP-D3 | 0.32 | 0.48 | 0.18 | |
| B3LYP-MM | 0.27 | 0.37 | 0.14 | ||
| M06-2X | 0.47 | 0.63 | 0.31 | ||
| B3LYP | 4.47 | 5.58 | 4.47 | ||
Mean Unsigned Error.
Root Mean Square Deviation.
Average Error.
For the following levels of theory fewer number of cases were included due to SCF convergence problems: B3LYP/aug-cc-pVDZ without counterpoise correction (2 cases missing); M06-2X/aug-cc-pVDZ without counterpoise correction (4 cases missing).
Table 7.
RMSDs, MUEs and Average Errors of all benchmarked DFT methods (in kcal/mol) for complexes with hydrogen bonds or ionic interactions. B3LYP-MM represents results obtained with the correction scheme developed in this work.
| Basis Set | Counter- poise corrected |
DFT-Method | Hydrogen Bonded Complexes (not charged) (137 data points) |
Complexes With Ionic Interactions (542 datapointsd) |
||||
|---|---|---|---|---|---|---|---|---|
| MUEa | RMSDb | Avgc | MUEa | RMSDb | Avgc | |||
| LACVP* | no | B3LYP-D3 | 3.42 | 3.71 | −3.42 | 3.58 | 4.36 | −3.57 |
| B3LYP-MM | 0.75 | 0.94 | −0.31 | 0.56 | 0.95 | −0.15 | ||
| M06-2X | 1.85 | 2.16 | −1.81 | 2.08 | 3.07 | −2.03 | ||
| B3LYP | 2.13 | 2.76 | 0.14 | 2.14 | 2.93 | −1.76 | ||
| yes | B3LYP-D3 | 0.82 | 1.00 | −0.51 | 2.57 | 3.18 | −2.53 | |
| B3LYP-MM | 0.55 | 0.91 | 0.34 | 0.52 | 0.84 | 0.10 | ||
| M06-2X | 0.85 | 1.01 | 0.53 | 1.35 | 2.11 | −1.16 | ||
| B3LYP | 3.13 | 4.21 | 3.04 | 1.53 | 2.13 | −0.71 | ||
| aug-cc-pVDZ | no | B3LYP-D3 | 0.64 | 0.77 | −0.45 | 2.14 | 2.51 | −2.12 |
| B3LYP-MM | 0.37 | 0.54 | 0.10 | 0.38 | 0.58 | 0.00 | ||
| M06-2X | 0.61 | 0.76 | 0.25 | 1.13 | 1.78 | −1.05 | ||
| B3LYP | 3.10 | 4.05 | 3.10 | 0.91 | 1.47 | −0.31 | ||
| yes | B3LYP-D3 | 0.44 | 0.56 | −0.25 | 2.05 | 2.41 | −2.04 | |
| B3LYP-MM | 0.36 | 0.51 | 0.24 | 0.41 | 0.64 | 0.02 | ||
| M06-2X | 0.63 | 0.78 | 0.52 | 1.09 | 1.67 | −1.05 | ||
| B3LYP | 3.31 | 4.20 | 3.31 | 0.90 | 1.44 | −0.23 | ||
Mean Unsigned Error.
Root Mean Square Deviation.
Average Error.
For the following levels of theory fewer number of cases were included due to SCF convergence problems: M06-2X/LACVP* with explicit counterpoise correction (11 cases missing); M06-2X/aug-cc-pVDZ with explicit counterpoise correction (3 cases missing).
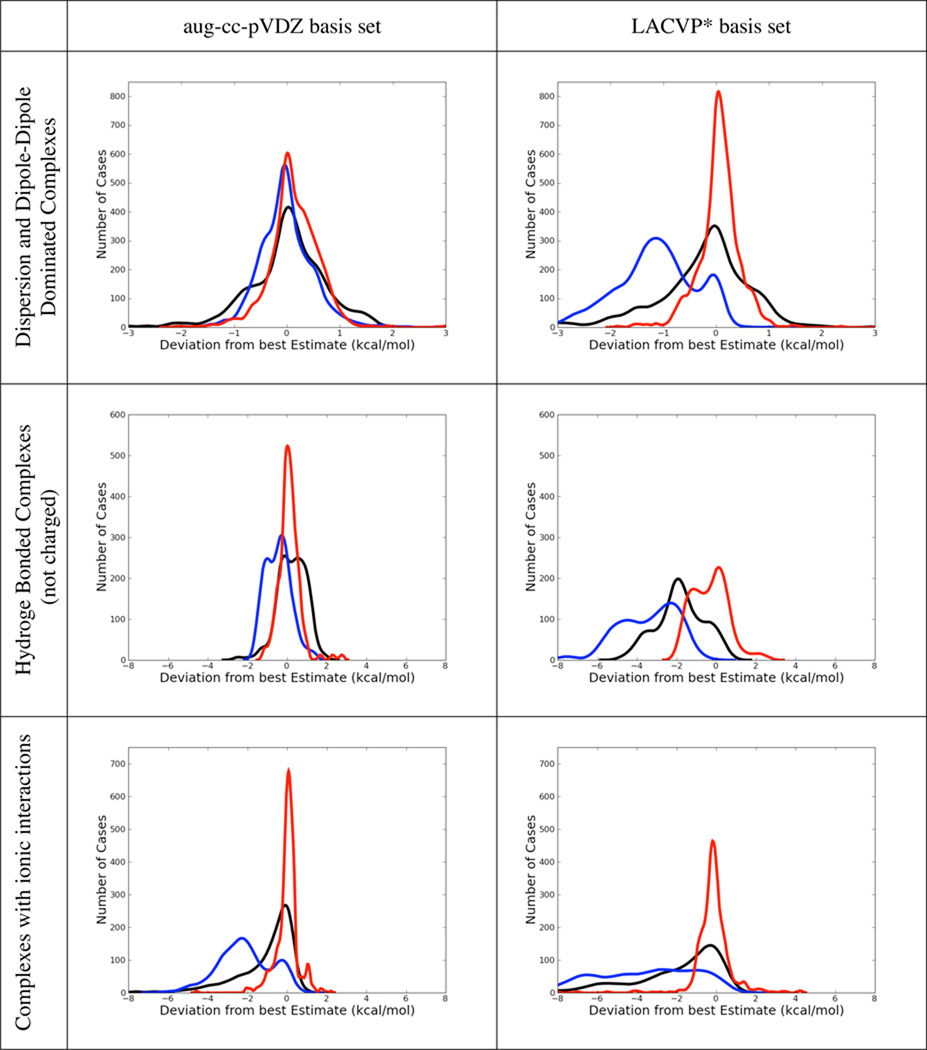
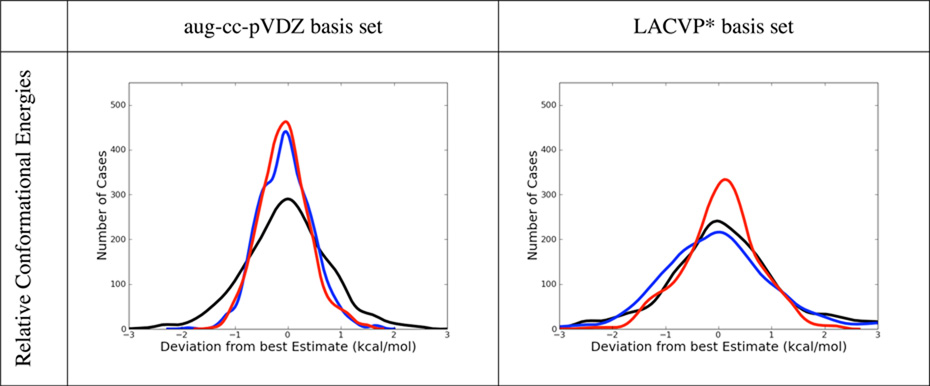
Error histograms for dispersion and dipole dominated complexes, but also for hydrogen bonded and ionic ones are shown in table 8 for B3LYP-MM, B3LYP-D3 and M06-2X. Corresponding error histograms are also shown for the conformational energy dataset. Non-counterpoise corrected results are depicted for both basis sets.
Table 8.
Comparison of Error Distributions of B3LYP-MM (red), B3LYP-D3 (blue) and M06-2X (black). All results are without explicit counterpoise corrections. All plots show normalized kernel density estimates (kdes) multiplied with the number of datapoints. The kdes were computed with the density() function in R, with gaussian kernels and default bandwidths,
 |
 |
In the following section we will discuss the results obtained with both basis sets in more detail.
Results with the medium size aug-cc-pVDZ basis set
From table 6 it can be seen that the performance of B3LYP-D3 for dispersion and dipole-dipole dominated complexes is remarkably accurate with the aug-cc-pVDZ basis set (MUEs below 0.40 kcal/mol). B3LYP-D3 also performs very accurately for the dataset of conformational energies (MUE of 0.39 kcal/mol). M06-2X gives also rather accurate results for dispersion and dipole-dipole dominated complexes as well as for the conformational energies. Its performance is however slightly worse than B3LYP-D3’s. For the subset of hydrogen bonded complexes B3LYP-D3 is slightly more accurate than M06-2X with explicit counterpoise corrections, while without counterpoise corrections both methods are of comparable accuracy. For hydrogen-bonded systems, B3LYP-D3 shows some overbinding. This overbinding is present with and without counterpoise corrections and is manifested in the negative average errors of the method. Since BSSE is always attractive, it is not surprising, that the overbinding is more pronounced without explicit counterpoise corrections. For complexes with ionic interactions, both B3LYP-D3 and M06-2X show significant overbinding regardless of counterpoise corrections (average errors < −1.0 kcal/mol).
With the aug-cc-pVDZ basis set and with explicit counterpoise corrections, our B3LYP-MM method is slightly more accurate than B3LYP-D3 for dispersion and dipole-dipole dominated complexes (MUE = 0.27 kcal/mol). Without counterpoise corrections, our B3LYP-MM method still produces very accurate interaction energies. As with B3LYP-D3 we also observe a very accurate performance on the dataset of conformational energies (MUE = 0.37 kcal/mol). However, in contrast to B3LYP-D3, which shows significant overbinding for hydrogen-bonded and charged complexes, the B3LYP-MM correction scheme also delivers results of high accuracy (MUEs ≤ 0.41 kcal/mol) and almost no overbinding (|Average Error| ≤ 0.24 kcal/mol) for hydrogen-bonded and charged systems.
Therefore, since hydrogen bonds as well as ionic interactions are of great practical importance in biology and materials science, B3LYP-MM clearly has a practical advantage over B3LYP-D3 or M06-2X in conjuction with a medium size basis set.
Results with the small LACVP* basis set
With counterpoise corrections, B3LYP-D3 performs acceptably in the small basis set for dispersion and dipole-dipole dominated complexes, with an overall MUE of 0.55 kcal/mol, while we would not recommend M06-2X with this basis set (MUE = 1.06 kcal/mol). However, B3LYP-MM is clearly the most accurate method with counterpoise corrections in the small basis set with an overall MUE of only 0.33 kcal/mol. Even with counterpoise corrections, B3LYP-D3 seriously overbinds hydrogen-bonded complexes (Average Error = −0.51 kcal/mol) and complexes with ionic interactions (Average Error = −2.53). Without counterpoise corrections, B3LYP-D3’s overbinding for hydrogen-bonded and ionic complexes clearly renders the method very inaccurate with average errors < −3.0 kcal/mol. Apart from hydrogen bonds and ionic interactions, B3LYP-D3 also shows serious overbinding for dispersion and dipole-dipole dominated complexes without counterpoise corrections in the small basis set as can clearly be seen from the error histograms in table 8. Without counterpoise corrections, M06-2X performs better than B3LYP-D3 in the small basis set, its overall performance is however still not convincing with a MUE of 1.20 kcal/mol.
In contrast to all other methods tested, our B3LYP-MM methodology still delivers accurate interaction and conformational energies with the small basis set without counterpoise corrections, with overall MUEs of only 0.41 and 0.55 kcal/mol that are only marginally larger than the ones obtained with the medium size basis set. For hydrogen-bonded complexes, B3LYP-MM shows slight overbinding (Average Error of −0.31 kcal/mol), which leads to a slight degradation in the overall accuracy for hydrogen-bonded complexes (MUE = 0.75 kcal/mol). However, compared to the performances of B3LYP-D3 and M06-2X for hydrogen-bonded complexes without counterpoise corrections in the small basis set (both methods show MUEs larger than 1.8 kcal/mol), the accuracy of B3LYP-MM represents a significant improvement. For complexes with ionic interactions, B3LYP-MM gives also very accurate results regardless of explicit counterpoise corrections, with MUEs ≤ 0.56 kcal/mol.
Finally, it is also noteworthy that the cation π correction in B3LYP-MM seems to pretty uniformly improve cation π interaction energies, regardless of whether the cation sits on top or on the side of an aromatic ring. To illustrate this, we calculated the MUE’s obtained with B3LYP-MM for all benzene alkalication interaction energies in two different regimes of the angle θ (defined in Figure 2).
Figure 2.

Definition of the angle θ.
All structures were divided into conformations, where the cation sits on top of the benzene ring (θ ≤ 45°; 215 structures) and in conformations, where the cation is located more towards the side of benzene ring (45° < θ ≤ 90°; 293 structures). With B3LYP-MM we find similar accuracy for both regimes of the angle θ regardless of basis set and explicit counterpoise corrections. The observed MUEs for the regime with θ > 45° are in fact always slightly smaller (maximum difference in MUEs observed was 0.27 kcal/mol) than the corresponding MUEs for the regime with θ ≤ 45°. This indicates that the cation π correction contained in B3LYP-MM not only works well if the cation is directly above the benzene ring, but also clearly improves interaction energies for other structures.
Conclusions
In this work, we have built a dataset of highly accurate non-covalent interaction energies at the CCSD(T) level from the literature. Compared to previously published datasets, our dataset has a much larger size and greater diversity. Benchmark studies of two DFT methodologies (M06-2X and B3LYP-D3) on our new interaction energy dataset show high accuracy of B3LYP-D3 for dispersion and dipole-dipole dominated interactions if a medium size basis sets such as aug-cc-pVDZ is employed with explicit counterpoise corrections (MUE = 0.32 kcal/mol). However, without counterpoise corrections, we find serious overbinding of B3LYP-D3 for hydrogen-bonded systems (Average Error = −0.45 kcal/mol) and for complexes with ionic interactions (Average Error = −2.12 kcal/mol) with the medium size basis set. For the small LACVP* basis sets without counterpoise corrections (a level of theory that is often employed in practice, especially for geometry optimizations), our benchmark results show that neither B3LYP-D3 nor M06-2X shows good accuracy. In contrast to B3LYP-D3 and M06-2X, we find that our new methodology (B3LYP-MM) delivers very accurate results for all types of interactions, regardless of counterpoise corrections and basis set (Overall MUEs ≤ 0.41 kcal/mol). The observed improvement in accuracy with B3LYP-MM over B3LYP-D3 and M06-2X is especially significant for hydrogen-bonded and charged systems.
The development of B3LYP-MM has demonstrated a number of interesting points:
By making parameters specific to basis set and use of counterpoise corrections, significant improvements in accuracy can be obtained, with a particularly large improvement for small basis sets.
The addition of a small number of parameters addressing hydrogen bonding and interactions involving one or more ions can substantially improve accuracy for these systems, with a particularly large impact on ionic systems, which exhibit large errors when treated with prior alternatives in the literature.
While the data set here has quite a few data points, it does not fully cover all possible types of chemistries associated with noncovalent interactions. Unusual functional groups may in fact require the addition of new parameters to the model. The improvements to hydrogen bonded and charged systems obtained by following this path suggests that it is a fruitful one and can result in a systematically improvable, empirically corrected DFT functional; as problems are discovered, they can readily be repaired by the addition of a relatively small number of new parameters. As benchmark quantum chemical calculations become increasingly inexpensive in the future, transfer of information from such calculations to DFT-based models will become more facile, and, as shown here, will be a highly effective means of achieving chemical accuracy at modest computational cost.
Supplementary Material
Acknowledgment
R.A.F thanks the National Institutes of Health (grant GM-40526) for support of this work. S.T.S is grateful for an Arun Guthikonda Memorial Fellowship. We also thank Professor Ronald Breslow and Jianing Li for helpful discussions. Finally, we would like to acknowledge Professor Seiji Suzuki, Professor Stacey Wetmore, Professor Ota Bludsky and Professor Zaneta Czyznikowska for providing us with coordinates from their publications.
Footnotes
Supporting Information Available: Coordinates, best estimate benchmark interaction energies as well as interaction energies at all calculated DFT-levels for all complexes of the non-covalent interaction energy database. All of the aforementioned information is also given for the conformational energies database. This material is available free of charge via the Internet at http://www.pubs.acs.org.
References
- 1.Grimme S, Antony J, Ehrlich S, Krieg H. J. Chem. Phys. 2010;132:154104. doi: 10.1063/1.3382344. [DOI] [PubMed] [Google Scholar]
- 2.Zhao Y, Truhlar DG. Theor. Chem. Acc. 2008;120:215–241. [Google Scholar]
- 3.Dunning TH. J. Chem. Phys. 1989;90:1007–1023. [Google Scholar]
- 4.Kendall RA, Dunning TH, Harrison RJ. J. Chem. Phys. 1992;96:6796–6806. [Google Scholar]
- 5.Woon DE, Dunning TH. J. Chem. Phys. 1993;98:1358–1371. [Google Scholar]
- 6.Woon DE, Dunning TH. J. Chem. Phys. 1994;100:2975–2988. [Google Scholar]
- 7.Parr RC, Yang W. Density Functional Theory of Atoms and Molecules. New York: Oxford University Press; 1989. [Google Scholar]
- 8.Becke AD. J. Chem. Phys. 1993;98:5648–5652. [Google Scholar]
- 9.Lee CT, Yang WT, Parr RG. Phys. Review B. 1988;37:785–789. doi: 10.1103/physrevb.37.785. [DOI] [PubMed] [Google Scholar]
- 10.Stephens PJ, Devlin FJ, Chabalowski CF, Frisch MJ. J. Phys. Chem. 1994;98:11623–11627. [Google Scholar]
- 11.Vosko SH, Wilk L, Nusair M. Can. J. Phys. 1980;58:1200–1211. [Google Scholar]
- 12.Singleton DA, Wang ZH. J. Am. Chem. Soc. 2005;127:6679–6685. doi: 10.1021/ja0435788. [DOI] [PubMed] [Google Scholar]
- 13.Schneebeli ST, Hall ML, Breslow R, Friesner R. J. Am. Chem. Soc. 2009;131:3965–3973. doi: 10.1021/ja806951r. [DOI] [PMC free article] [PubMed] [Google Scholar]
- 14.Hobza P, Sponer J, Reschel T. J. Comput. Chem. 1995;16:1315–1325. [Google Scholar]
- 15.Cerny J, Hobza P. Phys. Chem. Chem. Phys. 2005;7:1624–1626. doi: 10.1039/b502769c. [DOI] [PubMed] [Google Scholar]
- 16.Johnson ER, Wolkow RA, DiLabio GA. Chem. Phys. Letters. 2004;394:334–338. [Google Scholar]
- 17.Tsuzuki S, Luthi HP. J. Chem. Phys. 2001;114:3949–3957. [Google Scholar]
- 18.Grimme S, Muck-Lichtenfeld C, Antony J. J. Phys. Chem. C. 2007;111:11199–11207. [Google Scholar]
- 19.Antony J, Grimme S. Phys. Chem. Chem. Phys. 2008;10:2722–2729. doi: 10.1039/b718788b. [DOI] [PubMed] [Google Scholar]
- 20.Stone AJ. The Theory of Intermolecular Forces. Oxford: Oxford University Press; 1997. [Google Scholar]
- 21.Burley SK, Petsko GA. Science. 1985;229:23–28. doi: 10.1126/science.3892686. [DOI] [PubMed] [Google Scholar]
- 22.Hunter CA, Lawson KR, Perkins J, Urch CJ. J. Chem. Soc.-Perkin Trans. 2001;2:651–669. [Google Scholar]
- 23.Cerny J, Hobza P. Phys. Chem. Chem. Phys. 2007;9:5291–5303. doi: 10.1039/b704781a. [DOI] [PubMed] [Google Scholar]
- 24.Zhao Y, Truhlar DG. J. Chem. Theory Comput. 2007;3:289–300. doi: 10.1021/ct6002719. [DOI] [PubMed] [Google Scholar]
- 25.Zhao Y, Truhlar DG. Acc. Chem. Res. 2008;41:157–167. doi: 10.1021/ar700111a. [DOI] [PubMed] [Google Scholar]
- 26.Becke AD, Johnson ER. J. Chem. Phys. 2007;127:124108. doi: 10.1063/1.2768530. [DOI] [PubMed] [Google Scholar]
- 27.Grimme S. J. Chem. Phys. 2006;124:034108. doi: 10.1063/1.2148954. [DOI] [PubMed] [Google Scholar]
- 28.Grimme S. J. Comput. Chem. 2006;27:1787–1799. doi: 10.1002/jcc.20495. [DOI] [PubMed] [Google Scholar]
- 29.Grimme S, Antony J, Schwabe T, Muck-Lichtenfeld C. Org. Biomol. Chem. 2007;5:741–758. doi: 10.1039/b615319b. [DOI] [PubMed] [Google Scholar]
- 30.Schwabe T, Grimme S. Phys. Chem. Chem. Phys. 2007;9:3397–3406. doi: 10.1039/b704725h. [DOI] [PubMed] [Google Scholar]
- 31.Chai JD, Head-Gordon M. Phys. Chem. Chem. Phys. 2008;10:6615–6620. doi: 10.1039/b810189b. [DOI] [PubMed] [Google Scholar]
- 32.Riley KE, Pitonak M, Jurecka P, Hobza P. Chem. Rev. 110:5023–5063. doi: 10.1021/cr1000173. [DOI] [PubMed] [Google Scholar]
- 33.Grafenstein J, Cremer D. J. Chem. Phys. 2009;130:124105. doi: 10.1063/1.3079822. [DOI] [PubMed] [Google Scholar]
- 34.Johnson ER, Mackie ID, DiLabio GA. J. Phys. Org. Chem. 2009;22:1127–1135. [Google Scholar]
- 35.Sato T, Nakai H. J. Chem. Phys. 2009;131:224104. doi: 10.1063/1.3269802. [DOI] [PubMed] [Google Scholar]
- 36.Jurecka P, Sponer J, Cerny J, Hobza P. Phys. Chem. Chem. Phys. 2006;8:1985–1993. doi: 10.1039/b600027d. [DOI] [PubMed] [Google Scholar]
- 37.Grafova L, Pitonak M, Rezac J, Hobza P. J. Chem. Theory Comput. 6:2365–2376. doi: 10.1021/ct1002253. [DOI] [PubMed] [Google Scholar]
- 38.Rezac J, Jurecka P, Riley KE, Cerny J, Valdes H, Pluhackova K, Berka K, Rezac T, Pitonak M, Vondrasek J, Hobza P. Coll. Czechoslovak Chem. Comm. 2008;73:1261–1270. [Google Scholar]
- 39.Liu B, McLean AD. J. Chem. Phys. 1973;59:4557–4558. [Google Scholar]
- 40.Boys SF, Bernardi F. Mol. Phys. 1970;19:553–566. [Google Scholar]
- 41.Hay PJ, Wadt WR. J. Chem. Phys. 1985;82:299–310. [Google Scholar]
- 42.Knoll EH, Friesner RA. J. Phys. Chem. B. 2006;110:18787–18802. doi: 10.1021/jp0619888. [DOI] [PubMed] [Google Scholar]
- 43.Hall ML, Goldfeld DA, Bochevarov AD, Friesner RA. J. Chem. Theory Comput. 2009;5:2996–3009. doi: 10.1021/ct9003965. [DOI] [PMC free article] [PubMed] [Google Scholar]
- 44.Goldfeld DA, Bochevarov AD, Friesner RA. J. Chem. Phys. 2008;129:214105. doi: 10.1063/1.3008062. [DOI] [PMC free article] [PubMed] [Google Scholar]
- 45.Rinaldo D, Tian L, Harvey JN, Friesner RA. J. Chem. Phys. 2008;129:164108. doi: 10.1063/1.2974101. [DOI] [PMC free article] [PubMed] [Google Scholar]
- 46.Sinnokrot MO, Sherrill CD. J. Am. Chem. Soc. 2004;126:7690–7697. doi: 10.1021/ja049434a. [DOI] [PubMed] [Google Scholar]
- 47.Tsuzuki S, Honda K, Uchimaru T, Mikami M. J. Chem. Phys. 2005;122:144323. doi: 10.1063/1.1876092. [DOI] [PubMed] [Google Scholar]
- 48.Tsuzuki S, Honda K, Uchimaru T, Mikami M, Tanabe K. J. Am. Chem. Soc. 2000;122:3746–3753. [Google Scholar]
- 49.Pittner J, Hobza P. Chem. Phys. Lett. 2004;390:496–499. [Google Scholar]
- 50.Moller C, Plesset MS. Phys. Rev. 1934;46:0618–0622. [Google Scholar]
- 51.Headgordon M, Pople JA, Frisch M. J. Chem. Phys. Lett. 1988;153:503–506. [Google Scholar]
- 52.Pople JA, Headgordon M, Raghavachari K. J. Chem. Phys. 1987;87:5968–5975. [Google Scholar]
- 53.Scuseria GE, Schaefer HF. J. Chem. Phys. 1989;90:3700–3703. [Google Scholar]
- 54.Valdes H, Pluhackova K, Pitonak M, Rezac J, Hobza P. Phys. Chem. Chem. Phys. 2008;10:2747–2757. doi: 10.1039/b719294k. [DOI] [PubMed] [Google Scholar]
- 55.Jaguar, version 7.6. New York: Schrödinger, LLCNY; 2009. [Google Scholar]
- 56.Friesner RA. Chem. Phys. Lett. 1985;116:39–43. [Google Scholar]
- 57.Friesner RA. J. Chem. Phys. 1986;85:1462–1468. [Google Scholar]
- 58.Friesner RA. J. Chem. Phys. 1987;86:3522–3531. [Google Scholar]
- 59.Friesner RA. J. Phys. Chem. 1988;92:3091–3096. [Google Scholar]
- 60.Martinez TJ, Carter EA. Modern Electronic Structure Theory, Part II. volume 2. Singapore: World Scientific; 1995. Pseudospectral methods applied to the electron correlation problem; p. 1132. [Google Scholar]
- 61.Kaminski GAMJR, Murphy RB, Braden DA, Friesner RA. J. Chem. Theory Comput. 2005;1:248–254. doi: 10.1021/ct049880o. [DOI] [PubMed] [Google Scholar]
- 62.Bondi A. J. Phys. Chem. 1964;68:441–451. [Google Scholar]
- 63.MMShare, version 18109. New York, NY: Schrödinger, Inc.; 2009. [Google Scholar]
- 64.Pitonak M, Janowski T, Neogrady P, Pulay P, Hobza P. J. Chem. Theory Comput. 2009;5:1761–1766. doi: 10.1021/ct900126q. [DOI] [PubMed] [Google Scholar]
- 65.Takatani T, Hohenstein EG, Malagoli M, Marshall MS, Sherrill CD. J. Chem. Phys. 2010;132:144104. doi: 10.1063/1.3378024. [DOI] [PubMed] [Google Scholar]
Associated Data
This section collects any data citations, data availability statements, or supplementary materials included in this article.