Abstract
Quantitative ultrasound (QUS) is an imaging technique that can be used to quantify tissue microstructure giving rise to scattered ultrasound. Other ultrasonic properties, e.g., sound speed and attenuation, of tissues have been estimated versus temperature elevation and found to have a dependence with temperature. Therefore, it is hypothesized that QUS parameters may be sensitive to changes in tissue microstructure due to temperature elevation. Ultrasonic backscatter experiments were performed on tissue-mimicking phantoms and freshly excised rabbit and beef liver samples. The phantoms were made of agar and contained either mouse mammary carcinoma cells (4T1) or chinese hamster ovary cells (CHO) as scatterers. All scatterers were uniformly distributed spatially at random throughout the phantoms. All the samples were scanned using a 20-MHz single-element f∕3 transducer. Quantitative ultrasound parameters were estimated from the samples versus increases in temperature from 37 °C to 50 °C in 1 °C increments. Two QUS parameters were estimated from the backscatter coefficient [effective scatterer diameter (ESD) and effective acoustic concentration (EAC)] using a spherical Gaussian scattering model. Significant increases in ESD and decreases in EAC of 20%–40% were observed in the samples over the range of temperatures examined. The results of this study indicate that QUS parameters are sensitive to changes in temperature.
INTRODUCTION
The ultrasonic properties of tissues have been observed to change with the temperature of the tissue. Damianou et al.,1 observed temperature dependence of attenuation in dog muscle, liver and kidney over a temperature range from room temperature to 70 °C. Other investigators measured the variation of speed of sound and attenuation slope in canine liver samples for a temperature range of 22 °C to 95 °C (Ref. 2). Their results indicated that variations of sound speed and attenuation have different characteristics over different temperature ranges in the canine liver. For example, Techavipoo and coworkers observed that the sound speed increased from 20 °C to 60 °C and then decreased from 60 °C to 95 °C (Ref. 2). Bamber and Hill found that changes in attenuation coefficients with elevations in temperature were more significant at higher frequencies in different tissue samples such as bovine and human liver.3 Nasoni and co-workers measured the changes in sound speed in canine liver, kidney and muscle for temperatures ranging from 35 °C to 45 °C (Ref. 4). Researchers have measured the changes in sound speed and attenuation in fatty tissue versus elevation of temperature and observed different characteristics than in other soft tissue.3, 5, 6 For example, the speed of sound of fatty tissues will actually decrease with increasing temperature until about 50 °C (Ref. 3).
Aside from sound speed and attenuation, the changes in the energy of the backscattered signal have also been quantified versus temperature. Straube and Arthur investigated the changes in backscattered power in the temperature range of 37 °C to 50 °C for fat and muscle.7 Other investigators have examined the changes in backscattered energy from beef liver, turkey breast and pork rib muscle versus elevation in temperature.8 They found that the backscatter coefficient changed monotonically with temperature with either positive or negative slope depending on the scan location.
Quantitative ultrasound (QUS) techniques have been widely used to parameterize the backscattered power spectrum from tissues in order to estimate the size, shape and mechanical properties of tissue microstructure.9 QUS techniques have been used to detect and classify different kinds of cancer in vivo.10, 11, 12, 13 Parameterization of the backscattered rf signals through the normalized backscattered power spectra have allowed the correlation of ultrasonic signals to underlying tissue morphology (subwavelength).13, 14 Specifically, parameters such as the effective scatterer diameter (ESD) have been related to the size of dominant scatterers in tissues and the effective acoustic concentration (EAC) have been related to the density of structures responsible for scattering.14, 15 Furthermore, QUS techniques relying on normalized backscattered power spectra have been used to assess apoptosis and necrosis of tumors undergoing both thermal therapy and chemotherapy.16, 17, 18, 19
Because QUS parameters have provided a unique set of descriptors to classify tissues, it is of interest to quantify how these parameters change in a tissue versus temperature. In this report, the backscatter coefficient and the ESD and EAC were estimated versus elevations in temperature in biophantoms and liver samples. Biophantoms containing cells as scatterers were constructed to observe changes in QUS parameters versus temperature elevations. Cells were used as the scatterer because it has been hypothesized that cells are a prominent source of scattering in many tissues.9, 20, 21, 22 Fresh beef and rabbit liver samples were also used to monitor the changes in QUS parameters due to temperature elevations. In Sec. 2, the experimental methods used to quantify the changes in QUS parameters versus temperature are described. The experimental results from biophantoms and liver samples are provided in Sec. 3. Finally, Sec. 4 provides some conclusions regarding the study
EXPERIMENTAL METHODS
Biophantom construction
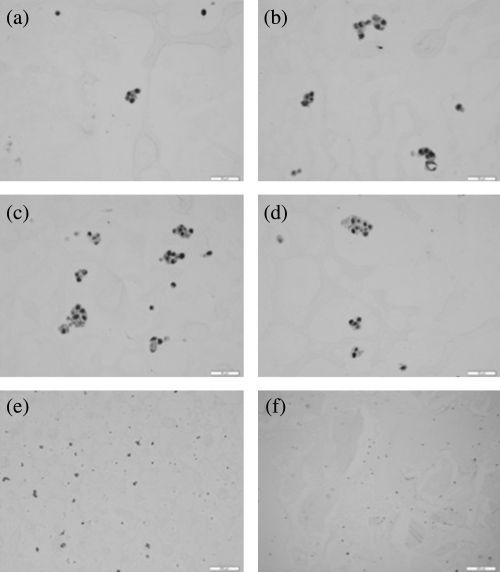
Several different trial formulations were attempted using cells in agar to create useful biophantoms. Cells were grown and harvested in our laboratory cell culture facility. After the cells reached the targeted confluency in the flask the cells were: washed, trypsinized, counted using a hemocytometer and centrifuged. After the cells were centrifuged, the supernatant was removed leaving a cell pellet. The cell pellet was then gently resuspended. Cells were then mixed in agar to form a biophantom. Different trial formulations were explored with the 2% agar base and different proportions of saline, water and eventually cell growth media. After construction of the cell biophantom, it was assumed that cells were dead or in the process of dying. The morphologies of the cells in the agar phantom were examined under a microscope after initial construction of the biophantom and after a temperature experiment. In both cases, the cells were observed to maintain a round shape with clearly observed nuclei in most cells. However, increases in cytoplasmic vacuoles were observed in biophantoms that had undergone more thermal dose. Images from H&E stained histopathological slides of 4T1 biophantom at different temperature elevations are shown in Figs. 1a, 1b, 1c, 1d, where the amount of cytoplasmic vacuoles increases with increase in thermal dose. The intent of these experiments was not to understand scattering from a cellular structure but to record the changes in backscatter properties from a microscopic biological scatterer due to heating.
Figure 1.
(Color online) Histopathology images of 4T1 biophantom at (a) 37 °C (b) 40 °C (c) 45 °C (d) 50 °C (e) 37 °C and (f) CHO biophantom at 37 °C. The scale bar in (a), (b), (c) and (d) is 50 μm, and in panels (e) and (f) is 200 μm.
Once the 2% agar and media decreased to a temperature of 48 °C from 80 °C, the cell pellet was then resuspended gently in the liquid agar to minimize cell clustering. The amount of agar used was calculated to achieve the targeted concentration of 4 × 10⁶ to 5 × 10⁶ cells per mL. The new mixture of cells with the 2% agar and cell media were then placed into single well in a 6-well plate. The 6-well plate was placed in the refrigerator for 15 minutes then put on the lab bench for another 15 minutes to bring the biophantom back to room temperature. The biophantom was carefully removed from the well using a spatula in preparation for the scanning. The cylindrical shaped biophantom had a mean height and diameter of 17 mm and 34 mm, respectively. After scanning, the biophantom was placed in 10% formalin for 24 h. Samples were sliced and submitted for histology, examined under a light microscope, and the morphology of the cells was examined. From histopathological slides it was verified that the cells were distributed spatially at random in the biophantom with minimal clustering apparent as shown in Figs. 1e, 1f taken from H&E stained histology slides of 4T1 and CHO biophantoms respectively at a magnification of 10x. Less clustering of cells were observed in the CHO than for 4T1 biophantoms which was due to the characteristics of the respective cell types. The cell morphology was examined from the histopathological slides at different time points after construction of the biophantoms. This was done by keeping the biophantoms at 37 °C after the cooling process and making histopathological images at different time points. Three hours after the construction of the biophantom, the changes in cell morphology became noticeable under microscopic evaluation consistent with cell degradation. Therefore, all scans of biophantoms were conducted within three hours of construction.
Liver samples
Fresh beef liver samples from different cows were obtained from the local butcher shop (Edgar County Locker, Paris, IL). The livers came from animals that were all from the same age group of 18–24 months and similar health conditions. The bovine liver samples were obtained from the butcher shop within 6–8 h after slaughter. After slaughtering, the liver samples were refrigerated until being transferred to the lab. Ultrasonic experiments were conducted within 12–18 h of the removal of the liver from the body.
Fresh liver samples were extracted from male New Zealand white rabbits acquired from Myrtle’s Rabbitry (Tompson’s Station, TN). The rabbits had been on a special fatty diet.23 The basal diet contained 10% fat, 1% cholesterol, 0.11% Mg, 14% protein and 54% carbohydrates (Catalog No. 1811279, 5TZB, Purina Test Diet, Richmond, IN). Therefore, the rabbit livers had a higher fat content than a normal rabbit liver. Ultrasonic experiments were conducted within 15 minutes of the removal of the liver from the body. The short time between removal of liver from the rabbits and scanning with ultrasound allowed us to better control biological degradation of the livers that occur over hours after extraction.
Ultrasonic methods
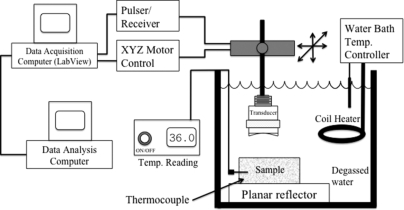
A schematic of the experimental setup is shown in Fig. 2. A needle thermocouple (Omega Engineering, Inc., Stamford, CT) was placed within the samples and was used to monitor the temperature in the samples with an accuracy of 0.1 °C. The sample was completely submerged and a 20-MHz single-element f∕3 transducer (Model: IS2002HR, Valpey Fisher Instruments Inc, Hopkinton, MA) was used for scanning. The transducer had a focal length and aperture diameter of 1.905 cm and 0.635 cm, respectively. For scanning, liver samples were immersed in 0.9% saline solution made from degassed water and the biophantoms were immersed in a tank of degassed water. The transducer had a bandwidth of 14 to 26 MHz at −6 dB. To obtain low variance estimates a bandwidth of 10 to 28 MHz at −10 dB was used. The transducer was operated in pulse-echo mode using a Panametrics 5900 pulser∕receiver (GE Panametrics, Inc., Waltham, MA) and the echo signals were recorded and digitized with a 14 bit, 200 MHz A∕D card (Model: PDA14-200, Signatec, Newport Beach, CA) and downloaded to a PC computer for postprocessing. The sampling rate used to digitize the received signals was 200 MHz. In an experiment, the sample was held stationary and the transducer was moved using a computer-controlled micropositioning system (Daedal, Inc., Harrisburg, PA).
Figure 2.
Experimental setup.
For QUS analysis, rf signals backscattered from the samples were recorded. A step size of 200 μm was used between consecutive scan lines (approximately one full beamwidth). At each temperature value, 40 scan lines were acquired from different locations. A mechanical coil heater (Waage Electric Inc., Kenilworth, NJ) was used to heat the water, which also heated the phantom uniformly. The mechanical coil heater was controlled using a water bath temperature controller (Model YS172, Yellow Spring Instrument Co., Inc., Yellow Spring, OH). The temperature was allowed to rise in the samples. The temperature in the sample was recorded by the thermocouple, and signals were recorded at every 1 °C increase in temperature in the samples.
Sound speed and attenuation were also estimated in the phantoms and liver samples versus temperature using time of flight and insertion loss methods, respectively.24 To estimate sound speed, arrival times of received pulses were measured with and without the sample in the water path between the transducer and a planar PlexiglasTM reflector. The sound speed in the sample cm was computed from
| (1) |
where cf is the speed of sound in the surrounding fluid media, t3 is the propagation time to the reflector measured when no sample is in the path, and t1 and t2 are the arrival times of the frontwall of the sample and the sample∕reflector interface echoes, respectively. The propagation times were estimated using cross correlation. For example, the time difference t3− t1 was estimated by cross-correlating the signal from reflector when no sample in the path with the signal from the frontwall of the sample.
Using the speed of sound estimated from Eq. 1, the sample thickness D was calculated. The attenuation coefficient was estimated using
| (2) |
where |F2(f)| and |F3(f)| are the frequency response of the time domain reflected signal from the PlexiglasTM reflector with and without the sample in the path, respectively.
Cylindrical shaped bio-phantoms, containing either CHO cells or 4T1 cells, and fresh liver samples were used for the QUS estimation experiments. B-mode images of the scanned areas were constructed. Regions of interest (ROIs) in the B-mode images were examined for the spectral content of the backscattered rf echoes. Square shaped ROIs of size 30λ by 30λ (λ is the wavelength at the center frequency of the transducer) were constructed. The backscatter coefficient (BSC) was estimated from the backscattered rf signals and a reference scan.25 The reference scan was obtained from the PlexiglasTM planar reflector located at the focus of the transducer.
Estimates of the ESD were obtained by using a spherical Gaussian scattering model. In the frequency domain, the normalized, theoretical power spectrum is given by12, 26
| (3) |
where L is the gate length (mm), q is the ratio of aperture radius to distance from the region of interest, f is the frequency (MHz) and aeff is the effective scatterer radius. The quantity, , is termed the effective acoustic concentration (EAC) and is the product of the number of scattering particles per unit volume (mm3), ρ, and the square of the fractional change in the impedence between the scattering particles and the surrounding medium, zvar = (Z − Z0)∕Z0, where Z and Z0 are the acoustic impedance of the scatterers and the surrounding medium respectively. The ESD and EAC were determined by comparing the measured normalized power spectrum from each ROI to the theoretical power spectrum from Eq. 3.
The application of heat caused damage to the cells in the tissue that depended on both the elevation temperature and the duration of the exposure. To monitor the damage, the thermal dose was calculated using27
| (4) |
where T is the temperature in °C, t is the time in minutes at temperature T, R = 0.5 for T > 43 °C; and R = 0.25 for T ≤ 43 °C.
EXPERIMENTAL RESULTS
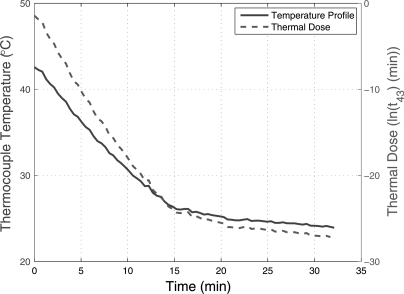
The biophantoms were constructed to understand the ultrasonic scattering from cells. Our findings indicated that using the respective growth media in the construction of the biophantom was the most optimal formulation that resulted in minimal observed morphological changes in the cell over the duration of the experiments. The temperature profiles of the biophantoms were measured using a needle thermocouple after the mixture of the cells were poured into the six well plate as shown in Fig. 3. The thermal dose was less than 0.25 min for the entire cooling process of the biophantom.
Figure 3.
(Color online) Temperature profile of the biophantom after the mixture of cells and agar were poured into the six well plate until the start of the ultrasound experiment and the corresponding thermal dose.
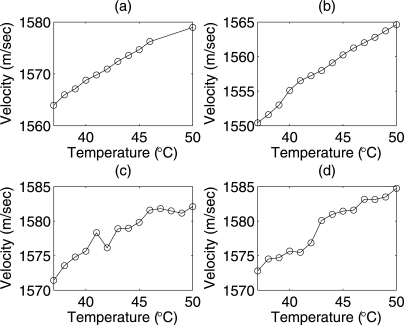
The estimates of sound speed versus temperature for the different samples (biophantoms and liver samples) are shown in Fig. 4. The estimates of sound speed increased monotonically in both phantoms from 1550 to 1580 m∕s with increases in temperature [Figs. 4a, 4b]. The sound speed in the rabbit liver samples and beef liver samples increased with increasing temperature from 1571 to 1582 m∕s [Fig. 4c, 4d].
Figure 4.
Estimated sound speed from (a) CHO biophantom (b) 4T1 biophantom, (c) rabbit liver and (d) beef liver samples versus temperature from 37 °C to 50 °C.
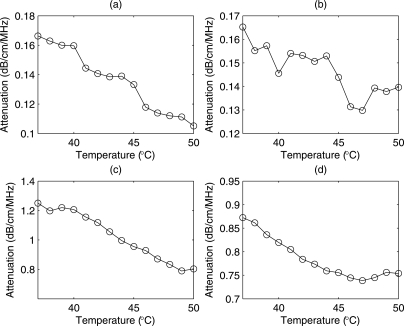
With increases in temperature the mean attenuation coefficients were observed to decrease by 0.05 dB∕cm∕MHz and 0.03 dB∕cm∕MHz in phantoms containing CHO and 4T1 cells, respectively [Fig. 5a, 5b]. The estimated attenuation from the rabbit and beef liver samples are shown in Figs. 5c, 5d, respectively. The attenuation values in the liver samples were higher than what was observed in the biophantoms. The attenuation in the liver samples decreased with increasing temperature. Over the temperature ranges examined, the attenuation coefficients decreased by more than 10% for all samples. The attenuation values estimated in the liver samples were similar to values published by various researchers.3, 5, 6, 28 The results indicated a change in speed of sound less than 2%–3% but attenuation changes were 10%–20%, which confirms that changes in attenuation are more sensitive than changes in speed of sound to temperature changes. For speed of sound and attenuation calculations it was verified experimentally that there were no significant increases∕decreases in the sample thicknesses after being submerged in degassed water or saline. The average speed of sound and attenuation slopes were estimated from three samples of the respective biological media.
Figure 5.
Estimated attenuation from (a) CHO biophantom (b) 4T1 biophantom, (c) rabbit liver and (d) beef liver samples versus temperature from 37 °C to 50 °C.
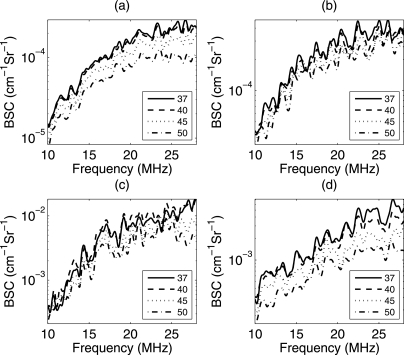
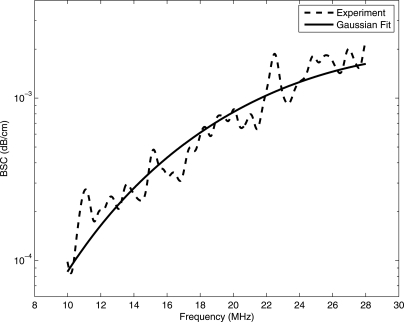
Examples of the average BSC versus temperature for the CHO and 4T1 biophantoms are shown in Figs. 6a, 6b, respectively. The average BSC from the rabbit and beef liver samples are shown in Figs. 6c, 6d, respectively. The slopes of the BSC curves changed with increasing temperature for all the samples. The estimated BSCs are compensated for attenuation using the attenuation slopes estimated for each temperature (shown in Fig. 5) for the respective biological media. To estimate ESD and EAC, the BSC from each ROI was fitted with a spherical Gaussian scattering model from Eq. 3. Four of each type biophantoms, six beef liver samples, and three rabbit livers samples were used for the backscatter experiments. An example BSC from a single ROI in the beef liver sample and the spherical Gaussian fit is shown in Fig. 7. From Fig. 7, the Gaussian model appeared to fit the backscatter data well; therefore, a Gaussian model was used to fit the data rather than a linear model of scattering.
Figure 6.
Backscatter coefficient at different temperatures for (a) CHO biophantom, (b) 4T1 biophantom and (c) rabbit liver sample (d) beef liver samples (the legend bar is in °C).
Figure 7.
Comparison of backscatter coefficient and Gaussian model.
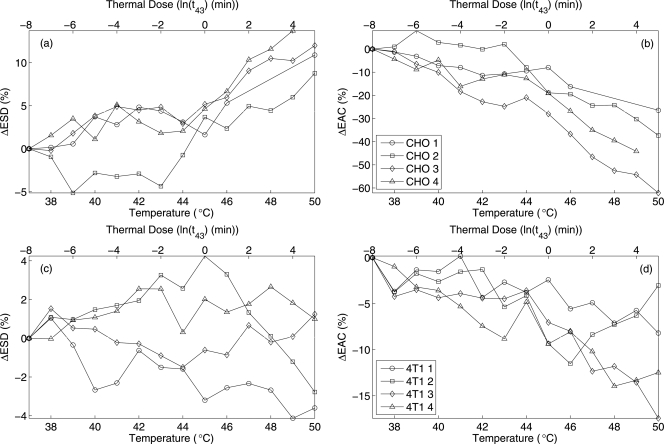
The mean of the estimates of ESD and EAC were calculated from four bio-phantoms of each type containing the two different cell types. The estimated ESD values were 24 ± 2 μm for CHO and 32 ± 3 μm for the 4T1 phantoms at 37 °C. The estimated EAC for CHO and 4T1 phantoms were 12.3 ± 3.4 and 12.5 ± 0.9 dB∕mm3, respectively. The percentage changes in ESD and EAC versus temperature and mean thermal dose with respect to the corresponding quantity at 37 °C [e.g., ΔESD%(40°) = 100% × (ESD(40°)−ESD(37°))∕ESD(37°)] are shown in Figs. 8a, 8b, 8c, 8d. The mean thermal dose was estimated from all the experiments conducted for the respective type of sample. A change of 5%–10% in the ESD for both the biophantoms over the temperature range was observed. The EAC was observed to change most dramatically from 15%–40% over the temperature ranges with a monotonically decreasing trend versus increasing temperature.
Figure 8.
Changes in ESD and EAC with increasing temperature and mean thermal dose (a) ΔESD for CHO, (b) ΔEAC for CHO, (c) ΔESD for 4T1, and (d) ΔEAC for 4T1.
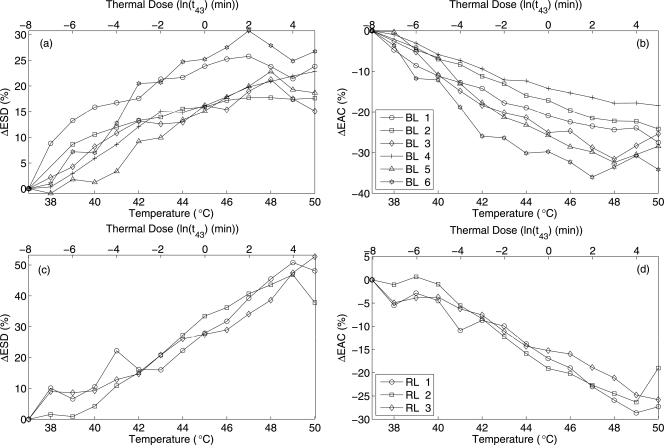
Two different experimental setups were used to estimate QUS parameters from beef liver samples. One set of experiments was similar to the previously described experiments for the biophantoms and in the second set of experiments the beef liver samples were wrapped with saran layer of thickness 20 μm. The second setup was used to verify if the saline absorption into the liver samples had any effects on the changes in QUS parameters. The beef liver samples had less than 8% increase in weight due to being in the saline solution for the duration of the experiments and the sample wrapped with saran layer resulted in even smaller changes in weight. The results shown in solid lines (BL 1, BL 2 and BL 3) of Fig. 9a, 9b are from the first setup and the dashed line (BL 4, BL 5 and BL 6) are from the second experimental configuration where liver samples were wrapped with saran layer. The average ESD and EAC estimates at 37 °C were 26 ± 3 μm and 22.7 ± 3 dB∕mm3, respectively. For the beef liver samples, significant increases in the ESD and decreases in EAC with increasing temperature were observed for all the samples tested. The changes in ESD and EAC revealed similar trends with increases in temperature for both of the experimental setups.
Figure 9.
Changes in ESD and EAC with increasing temperature and mean thermal dose (a) ΔESD for beef liver, (b) ΔEAC for beef liver, (c) ΔESD for rabbit liver, and (d) ΔEAC for rabbit liver samples.
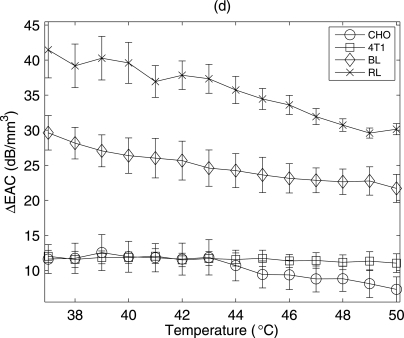
A large spread in the QUS parameters versus temperature in the beef liver were observed. The variation was hypothesized to be due to biological variation from handling of the beef livers, i.e., the time from extraction to scanning of the liver could not be accurately controlled. To test this hypothesis, QUS estimates from rabbit livers versus temperature were conducted after carefully controlling the time between extraction and scanning. Changes in the QUS parameters versus temperature from the rabbit liver samples were estimated as shown in Fig. 9c, 9d. These samples were extracted from animals with similar health conditions, ages and diets. The time lag between the extraction of the liver from the animal and the start of the ultrasound experiment was less than 15 minutes. After the sample was extracted from the animal it was kept in saline solution at 37 °C until the start of ultrasound experiment. Significant increases in ESD were observed for all the liver samples tested. The estimated ESD and EAC at 37 °C for the samples were 19 ± 3 μm and 40.8 ± 3.6 dB∕mm3, respectively. The EAC decreased monotonically with increasing temperature for all the liver samples. The variations from sample to sample were very small compared to the variation observed from the beef liver samples. To examine the variance of the estimated parameters within a single sample, an example of the mean and variance of the estimated EAC from all the data blocks within a single sample with increasing temperature is shown in Fig. 10 for biophantoms and liver samples. The variance was within approximately 10% of the mean values for the all the samples.
Figure 10.
The mean and the variance of EAC estimates with increasing temperature for biophantoms and liver samples.
Typically, each experiment lasted for approximately 45 minutes. As the time of the experiment increased, increased changes in the backscatter properties were also expected due to increased degradation of the biological samples. Therefore the changes in the QUS parameters may depend both on the application of heat and the duration of the experiment. To further investigate these dependencies, the changes in ESD and EAC for the variable and constant temperature of 37 °C are shown in Table TABLE I. for the respective samples. For a particular sample the ΔESD (%) for the constant temperature case is equal to the change in ESD from 0 minutes to 45 minutes at a constant 37 °C [e.g. ΔESD (%) at 37 °C = 100 × [ESD(37 °C) at 45 min − ESD(37 °C) at 0 min]∕[ESD(37 °C) at 0 min]]. Specifically, 45 minutes was chosen because this was the average duration of the heat experiments. For the variable temperature case, the average change in ESD from 37 °C to 50 °C was estimated (e.g., ΔESD (%) = Average[100 × (ESD(50°) − ESD(37°))∕ESD(37°)]). Similarly ΔEAC (%) was calculated for all the samples. The results shown in Table TABLE I. indicate the changes in ESD and EAC estimates in the samples were due to both elevations in temperature and the duration of the experiments. However, it can be observed that the changes in ESD for the liver samples and CHO biophantoms had a significantly greater dependence on the application of heat whereas for the 4T1 biophantom the duration of the experiment may have played a more significant role. Table TABLE I. also indicates that the large changes in EAC for all the samples are due to rise in temperature except for the 4T1 biophantoms.
Table 1.
Changes in ESD and EAC at constant temperature of 37 °C and for variable temperature case.
| Constant temperature at 37 °C | Variable temperature | |||
|---|---|---|---|---|
| Sample | ΔESD(%) | ΔEAC(%) | ΔESD(%) | ΔEAC (%) |
| CHO | 7.32 | −15.00 | 10.67 | −41.97 |
| 4T1 | 4.18 | −9.05 | −1.03 | −10.22 |
| Rabbit Liver | 0.10 | 3.32 | 39.56 | −25.82 |
| Beef Liver | 0.70 | 5.01 | 16.32 | −23.91 |
DISCUSSION AND CONCLUSION
Changes in QUS parameters from tissues versus temperature are reported. Both physical and ultrasonic properties of tissues can undergo changes during temperature elevation. For example, the attenuation of ultrasound typically decreases during temperature elevation and the sound speed in most tissues increases.3 In terms of QUS parameters, the decreasing attenuation may result in an apparent change in the ESD estimate. However, in this work the effects of changes in attenuation were compensated in the estimates of ESD and EAC. Likewise, the increase in sound speed results in an increase of the wavelength of ultrasound at a particular frequency. This increase in wavelength can result in a larger resolution cell size that can lead to changes in estimates of EAC.
Ultrasonic backscatter experiments were conducted on two types of biological phantoms made of agar containing either 4T1 and CHO cells and fresh beef and rabbit liver samples to understand the variations in QUS parameters with increasing temperature. A novel technique was developed to construct bio-phantoms including cells with uniform spatial distribution and random spatial locations throughout the phantom, which was verified from histological slides. These bio-phantoms were useful for performing controlled experiments with cells acting as scatterers. Each experiment lasted for less than 45 minutes. Optically it was verified that the cells did not exhibit significant variations in the morphology for three hours from the time of phantom construction without any application of heat. Therefore, variations in the QUS parameters in biophantoms were assumed to be due to a combination of the duration of the experiments and elevations in temperature. It is expected that the cells were dying and dissolving over time due to their presence in a non ideal medium.
From the results it was observed that some QUS parameters were more sensitive to temperature changes than others for a particular type of sample. Speed of sound increased with increasing temperature by less than 1% in all the samples. The ultrasonic attenuation decreased by 10%–20% with increases in temperature in all the samples. The results suggest that the attenuation coefficient, ESD and EAC are the quantitative parameters most sensitive to temperature elevation in tissues. The similar characteristics of the ESD curves from CHO cell types and EAC curves from both the cell types demonstrated the repeatability of this technique. The ESD variations with application of heat from 4T1 cell type did not follow any particular trend. Significant changes in ESD and EAC parameters of 20%–45% were observed from the fresh rabbit and fresh beef liver samples. The results also suggest that the change in QUS parameters are also related to the thermal dose. The mean thermal dose estimated from all the experiments were 0.0004 min and 230.4 min at 37 °C and 50 °C, respectively.
Changes in the QUS parameters in samples maintained at constant temperature for a period of 45 minutes were also observed. For the liver samples the results suggest that the significant changes in the QUS parameters were due to the elevation of temperature. The saline solution did not affect the change in QUS parameter because the results from beef liver samples using the two different experimental setups had similar results. The experiments conducted by wrapping the beef liver samples eliminated the effects of saline solution on the sample.
Due to the nature of biological sample, large variations existed in sample-to-sample results in the beef livers, but the results still suggest that the ESD and EAC were sensitive to application of heat. Larger variance in the trends were observed for the beef livers compared to the rabbit livers. This variation may have been due to the control of the liver samples. The rabbit livers were from rabbits on the same diet for approximately the same time. More importantly, for the rabbit experiments the time of liver extraction to the experiments were less than 15 minutes. However, the beef livers came from animals that were not tightly controlled for diet and the time between death, extraction, and experiments was also not able to be controlled. These factors may have contributed to the variance observed in the trends versus heating. Further investigation is required to monitor changes in QUS parameters with application of heat with respect to sample quality in terms of age of the animal, time between sample extraction from the animal to experiments, and refrigeration conditions. In the future, we plan to design experiments to investigate the sample-to-sample variability of QUS parameters with respect to the sample quality and time between sample extraction and experimental measurements.
Time-domain cross correlation methods have been used by various researchers to estimate changes in sound speed with temperature elevation.29, 30 The changes in speed of sound are then used to estimate temperature elevation in the sample. Using cross correlation techniques to detect time shifts, investigators have claimed the ability to detect changes in temperature as small as 0.5 °C with good spatial resolution.30 However, such techniques are limited by motion in the subsequent acquisition scans.29 Motion artifacts are especially predominant in abdominal organs, e.g., the liver or kidney, where centimeter-sized displacements can cause large estimate errors in micrometer-sized displacements due to sound speed changes. The QUS technique is robust against motion artifacts because it depends only on the underlying tissue microstructure. Therefore, monitoring temperature elevations with QUS may be more robust against tissue motion than sound speed techniques to estimate temperature. The results reported here also suggest that changes in QUS parameters are more sensitive to rises in temperature than sound speed.
ACKNOWLEDGMENTS
The authors would like to acknowledge the technical contributions of Dr. Rita J. Miller. The work was supported by NIH Grant R01-EB008992.
NOMENCLATURE
- aeff
effective scatterer radius
- αm
attenuation coefficient in sample
- cm
speed of sound in the sample
- cf
speed of sound in the surrounding fluid media
- f
frequency
- q
ratio of the transducer aperture radius to distance from the region of interest
- t1, t2, t3
arrival time of different echoes used for speed of sound estimation
- zvar
fractional change in the impedance between the scattering particles and the surrounding medium
- 4T1
mouse mammary carcinoma cells
- CHO
chinese hamster ovary cells
- D
sample thickness
- ESD
effective scatterer diameter
- EAC
effective acoustic concentration
- F2,F3
frequency response of the time domain reflected signal from the PlexiglasTM reflector with and without the sample inserted between, respectively
- HIFU
high intensity focused ultrasound
- L
gate length
- QUS
quantitative ultrasound
- ROIs
regions of interest
- R
constant for thermal dose calculation
- t43
thermal dose in minutes
- W (f)
theoretical backscattered power spectrum using a Gaussian scattering model
- λ
wavelength
- Z0
acoustic impedance of the surrounding medium
- Z
acoustic impedance of the scatterers
- ρ
density of the sample
References
- Damianou C. A., Sanghvi N. T., Fry F. J., and Maass-Moreno R., “Dependence of ultrasonic attenuation and absorption in dog soft tissues on temperature and thermal dose,” J. Acoust. Soc. Am. 102, 628–634 (1997). 10.1121/1.419737 [DOI] [PubMed] [Google Scholar]
- Techavipoo U., Varghese T., Chen Q., Stiles T. A., Zagzebski J. A., and Frank G. R., “Temperature dependence of ultrasonic propagation speed and attenuation in excised canine liver tissue measured using transmitted and reflected pulses,” J. Acoust. Soc. Am. 115, 2859–2865 (2004). 10.1121/1.1738453 [DOI] [PubMed] [Google Scholar]
- Bamber J. C. and Hill C. R., “Ultrasonic attenuation and propagation speed in mammalian tissue as a function of temperature,” Ultrasound Med. Biol. 5, 149–157 (1979). 10.1016/0301-5629(79)90083-8 [DOI] [PubMed] [Google Scholar]
- Nasoni R. L., Bowen T., Connor W. G., and Sholes R. R., “In vivo temperature dependence of ultrasound speed in tissue and its application to noninvasive temperature monitoring,” Ultrason. Imaging 1, 34–43 (1979). 10.1016/0161-7346(79)90004-X [DOI] [PubMed] [Google Scholar]
- Goss S. A., Johnston R. L., and Dunn F., “Comprehensive compilation of empirical ultrasonic properties of mammalian tissue,” J. Acoust. Soc. Am. 64, 423–457 (1978). 10.1121/1.382016 [DOI] [PubMed] [Google Scholar]
- Gammell P. M., Croissette D. H. L., and Heyser R. C., “Temperature and frequency dependence of ultrasonic attenuation in selected tissues,” Ultrasound Med. Biol. 5, 269–277 (1979). 10.1016/0301-5629(79)90018-8 [DOI] [PubMed] [Google Scholar]
- Straube W. L. and Arthur R. M., “Theoretical estimation of the temperature dependence of backscattered ultrasonic power for noninvasive thermometry,” Ultrasound Med. Biol. 20, 915–922 (1994). 10.1016/0301-5629(94)90051-5 [DOI] [PubMed] [Google Scholar]
- Arthur R. M., Straube W. L., Starman J. D., and Moros E. G., “Noninvasive temperature estimation based on the energy of backscattered ultrasound,” Med. Phys. 30, 1021–1029 (2003). 10.1118/1.1570373 [DOI] [PubMed] [Google Scholar]
- Oelze M. L., Zachary J. F., and W. D.O’Brien, Jr., “Parametric imaging of rat mammary tumors in vivo for the purpose of tissue characterization,” J. Ultrasound Med. 21, 1201–1210 (2002). [DOI] [PubMed] [Google Scholar]
- Miller J. G., Perez J. E., Mottley J. G., Madaras E. I., Johnston P. H., Blodgett E. D., L. J.ThomasIII, and Sobel B. E., “Myocardial tissue characterization: an approach based on quantitative backscatter and attenuation,” Ultrasonic Symp. Proc. 2, 782–793 (1983). [Google Scholar]
- Feleppa E. J., Liu T., Shao M. C., Fleshner N., Reuter V., and Fair W. R., “Ultrasonic spectral-parameter imaging of the prostrate,” Int. J. Imaging Syst. Technol. 8, 11–25 (1997). [DOI] [Google Scholar]
- Lizzi F. L., Astor M., Liu T., Deng C., Coleman D. J., and Silverman R. H., “Ultrasonic spectrum analysis for tissue assays and therapy evaluation,” Int. J. Imaging Syst. Technol. 8, 3–10 (1997). [DOI] [Google Scholar]
- Oelze M. L. and W. D.O’Brien, Jr., “Application of three scattering models to the characterization of solid tumors in mice,” Ultrason. Imaging 28, 83–96 (2006). [DOI] [PubMed] [Google Scholar]
- Oelze M. L. and Zachary J. F., “Examination of cancer in mouse models using quantitative ultrasound,” Ultrasound Med. Biol. 32, 1639–1648 (2006). 10.1016/j.ultrasmedbio.2006.05.006 [DOI] [PubMed] [Google Scholar]
- Oelze M. L., W. D.O’Brien, Jr., Blue J. P., and Zachary J. F., “Differentiation and characterization of rat mammary fibroadenomas and 4T1 mouse carcinomas using quantitative ultrasound imaging,” IEEE Trans. Med. Imaging 23, 764–771 (2004). 10.1109/TMI.2004.826953 [DOI] [PubMed] [Google Scholar]
- Czarnota G. J., Kolios M. C., Abraham J., Portnoy M., Ottensmeyer F. P., Hunt J. W., and Sherar M. D., “Ultrasonic imaging of apoptosis: high-resolution non-invasive imaging of programmed cell death in vitro, in situ and in vivo,” Br. J. Cancer 81, 520–527 (1999). 10.1038/sj.bjc.6690724 [DOI] [PMC free article] [PubMed] [Google Scholar]
- Kolios M. C., Czarnota G. J., Lee L., Hunt J. W., and Sherar M. D., “Ultrasonic spectral parameter imaging of apoptosis,” Ultrasound Med. Biol. 28, 589–597 (2002). 10.1016/S0301-5629(02)00492-1 [DOI] [PubMed] [Google Scholar]
- Banihashemi B., Vlad R., Debeljevic B., Giles A., Kolios M. C., and Czarnota G. J., “Ultrasound imaging of apoptosis in tumor response: Novel preclinical monitoring of photodynamic therapy effects,” Cancer Res. 68, 8590–8596 (2008). 10.1158/0008-5472.CAN-08-0006 [DOI] [PubMed] [Google Scholar]
- Vlad R. M., Brand S., Giles A., Kolios M. C., and Czarnota G. J., “Quantitative ultrasound characterization of responses to radiotherapy in cancer mouse models,” Clin. Cancer Res. 15, 2067–2075 (2009). 10.1158/1078-0432.CCR-08-1970 [DOI] [PubMed] [Google Scholar]
- Tunis A. S., Czarnota G. J., Giles A., Sherar M. D., Hunt J. W., and Kolios M. C., “Monitoring structural changes with a scanning acoustic microscope system,” Ultrasound Med. Biol. 31, 1041–1049 (2005). 10.1016/j.ultrasmedbio.2005.04.020 [DOI] [PubMed] [Google Scholar]
- Taggart L. R., Baddour R. E., Giles A., Czarnota G. J., and Kolios M. C., “Ultrasonic characterization of whole cells and isolated nuclei,” Ultrasound Med. Biol. 33, 389–401 (2007). 10.1016/j.ultrasmedbio.2006.07.037 [DOI] [PubMed] [Google Scholar]
- Baddour R. E. and Kolios M. C., “The fluid and elastic nature of nucleated cells: Implications from the cellular backscatter response implications from the cellular backscatter response,” J. Acoust. Soc. Am. 121, EL16–EL22 (2007). 10.1121/1.2401224 [DOI] [PubMed] [Google Scholar]
- King J. L., Miller R. J., J. P.Blue, Jr., W. D.O’Brien, Jr., and J. W.Erdman, Jr., “Inadequate dietary magnesium intake increases atherosclerotic plaque development in rabbits,” Adv. Nutr. Res. 29, 343–349 (2009). 10.1016/j.nutres.2009.05.001 [DOI] [PMC free article] [PubMed] [Google Scholar]
- Madsen E. L., Dong F., Frank G. R., Gara B. S., Wear K. A., Wilson T., Zagzebski J. A., Miller H. L., Shung K. K., Wang S. H., Feleppa E. J., Liu T., W. D.O’Brien, Jr., Topp K. A., Sanghvi N. T., Zaitsen A. V., Hall T. J., Fowlkes J. B., Kripfgans O. D., and Miller J. G., “Interlaboratory comparison of ultrasonic backscatter, attenuation and speed measurements,” J. Ultrasound Med. 18, 615–631 (1999). [DOI] [PubMed] [Google Scholar]
- Insana M. F. and Hall T. J., “Parametric ultrasound imaging from backscatter coefficient measurements: Image formation and interpretation,” Ultrason. Imaging 12, 245–267 (1990). 10.1016/0161-7346(90)90002-F [DOI] [PubMed] [Google Scholar]
- Oelze M., Zachary J. F., and W. D.O’Brien, Jr., “Characterization of tissue microstructure using ultrasounic backscatter: Theory and technique for optimization using a gaussian form factor,” J. Acoust. Soc. Am. 112, 1202–1211 (2002). 10.1121/1.1501278 [DOI] [PubMed] [Google Scholar]
- Sapareto S. and Dewey W., “Thermal dose determination in cancer therapy,” Int. J. Radiat. Oncol., Biol., Phys. 10, 787–800 (1984). [DOI] [PubMed] [Google Scholar]
- Frizzell L. A., Carstensen E. L., and Davis J. D., “Ultrasonic absorption in liver tissue,” J. Acoust. Soc. Am. 65, 1309–1312 (1979). 10.1121/1.382749 [DOI] [PubMed] [Google Scholar]
- Simon C., VanBaren P., and Ebbibi E. S., “Two-dimensional temperature estimation using diagnostic ultrasound,” IEEE Trans. Ultrason. Ferroelectr. Freq. Control 45, 1088–1099 (1998). 10.1109/58.710592 [DOI] [PubMed] [Google Scholar]
- Anand A., Savery D., and Hall C., “Three-dimensional spatial and temporal temperature imaging in gel phantoms using backscattered ultrasound,” IEEE Transaction Ultrason. Ferroelectr. Freq. Control 54, 23–31 (2007). 10.1109/TUFFC.2007.208 [DOI] [PubMed] [Google Scholar]


