

Abstract
Calmodulin (CaM) binding to the type 2 ryanodine receptor (RyR2) regulates Ca release from the cardiac sarcoplasmic reticulum (SR). However, the structural basis of CaM regulation of the RyR2 is poorly defined, and the presence of other potential CaM binding partners in cardiac myocytes complicates resolution of CaM's regulatory interactions with RyR2. Here, we show that a fluorescence-resonance-energy-transfer (FRET)-based approach can effectively resolve RyR2 CaM binding, both in isolated SR membrane vesicles and in permeabilized ventricular myocytes. A small FRET donor was targeted to the RyR2 cytoplasmic assembly via fluorescent labeling of the FKBP12.6 subunit. Acceptor fluorophore was attached at discrete positions within either the N- or the C-lobe of CaM. FRET between FKBP12.6 and CaM bound to SR vesicles indicated CaM binding at a single high-affinity site within 60 Å of FKBP12.6. Micromolar Ca increased the apparent affinity of CaM binding and slowed CaM dissociation, but did not significantly affect maximal FRET efficiency at saturating CaM. FRET was strongest when the acceptor was attached at either of two positions within CaM's N-lobe versus sites in CaM's C-lobe, providing CaM orientation information. In permeabilized ventricular myocytes, FKBP12.6 and CaM colocalized to Z-lines, and the efficiency of energy transfer to both the N- and C-lobes of CaM was comparable to that observed in SR vesicle experiments. Results also indicate that both the location and orientation of CaM binding on the RyR2 are very similar to the skeletal muscle RyR1 isoform. Specific binding of CaM to functional RyR2 channels in the cardiac myocyte environment can be monitored using FKBP biosensors and FRET.
Introduction
Calmodulin (CaM) is a versatile intracellular Ca sensor, capable of modulating the activity of diverse binding partners. CaM is comprised of roughly symmetrical N- and C-lobes that are joined by a flexible hinge (1,2). Ca binding at EF hand motifs within CaM's N- and C-lobes evokes conformational changes within CaM that expose hydrophobic residues and transduce intracellular Ca signals (3). Among CaM's many binding partners are various ion channels (4), including the large intracellular Ca release channels known as ryanodine receptors (RyRs), which are central to excitation-contraction coupling in cardiac and skeletal muscle (5–7).
CaM binding to the cardiac RyR2 channel isoform causes a rightward shift in the steady-state [Ca]-dependence of RyR2 activation in sarcoplasmic reticulum (SR) vesicles (8), a decrease in the frequency and duration of channel opening events in lipid bilayers (9), and a decrease in the frequency of Ca sparks in permeabilized myocytes (10). Meissner and co-workers have demonstrated that the specific disruption of RyR2 CaM binding by targeted substitutions within a core CaM binding sequence results in severe cardiac hypertrophy and early death in mutant mice (11). CaM regulation of RyR2 is therefore crucial for normal cardiac function and development. However, efforts to resolve CaM's functional interactions with the RyR2 specifically have been confounded by the many other potential CaM binding partners that are also present in the cardiac myocyte, including calcineurin, CaM-dependent protein kinase II, and L-type Ca channels (12–14). In addition, the structural basis of RyR2 regulation by CaM remains poorly defined, as 3D mapping of CaM binding by cryo-electron microscopy (cryo-EM) and fluorescence resonance energy transfer (FRET) has thus far been limited to the skeletal muscle RyR1 isoform (7). RyR1 and RyR2 exhibit important isoform differences in CaM regulation, including differences in the functional effect of CaM binding at submicromolar Ca (8), the molecular determinants of binding (15), and the thermodynamics of binding (16). Whether these isoform differences reflect major differences in the location or orientation of CaM binding to the different channel isoforms is not yet clear, and this study aims to help clarify these issues.
In the case of the RyR1 isoform, 3D cryo-EM indicates that CaM binds adjacently to the cleft that separates the handle and clamp regions of the cytoplasmic assembly (17,18). This places CaM near the base of a major structural hinge involved in the translation of large-scale motions of the cytoplasmic and transmembrane assemblies (19). The location of CaM binding predicted by cryo-EM was supported by FRET mapping of CaM bound to the RyR1 isoform (20). These FRET studies further demonstrated that CaM binds to RyR1 in an extended conformation, oriented with its N-lobe nearer to, and its C-lobe farther from, a donor-labeled FKBP subunit. Given the functional difference in effects of CaM on RyR2 versus RyR1 gating (8), it is possible that the relative positions of FKBP and CaM could differ among RyR isoforms.
Here, we use FRET to characterize CaM binding to the RyR2 channel isoform. We examine whether our approach based on site-directed fluorescent labeling of CaM and FKBP12.6 can effectively resolve CaM's interactions with the RyR2, both in SR vesicle preparations and in the more physiological environment of permeabilized ventricular myocytes. We also examine whether CaM's location and orientation when bound to the RyR2 are similar to what has been demonstrated previously for the RyR1 macromolecular complex.
Methods
Synthesis of fluorescent CaMs and FKBP12.6
Fluorescent probes Alexa Fluor 488 C5 maleimide and Alexa Fluor 568 C5 maleimide were purchased from Invitrogen/Molecular Probes (Carlsbad, CA). Fluorescent derivatives of single-cysteine mutants of CaM and FKBP12.6 were prepared and labeled as previously described (20–22). CaM mutants T26C, T34C, Y99C, and T110C were labeled with red-fluorescent Alexa 568 and used as acceptors in FRET experiments. FKBP12.6 was labeled at position 14 or 49 with green-fluorescent Alexa 488 and used as donor in FRET experiments. Stoichiometric labeling of fluorescent CaMs (F-CaMs) and FKBP (F-FKBP) was demonstrated by the absorbance of the bound dye and SDS-PAGE densitometry and confirmed by MALDI-TOF mass spectrometry to ≥95%. The capability of F-CaMs to bind and regulate RyRs was tested in measurements of [3H]ryanodine binding to SR vesicles, as described previously (20).
FRET between F-CaMs and F-FKBP bound to SR vesicles
Cardiac SR vesicles were isolated from fresh homogenates of pig ventricular muscle by differential centrifugation in ice-cold buffers containing protease inhibitors (23) and stored at −80°C. Skeletal muscle heavy SR vesicles were isolated from pig longissimus dorsi (23). FRET samples were prepared as described (20,21). Briefly, SR vesicles (0.4 mg/ml) were incubated with 50 nM F-FKBP for 90 min at 37°C, then spun down (100,000 × g) to remove unbound F-FKBP. The membrane pellet was homogenized and resuspended to a final protein concentration of 10 mg/ml, then used immediately to prepare FRET samples. Fluorescence emission spectra were acquired using a Molecular Devices Gemini EM microplate reader with a 1 J/flash xenon lamp as the excitation source. FRET was measured after incubation of donor-labeled SR vesicles (3 mg/ml final) with acceptor-labeled CaMs in media containing 150 mM KCl, 20 mM K-PIPES (pH 7.0), 5 mM GSH, 1 mM EGTA (pH 7.0), 0.1 mg/ml BSA, 1 μg/ml aprotinin/leupeptin, and sufficient CaCl2 to achieve the desired free [Ca] (as calculated using MaxChelator software, http://maxchelator.stanford.edu). The intrinsic fluorescence of F-FKBP and F-CaMs in solution was unaffected by [Ca]. FRET efficiencies (E) were calculated from the decrease in donor steady-state fluorescence (FD) due to the presence of acceptor (FDA):
| (1) |
Donor-acceptor distances, R, were calculated from
| (2) |
where the Förster distance, R0, is defined as the distance at which FRET = 0.5 (62 Å for the Alexa 488-Alexa 568 donor-acceptor pair (24)). F-CaM association data were fit to a double-exponential association model (25) that includes a fast and a slow phase, the latter likely dependent on the dissociation of a fraction of endogenous CaM that remains bound to isolated SR vesicles (25,26). F-CaM dissociation data were fit to a single exponential decay (25,26). Maximal FRET efficiencies (Emax) and F-CaM affinity constants (Kd) were calculated from F-CaM binding isotherms according to
| (3) |
FRET between F-CaMs and F-FKBP in permeabilized rat ventricular myocytes
Isolation of rat ventricular myocytes was carried out essentially as described (10). All procedures were approved by the Institutional Animal Care and Use Committees. Ventricular myocytes were superfused with relaxing solution containing 0.1 mM EGTA, 5 mM ATP, 10 mM HEPES, 150 mM potassium aspartate, 0.25 mM MgCl2, and 10 mM GSH, at 23°C. The sarcolemma was permeabilized with 50 μg/ml saponin for 30 s. After permeabilization, myocytes were placed in internal solution composed of 1 mM EGTA, 10 mM HEPES, 120 mM K-aspartate, 5 mM ATP, 1 mM MgCl2, 10 mM GSH, 30 nM free [Ca] (calculated using MaxChelator), 10 mM phosphocreatine, 5 I.U./ml creatine phosphokinase, 4% dextran (Mr, 40,000), pH 7.2. Fluorescent FKBP12.6 and CaM were added to the bath as previously described (22,25) at the concentrations indicated. All experiments were performed at 23°C.
Confocal images were acquired using a Biorad (Hercules, CA) Radiance 2100 laser-scanning confocal microscope equipped with an argon ion laser, green helium-neon laser, and a Nikon Fluo 40× oil lens (NA 1.3). F-FKBP fluorescence was excited at 488 nm, and emission was recorded using a 515/15 nm bandpass filter. F-CaM fluorescence emission was recorded using a 600-nm long-pass filter for both direct excitation at 543 nm and FRET associated with 488 nm excitation. Cross talk, either donor fluorescence in the red (>600 nm) channel or acceptor fluorescence at >600 nm excited directly by 488-nm illumination, was <5% and only present in the red channel. FRET efficiency was calculated from donor quench upon F-CaM addition (using Eq. 1) and by enhanced donor fluorescence upon acceptor photobleach: E = 1 – (FD-prebleach/FD-postbleach).
Results
FRET detection of CaM binding to cardiac SR vesicles
We previously showed that F-CaM binding is highly concentrated at Z-lines in permeabilized ventricular myocytes and in patch-clamped intact cells (25). To better resolve CaM interactions specifically with RyR2, we first examined changes in the fluorescence of F-FKBP (labeled at position 49) bound to RyR2 in isolated cardiac SR vesicles. Upon excitation at 488 nm, samples containing the F-FKBP donor alone displayed a single fluorescent peak at 520 nm (Fig. 1 A, solid curve). Repeated excitation of donor-only samples (every 10 s for 10 min) demonstrated no significant loss of donor fluorescence due to photobleaching (F520 nm decreased 0.8 ± 0.1% after 10 min). Addition of an acceptor-labeled F-CaM (600-nm peak; Fig. 1 A, dotted curve) resulted in a rapid and pronounced quench of F-FKBP fluorescence (i.e., FRET), consistent with F-CaM binding in close proximity to F-FKBP. Time courses of FRET in media containing either 100 nM or 300 μM Ca are shown in Fig. 1 B. These data demonstrate rapid binding of F-CaM at both [Ca]s, consistent with binding of both the apo- and Ca-CaM species. Binding approached an apparent equilibrium more rapidly in 100 nM Ca, although FRET was greater at 300 μM Ca at all time points. We next examined F-CaM dissociation after addition of a 50-fold excess of nonfluorescent CaM. Spectra in Fig. 1 C show that 1 h after the addition of nonfluorescent CaM, F-FKBP fluorescence (520 nm) was restored to the level observed in the absence of F-CaM (Fig. 1 A), indicating displacement of F-CaM from binding sites near F-FKBP. Time courses of F-CaM dissociation (Fig. 1 D) further showed that the rate of F-CaM dissociation was slowed by a factor of 4 when Ca was increased from 100 nM to 300 μM (τ = 37 s for the former vs. 2.5 min for the latter; Table 1). These results are consistent with time constants of [35S]CaM dissociation from RyR reported previously (26), and with the effect of Ca in slowing the rate of F-CaM dissociation from Z-lines in permeabilized myocytes (25).
Figure 1.
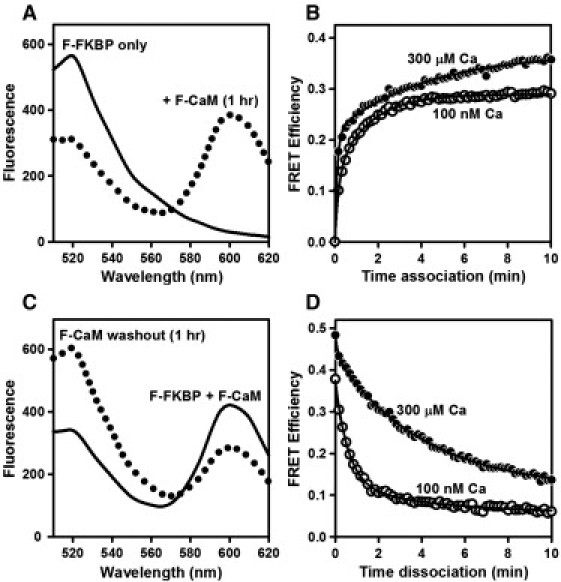
FRET detection of F-CaM association and dissociation. (A) Spectra of F-FKBP (donor) bound to pig cardiac SR vesicles before (solid line) and 1 h after (dotted line) addition of 400 nM F-CaM (acceptor) with 300 μM Ca. (B) Time course of F-CaM association in media containing either 100 nM or 300 μM Ca. (C) Recovery of F-FKBP fluorescence upon F-CaM dissociation with 300 μM Ca. After allowing F-CaM binding to reach equilibrium (solid line), samples were diluted into media containing a 50-fold excess of nonfluorescent CaM for 1 h (dotted line). (D) Time course of F-CaM dissociation in media containing 100 nM or 300 μM Ca. Data are from single experiments, representative of at least three similar experiments. Curves in B and D are fits to a double-exponential association and single-exponential dissociation equations, respectively (Methods; fit parameters are in Table 1). F-CaM was labeled at position 34 (N-lobe).
Table 1.
Fitting parameters for F-CaM association and dissociation
| F-CaM association |
F-CaM dissociation |
|||||
|---|---|---|---|---|---|---|
| Ys | τs (min) | Yf | τf (s) | Y | τ | |
| 100 nM Ca | 0.13 ± 0.01 | 5.5 ± 0.5 | 0.16 ± 0.01 | 39 ± 2.0 | 0.29 ± 0.01 | 37 ± 2.1 s |
| 300 μM Ca | 0.22 ± 0.03 | 8.5 ± 0.6 | 0.15 ± 0.01 | 14 ± 6 | 0.33 ± 0.01 | 2.5 ± 0.1 min |
Parameter fits are to the association and dissociation curves shown in Fig. 1, B and D.
To characterize the steady-state binding of F-CaM using our FRET assay, we measured energy transfer between F-FKBP and F-CaM after 2 h incubation. Spectra in Fig. 2 A show that addition of increasing concentrations of F-CaM (10–500 nM) evoked a progressive decrease in F-FKBP fluorescence at 520 nm. Plots of FRET as a function of F-CaM in 100 nM and 300 μM Ca are shown in Fig. 2 B. At both [Ca]s, FRET data were well fit by models assuming F-CaM binding at a single saturable site. Micromolar [Ca] increased the apparent affinity of CaM binding approximately fourfold (Kd = 93 ± 1 nM versus 26 ± 1 nM, in 100 nM and 300 μM Ca, respectively). However, the maximal FRET efficiency was similar at these different [Ca]s (Emax = 0.58 ± 0.02 vs. 0.57 ± 0.01, in 100 nM and 300 μM Ca, respectively). These Emax values correspond to distances of 59 ± 2 Å in 100 nM Ca and 59 ± 1 Å in 300 μM Ca, and they are in good agreement with our previous determinations (Table 1 in our previous work (21)). We conclude that Ca did not substantially alter the proximity of the FRET probes attached at FKBP12.6 (position 49) and CaM's N-lobe (position 34). Rather, the increased FRET observed at 300 μM Ca and subsaturating F-CaM more likely reflects the increased binding affinity and increased occupancy of RyR2 CaM sites at the higher [Ca].
Figure 2.
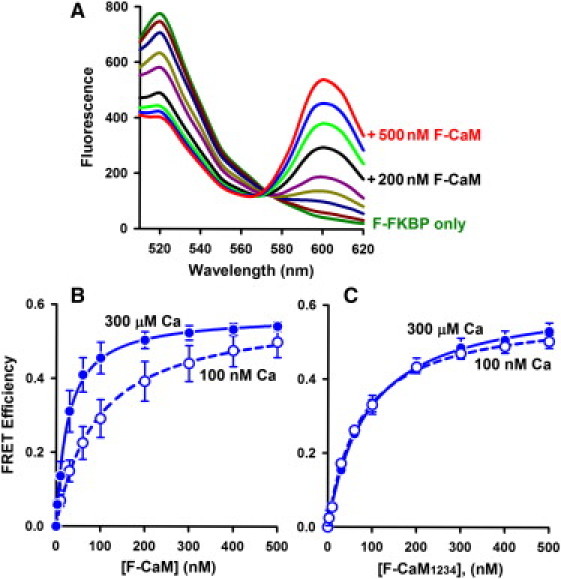
FRET detection of equilibrium binding of F-CaMs to cardiac SR vesicles. (A) Spectra with 100 nM Ca (Ex 488 nm), where unlabeled curves are +10, 30, 60, 100, 300, and 400 nM F-CaM. (B) F-CaM dependence of FRET in 100 nM and 300 μM Ca. Data represent the mean ± SE from four paired experiments. Solid lines are fits to a single rectangular hyperbola (Kd = 93 ± 1 nM and Emax = 0.58 ± 0.02 in 100 nM Ca; Kd = 26 ± 1 nM and Emax = 0.57 ± 0.01 in 300 μM Ca). (C) Binding of a Ca-insensitive CaM mutant (F-CaM1234) detected by FRET (n = 3 experiments).
The approximately fourfold increase in F-CaM binding affinity in micromolar Ca (Fig. 2 B) could be explained by Ca binding to CaM itself, or by Ca binding to and activation of RyR2. To distinguish between these possibilities, we used a Ca-insensitive CaM mutant (CaM1234), in which an E-to-A substitution has been introduced into each of CaM's four EF hands (20,23). Fig. 2 C shows that the marked effect of Ca on F-CaM binding affinity was largely lost when using the F-CaM1234 mutant (Kd = 90 ± 3 nM vs. 74 ± 3 nM, in 100 nM and 300 μM Ca, respectively). Thus, regardless of [Ca], F-CaM1234 bound with an affinity comparable to that of F-CaM in 100 nM Ca (Fig. 2 B). Maximal FRET efficiencies for F-CaM1234 were also similar at 100 nM and 300 μM Ca (Emax = 0.62 ± 0.01 vs. 0.58 ± 0.01, respectively). We conclude that the Ca-dependent increase in F-CaM affinity to RyR2 is primarily due to Ca binding to CaM, and not Ca binding to RyR2 per se.
Inhibition of FRET by suramin and rapamycin
Suramin directly binds to the core RyR CaM binding sequence and displaces CaM from both RyR1 and RyR2 channel isoforms (27–29). We used suramin to block CaM binding to RyR2 and thereby test the hypothesis that our FRET signal is strictly a function of CaM binding to the RyR2 (versus other potential CaM sites on the SR). Suramin inhibited FRET in a concentration-dependent manner (Fig. 3 A). In media containing 100 nM Ca, FRET was abolished by ≥20 μM suramin (Ki = 4.1 μM). Suramin also inhibited FRET in 300 μM Ca (Ki = 10 μM), and high suramin (30–100 μM) reduced FRET to 5% of the values without drug. Under these conditions, suramin does not significantly dissociate, or alter the fluorescence signal of, F-FKBP.
Figure 3.
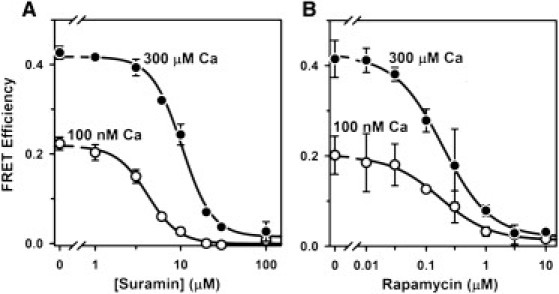
Inhibition of FRET by suramin and rapamycin. (A) Samples were incubated for 2 h in 25°C media with 100 nM F-CaM and the indicated [suramin]. Data represent the mean ± SE from three experiments. Lines are fits to the Hill equation (Ki = 4.1 ± 0.2 μM and nH = −2.4 in 100 nM Ca; Ki = 10 ± 0.7 μM and nH = −2.4 in 300 μM Ca). (B) Incubations in rapamycin were for 3 h at 37°C, to increase F-FKBP dissociation from RyR2. Data represent the mean ± SE from two experiments (Ki = 173 ± 28 nM and nH = −1.0 in 100 nM Ca; Ki = 190 ± 18 nM and nH = −1.1 in 300 μM Ca).
To verify that FRET was also dependent on F-FKBP binding to RyR2 channels, we tested the effect of rapamycin on FRET. Rapamycin prevents FKBP12.6 binding to RyR2 by complexing with free FKBP12.6 and preventing its rebinding to RyR2 channels (22). Fig. 3 B shows the [rapamycin] dependence of FRET inhibition after 3 h incubation with drug. Rapamycin inhibition of FRET was similar at 100 nM and 300 μM Ca (Ki = 173 and 190 nM, respectively), and high rapamycin (10 μM) reduced FRET to 6% of control values. Results shown in Fig. 3, A and B, therefore indicate that displacement of either CaM or FKBP12.6 from RyR2 channels eliminates ∼95% of the FRET signal observed in cardiac SR vesicles. We infer that non-RyR2 sites are unlikely to contribute to our FRET measurements.
Orientation of CaM on RyR2
To test whether CaM's location and orientation when bound to the RyR2 are similar to its location and orientation on the RyR1 isoform (20), we directly compared FRET efficiencies obtained using cardiac and skeletal muscle SR vesicles. For these experiments, the acceptor was attached at one of four different positions within CaM. Labeling sites within CaM's N-lobe were at position 26 (within EF hand 1) and position 34 (as in Figs. 1–3). The corresponding labeling sites within CaM's C-lobe were at position 99 (within EF hand 3) and position 110. All F-CaMs were tested at 500 nM, to approach saturation of RyR CaM sites and maximize FRET signals. Fig. 4 shows that energy transfer to each of the two N-lobe positions was strong (E > 0.36), regardless of whether CaM was bound to SR vesicles prepared from skeletal muscle (Fig. 4 A) or cardiac muscle (Fig. 4 B). In contrast, FRET to each of the two positions in CaM's C-lobe was substantially weaker (E < 0.18), indicating that this lobe is located farther from FKBP12.6 when bound to SR vesicles from either muscle type. This clear difference in FRET to CaM's N- versus C-lobes held true at both 100 nM and 300 μM [Ca]. Remarkably, position-by-position statistical comparisons of FRET efficiencies in cardiac versus skeletal SR at each [Ca] indicated only one minor difference out of eight comparisons (position 34 on CaM at 300 μM Ca; E = 0.53 ± 0.01 for RyR1 vs. 0.61 ± 0.03 for RyR2, p = 0.04). Results shown in Fig. 4 therefore indicate that distance relationships between the FKBP and CaM subunits are very similar for the RyR1 and RyR2 isoforms. In addition, the remarkable similarity of FRET efficiencies measured using the different membrane preparations, and at both high and low Ca, further supports the likelihood that FRET reports on CaM binding to RyRs specifically.
Figure 4.
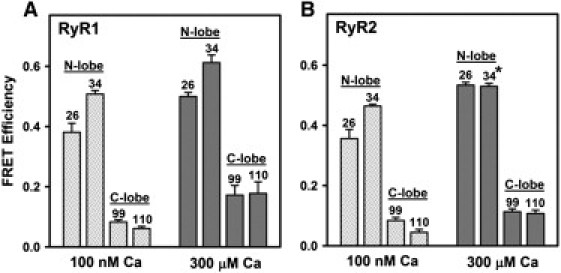
FRET indicates similar orientation of CaM when bound to RyR1 versus RyR2. SR vesicles isolated from skeletal muscle (A) or cardiac muscle (B) were preincubated with F-FKBP donor, then incubated with F-CaMs (500 nM) labeled with acceptor at one of four different positions (26, 34, 99, or 110, as indicated). Data represent the mean ± SE from three (A) or four (B) experiments. FRET efficiencies in B did not differ significantly from the corresponding values in A, except where indicated by the asterisk (p = 0.04, Student's t-test).
FRET between CaM and FKBP12.6 in cardiac myocytes
We have previously shown that both F-CaM binding (13,25) and F-FKBP binding (22) are concentrated at Z-lines in the more physiological setting of permeabilized ventricular myocytes. To investigate FRET between F-CaMs and F-FKBPs in the myocyte environment, we measured FRET efficiencies using two protocols: first, by monitoring donor quenching by the acceptor, and second, by monitoring the increase in donor fluorescence after acceptor photobleaching. Fig. 5 A (upper) shows the distinctive striated RyR2 localization pattern with 100 nM F-FKBP in the myocyte (green; Em = 500–530 nm) and very low signal in the long-wavelength acceptor channel (red; Em > 600 nm). When N-lobe labeled F-CaM (1 μM) is added (Fig. 5 A, lower), there is both quench of F-FKBP fluorescence (green) and readily detectable F-CaM fluorescence (red) with the same spatial pattern. This F-CaM concentration is sufficient to nearly saturate the myocyte CaM binding sites at 50 nM free [Ca] where the K1/2 = 31 nM (13). In a similar way, the K1/2 for FKBP12.6 in this type of experiment is ∼1 nM (22), so RyR2 is also essentially saturated with F-FKBP. The FRET efficiency calculated from the fractional decrease in F-FKBP fluorescence was 0.44 ± 0.02 (n = 3 cells).
Figure 5.
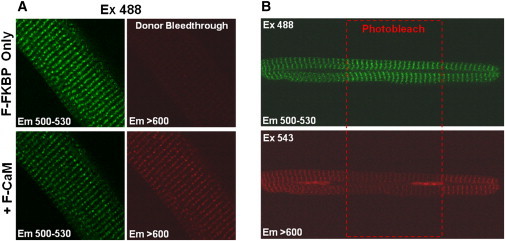
FRET between F-FKBP (donor) and F-CaM (acceptor) in permeabilized rat cardiomyocytes. (A) F-FKBP quench after addition of F-CaM. Myocytes were incubated with F-FKBP (100 nM) for 10 min to reach steady-state binding to RyRs, then incubated with F-FKBP (100 nM) and F-CaM (1 μM) for 20 min. (B) Permeabilized myocytes were incubated with F-FKBP (100 nM) and F-CaM (1 μM) for 30 min to assure steady-state FRET. Then regions of interest (ROI) were chosen and illuminated by 543 nm green HeNe laser (to photobleach the acceptor) at high laser power (80%) for 45 s. F-FKBP fluorescence increases after F-CaM photobleach. Both experiments used F-CaM labeled within the N-lobe (position 26).
After both F-FKBP and F-CaM are preequilibrated in a permeabilized myocyte (Fig. 5 B), we can bleach the F-CaM acceptor and measure the increase in donor F-FKBP fluorescence. In the case shown, we selectively bleached F-CaM (at 543 nm) only in the central region of the myocyte, and donor fluorescence is enhanced only in that region. In control experiments in which the photobleaching protocol was repeated in myocytes perfused with F-FKBP donor only, no such increase in donor fluorescence was observed (not shown). The average efficiency of FRET between F-FKBP and F-CaM assessed by acceptor photobleaching was 0.36 ± 0.03 (n = 12), in good agreement with results obtained by the donor quenching procedure. Thus, results in Fig. 5, A and B, demonstrate robust FRET between FKBP12.6 and the N-lobe of CaM in permeabilized myocytes. Moreover, this FRET efficiency (36–44%) in the cellular setting matches well with that seen in SR vesicles between the N-lobe of CaM and FKBP at 100 nM [Ca]. This suggests that the relative localization of these proteins on the RyR in the myocyte is quite similar to that seen in the more isolated SR system.
Fig. 6 shows a test of whether the myocyte FKBP-CaM FRET is sensitive to suramin (which binds to the RyR2 CaM binding domain). Before the addition of suramin, localized binding of both F-FKBP (green striations), F-CaM (red striations with direct Ex 543), and FRET (red striations with Ex 488) are evident. The addition of suramin (25 μM) nearly abolished the red striations at both excitation wavelengths, consistent with the displacement of CaM from RyR2 channels and prevention of FRET. This effect of suramin on F-CaM binding is most clear in the righthand panels in Fig. 6, which show fluorescence at >600 nm in response to direct excitation of F-CaM at 543 nm. Most of the F-CaM binding at the Z-line (53.7 ± 2.6%, n = 5) was also abolished, consistent with the idea that a major fraction of F-CaM binding at that location is RyR-bound. It is important to note that F-FKBP binding was not abolished by suramin. Rather, F-FKBP fluorescence increased after F-CaM displacement by suramin (by 42 ± 0.03% increase in Z-line fluorescence at 500–530 nm). The effect of suramin on F-FKBP fluorescence (Fig. 6) is thus comparable to the effect of acceptor photobleaching (Fig. 5 B), and indicates that FRET in the myocyte environment is strictly dependent on the F-CaM binding to RyR2 channels.
Figure 6.
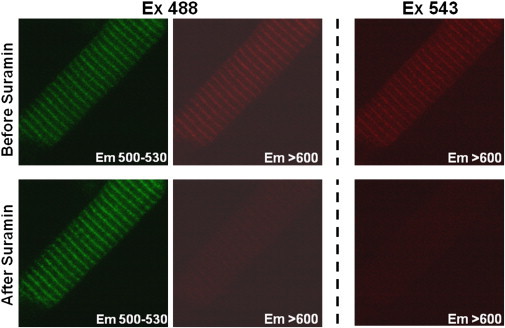
F-CaM displacement from Z-lines by suramin. Permeabilized myocytes were incubated with internal solution containing F-FKBP (100 nM) and F-CaM (1 μM) for 30 min to reach steady-state FRET. Suramin (25 μM) was added to dissociate F-CaM from RyRs into the surrounding bath volume (effectively an infinite sink), such that bath [F-CaM] is unaltered.
A hallmark of the F-CaM binding to RyR channels in SR vesicle experiments (Fig. 4) is that FRET is substantially weaker when an acceptor is attached within the C-lobe versus the N-lobe of CaM. Fig. 7 A shows an experiment examining FRET between F-FKBP and CaM's C-lobe in permeabilized myocytes. Note that photobleaching of F-CaM resulted in only a small increase in F-FKBP fluorescence (FRET = 0.029 ± 0.005; n = 12). Modest FRET to the CaM C-lobe was confirmed in FRET measurements assessing the quench of F-FKBP fluorescence upon addition of the F-CaM acceptor (FRET = 0.13 ± 0.01; n = 4). Fig. 7 B summarizes FRET efficiencies to the N- and C-lobes of CaM as determined both by acceptor photobleaching and by donor quenching. Results show that FRET to the C-lobe of CaM was ≤25% of that to the N-lobe. Both the magnitude of these FRET efficiencies in myocytes and the relative efficiencies of energy transfer to the different lobes of CaM, were remarkably similar to results obtained using cardiac and skeletal muscle SR vesicle (Fig. 4 B). Taken together, these results indicate that our FRET measurements in isolated SR vesicles reflect the more physiological setting of the permeabilized myocyte, and that the myocyte FRET is due to specific binding of F-CaMs to RyR2 channels.
Figure 7.
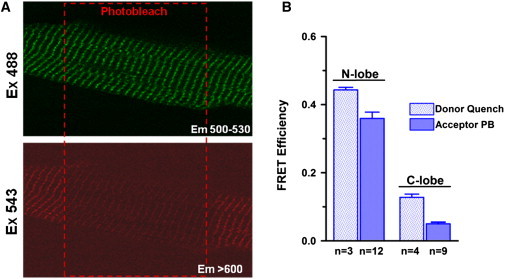
FRET in cardiomyocytes is decreased when acceptor is switched from the N- to the C-lobe of CaM. (A) Recovery of F-FKBP fluorescence after photobleach of F-CaM labeled in the C-lobe (position 110). (B) Average FRET efficiencies to N- and C-lobes of CaM measured by donor quench and acceptor photobleaching (mean ± SE, n as indicated).
Discussion
We show for the first time, to our knowledge, that the specific binding of CaM to cardiac RyR2 channels can be monitored using an F-FKBP biosensor and FRET. We show that this approach reports on RyR2 CaM binding not only in isolated SR vesicles but also in saponin-permeabilized ventricular myocytes. Because our donor-acceptor pair can only detect distances of <100 Å, our FRET approach effectively resolves CaM's interactions with RyR2 channels from its interactions with numerous other CaM binding partners that are also present in cardiac myocytes and SR vesicles.
The likelihood that our FRET signal reflects donor and acceptor binding at RyR2 channels is supported by multiple findings. We find that FRET in cardiac SR vesicles (Fig. 3 A) and in permeabilized myocytes (Fig. 6) is essentially abolished by suramin, which acts as a competitive inhibitor of RyR CaM binding, and discriminates among different CaM targets (27,28). We also find that our FRET signals are remarkably similar in magnitude across different preparations, in which the complement of non-RyR binding partners is likely to differ greatly. Thus, we show that FRET between FKBP12.6 and CaM is similar in experiments using sucrose-gradient-fractionated skeletal muscle SR vesicles (Fig. 4 A), cardiac SR vesicles (Fig. 4 B), and saponin-permeabilized ventricular myocytes (Fig. 7 B). Steady-state binding isotherms (Fig. 2) and CaM dissociation kinetics (Fig. 1 D) derived from FRET measurements are well fit using models that assume a single population of CaM binding sites. Furthermore, distances calculated from Emax determinations are consistent with the proximity of the FKBP12 and CaM subunits on the same face of the channel tetramer in RyR1 cryo-EM structural models (18), whereas FKBP12 and CaM on different faces of RyR1, or on different channels within an array, are too widely separated for FRET (20,21). Corresponding high-resolution structures showing the positions of FKBP12.6 and CaM on the RyR2 isoform are not yet available. However, 3D structures of RyR1 and RyR2 are very similar overall (7), as are our measurements of FRET efficiency using the different isoforms (Fig. 4). Thus, although we cannot entirely rule out the possibility that the binding of F-CaMs and/or F-FKBPs at other targets may contribute to a very small fraction of our FRET signal, we attribute the vast majority (>95%) of this signal to FRET between donors and acceptors bound in close proximity on the same face of RyR2 channels.
These findings also demonstrate that CaM binds RyR2 in approximately the same position and in the same orientation as shown previously for RyR1. FRET was markedly stronger when the acceptor was attached at either of two positions within CaM's N-lobe versus positions in CaM's C-lobe, indicating that for both RyR isoforms CaM binds in an extended conformation, with its lobes widely separated. We conclude that the important differences in CaM function on RyR2 versus RyR1 are not linked to gross structural differences in the location of CaM binding on the 3D structure of RyR, particularly with respect to the FKBP location. Micromolar Ca increased the apparent affinity of RyR2 CaM binding, but did not significantly affect the maximal FRET efficiency at saturating CaM (Fig. 2). Thus, we find no evidence for the large-scale Ca-dependent translocation of CaM that has been demonstrated in RyR1 cryo-EM studies (18).
An intriguing observation arising from this study is that the apparent Kd for F-CaM binding to the RyR2 in SR vesicle experiments at physiological diastolic [Ca] of 100 nM (93 nM) is threefold higher than the value of 31 nM that we have measured in permeabilized myocytes at 50 nM [Ca] using methods similar to those used here (25). It is not clear what this moderate threefold difference is attributable to, but factors could include species differences, small differences in the solutions, differential loss of partners present in the intact cellular environment, or subtle differences in structure or modulation (e.g., oxidation, nitrosylation, or phosphorylation). In preliminary experiments, we were unable to identify a clear explanation.
CaM's regulatory interactions with RyR2 channels are critical for normal cardiac function and development, and altered CaM binding may contribute to defects in SR Ca handling in arrhythmias and heart failure. CaM is thought to function as a resident regulatory subunit (5), and results in this study (Fig. 1) confirm that CaM binding and unbinding are too slow for us to expect beat-to-beat changes in the occupancy of RyR2 CaM sites. Indeed, at diastolic [Ca] of ∼100 nM and free [CaM] of 60–100 nM, the RyR2 would be at least 50–70% saturated with CaM, and that would be a lower limit compared to the steady state during normal cardiac function and Ca transients.
If physiological RyR2 saturation with CaM is incomplete, the inhibitory effect of CaM on RyR2 gating would mean that either gain or loss of CaM on the RyR could have regulatory effects on RyR2 gating. For example, in a rabbit heart-failure model, Ai et al. (30) found less CaM coimmunoprecipitation with RyR2, despite unaltered expression levels. This reduced CaM bound to RyR2 could thus contribute to enhanced SR Ca leak in heart failure that can also be arrhythmogenic, similar to the pathophysiologic effects seen when knocking in an RyR2 that is defective in CaM binding (11). Moreover, this CaM-depleted RyR2 phenotype resembles that seen with numerous human RyR2 mutations associated with catecholaminergic polymorphic ventricular tachycardia (31). Our ability to monitor CaM binding specifically to RyR2 in myocytes using this FRET approach could be utilized to monitor conditions that cause CaM (or FKBP) dissociation from the RyR2 in more physiological and pathophysiological conditions (e.g., RyR2 oxidation/nitrosylation, phosphorylation, S100A1 binding).
Acknowledgments
Spectroscopy experiments using SR vesicles were performed at the Biophysical Spectroscopy Facility, University of Minnesota (Minneapolis, MN; David D. Thomas, director). We thank Mallory Turner for valuable technical contributions.
This work was supported by National Institutes of Health grants HL92097 and HL30077 (to D.M.B.) and HL76433 (to B.R.F.).
References
- 1.Babu Y.S., Sack J.S., Cook W.J. Three-dimensional structure of calmodulin. Nature. 1985;315:37–40. doi: 10.1038/315037a0. [DOI] [PubMed] [Google Scholar]
- 2.Barbato G., Ikura M., Bax A. Backbone dynamics of calmodulin studied by 15N relaxation using inverse detected two-dimensional NMR spectroscopy: the central helix is flexible. Biochemistry. 1992;31:5269–5278. doi: 10.1021/bi00138a005. [DOI] [PubMed] [Google Scholar]
- 3.Chin D., Means A.R. Calmodulin: a prototypical calcium sensor. Trends Cell Biol. 2000;10:322–328. doi: 10.1016/s0962-8924(00)01800-6. [DOI] [PubMed] [Google Scholar]
- 4.Saimi Y., Kung C. Calmodulin as an ion channel subunit. Annu. Rev. Physiol. 2002;64:289–311. doi: 10.1146/annurev.physiol.64.100301.111649. [DOI] [PubMed] [Google Scholar]
- 5.Balshaw D.M., Yamaguchi N., Meissner G. Modulation of intracellular calcium-release channels by calmodulin. J. Membr. Biol. 2002;185:1–8. doi: 10.1007/s00232-001-0111-4. [DOI] [PubMed] [Google Scholar]
- 6.Bers D.M. Macromolecular complexes regulating cardiac ryanodine receptor function. J. Mol. Cell. Cardiol. 2004;37:417–429. doi: 10.1016/j.yjmcc.2004.05.026. [DOI] [PubMed] [Google Scholar]
- 7.Lanner J.T., Georgiou D.K., Hamilton S.L. Ryanodine receptors: structure, expression, molecular details, and function in calcium release. Cold Spring Harb. Perspect. Biol. 2010;2:a003996. doi: 10.1101/cshperspect.a003996. [DOI] [PMC free article] [PubMed] [Google Scholar]
- 8.Fruen B.R., Bardy J.M., Louis C.F. Differential Ca2+ sensitivity of skeletal and cardiac muscle ryanodine receptors in the presence of calmodulin. Am. J. Physiol. Cell Physiol. 2000;279:C724–C733. doi: 10.1152/ajpcell.2000.279.3.C724. [DOI] [PubMed] [Google Scholar]
- 9.Xu L., Meissner G. Mechanism of calmodulin inhibition of cardiac sarcoplasmic reticulum Ca2+ release channel (ryanodine receptor) Biophys. J. 2004;86:797–804. doi: 10.1016/S0006-3495(04)74155-7. [DOI] [PMC free article] [PubMed] [Google Scholar]
- 10.Guo T., Zhang T., Bers D.M. Ca2+/Calmodulin-dependent protein kinase II phosphorylation of ryanodine receptor does affect calcium sparks in mouse ventricular myocytes. Circ. Res. 2006;99:398–406. doi: 10.1161/01.RES.0000236756.06252.13. [DOI] [PubMed] [Google Scholar]
- 11.Yamaguchi N., Takahashi N., Meissner G. Early cardiac hypertrophy in mice with impaired calmodulin regulation of cardiac muscle Ca release channel. J. Clin. Invest. 2007;117:1344–1353. doi: 10.1172/JCI29515. [DOI] [PMC free article] [PubMed] [Google Scholar]
- 12.Anderson M.E. Calmodulin and the philosopher's stone: Changing Ca2+ into arrhythmias. J. Cardiovasc. Electrophysiol. 2002;13:195–197. doi: 10.1046/j.1540-8167.2002.00195.x. [DOI] [PubMed] [Google Scholar]
- 13.Song Q., Saucerman J.J., Bers D.M. Differential integration of Ca2+-calmodulin signal in intact ventricular myocytes at low and high affinity Ca2+-calmodulin targets. J. Biol. Chem. 2008;283:31531–31540. doi: 10.1074/jbc.M804902200. [DOI] [PMC free article] [PubMed] [Google Scholar]
- 14.Saucerman J.J., Bers D.M. Calmodulin mediates differential sensitivity of CaMKII and calcineurin to local Ca2+ in cardiac myocytes. Biophys. J. 2008;95:4597–4612. doi: 10.1529/biophysj.108.128728. [DOI] [PMC free article] [PubMed] [Google Scholar]
- 15.Yamaguchi N., Xu L., Meissner G. Molecular basis of calmodulin binding to cardiac muscle Ca2+ release channel (ryanodine receptor) J. Biol. Chem. 2003;278:23480–23486. doi: 10.1074/jbc.M301125200. [DOI] [PubMed] [Google Scholar]
- 16.Meissner G., Pasek D.A., Tripathy A. Thermodynamics of calmodulin binding to cardiac and skeletal muscle ryanodine receptor ion channels. Proteins. 2009;74:207–211. doi: 10.1002/prot.22148. [DOI] [PMC free article] [PubMed] [Google Scholar]
- 17.Wagenknecht T., Radermacher M., Fleischer S. Locations of calmodulin and FK506-binding protein on the three-dimensional architecture of the skeletal muscle ryanodine receptor. J. Biol. Chem. 1997;272:32463–32471. doi: 10.1074/jbc.272.51.32463. [DOI] [PubMed] [Google Scholar]
- 18.Samsó M., Wagenknecht T. Apocalmodulin and Ca2+-calmodulin bind to neighboring locations on the ryanodine receptor. J. Biol. Chem. 2002;277:1349–1353. doi: 10.1074/jbc.M109196200. [DOI] [PubMed] [Google Scholar]
- 19.Samsó M., Feng W., Allen P.D. Coordinated movement of cytoplasmic and transmembrane domains of RyR1 upon gating. PLoS Biol. 2009;7:e85. doi: 10.1371/journal.pbio.1000085. [DOI] [PMC free article] [PubMed] [Google Scholar]
- 20.Cornea R.L., Nitu F., Fruen B.R. FRET-based mapping of calmodulin bound to the RyR1 Ca2+ release channel. Proc. Natl. Acad. Sci. USA. 2009;106:6128–6133. doi: 10.1073/pnas.0813010106. [DOI] [PMC free article] [PubMed] [Google Scholar]
- 21.Cornea R.L., Nitu F.R., Fruen B.R. Mapping the ryanodine receptor FK506-binding protein subunit using fluorescence resonance energy transfer. J. Biol. Chem. 2010;285:19219–19226. doi: 10.1074/jbc.M109.066944. [DOI] [PMC free article] [PubMed] [Google Scholar]
- 22.Guo T., Cornea R.L., Bers D.M. Kinetics of FKBP12.6 binding to ryanodine receptors in permeabilized cardiac myocytes and effects on Ca sparks. Circ. Res. 2010;106:1743–1752. doi: 10.1161/CIRCRESAHA.110.219816. [DOI] [PMC free article] [PubMed] [Google Scholar]
- 23.Fruen B.R., Black D.J., Balog E.M. Regulation of the RYR1 and RYR2 Ca2+ release channel isoforms by Ca2+-insensitive mutants of calmodulin. Biochemistry. 2003;42:2740–2747. doi: 10.1021/bi0267689. [DOI] [PubMed] [Google Scholar]
- 24.Haugland R.P., Spence M.T.Z., Basey A. Molecular Probes; Eugene, OR: 2005. The Handbook: A Guide to Fluorescence Probes and Labeling Technologies. [Google Scholar]
- 25.Wu X., Bers D.M. Free and bound intracellular calmodulin measurements in cardiac myocytes. Cell Calcium. 2007;41:353–364. doi: 10.1016/j.ceca.2006.07.011. [DOI] [PMC free article] [PubMed] [Google Scholar]
- 26.Balshaw D.M., Xu L., Meissner G. Calmodulin binding and inhibition of cardiac muscle calcium release channel (ryanodine receptor) J. Biol. Chem. 2001;276:20144–20153. doi: 10.1074/jbc.M010771200. [DOI] [PubMed] [Google Scholar]
- 27.Papineni R.V.L., O'Connell K.M.S., Hamilton S.L. Suramin interacts with the calmodulin binding site on the ryanodine receptor, RYR1. J. Biol. Chem. 2002;277:49167–49174. doi: 10.1074/jbc.M209564200. [DOI] [PubMed] [Google Scholar]
- 28.Klinger M., Bofill-Cardona E., Hohenegger M. Suramin and the suramin analogue NF307 discriminate among calmodulin-binding sites. Biochem. J. 2001;355:827–833. doi: 10.1042/bj3550827. [DOI] [PMC free article] [PubMed] [Google Scholar]
- 29.Hill A.P., Kingston O., Sitsapesan R. Functional regulation of the cardiac ryanodine receptor by suramin and calmodulin involves multiple binding sites. Mol. Pharmacol. 2004;65:1258–1268. doi: 10.1124/mol.65.5.1258. [DOI] [PubMed] [Google Scholar]
- 30.Ai X., Curran J.W., Pogwizd S.M. Ca2+/calmodulin-dependent protein kinase modulates cardiac ryanodine receptor phosphorylation and sarcoplasmic reticulum Ca2+ leak in heart failure. Circ. Res. 2005;97:1314–1322. doi: 10.1161/01.RES.0000194329.41863.89. [DOI] [PubMed] [Google Scholar]
- 31.Priori S.G., Chen S.R. Inherited dysfunction of sarcoplasmic reticulum Ca2+ handling and arrhythmogenesis. Circ. Res. 2011;108:871–883. doi: 10.1161/CIRCRESAHA.110.226845. [DOI] [PMC free article] [PubMed] [Google Scholar]