

Abstract
Intracellular diffusion restrictions for ADP and other molecules have been predicted earlier based on experiments on permeabilized fibers or cardiomyocytes. However, it is possible that the effective diffusion distance is larger than the cell dimensions due to clumping of cells and incomplete separation of cells in fiber preparations. The aim of this work was to check whether diffusion restrictions exist inside rat cardiomyocytes or are caused by large effective diffusion distance. For that, we determined the response of oxidative phosphorylation (OxPhos) to exogenous ADP and ATP stimulation in permeabilized rat cardiomyocytes using fluorescence microscopy. The state of OxPhos was monitored via NADH and flavoprotein autofluorescence. By varying the ADP or ATP concentration in flow chamber, we determined that OxPhos has a low affinity in cardiomyocytes. The experiments were repeated in a fluorometer on cardiomyocyte suspensions leading to similar autofluorescence changes induced by ADP as recorded under the microscope. ATP stimulated OxPhos more in a fluorometer than under the microscope, which was attributed to accumulation of ADP in fluorometer chamber. By calculating the flow profile around the cell in the microscope chamber and comparing model solutions to measured data, we demonstrate that intracellular structures impose significant diffusion obstacles in rat cardiomyocytes.
Introduction
When mitochondrial oxygen consumption is stimulated by exogenous ADP, mitochondria in situ in permeabilized fibers and cells from cardiac muscle have an affinity that is much lower than that of isolated mitochondria (1–3). The cause of this is still uncertain. Usually, the low affinity is attributed to intracellular diffusion restrictions that limit diffusion between the solution surrounding the cell and the mitochondrial inner membrane. As possible diffusion obstacles, limitation of permeability of voltage-dependent anion channel in mitochondrial outer membrane by tubulin (4) and intracellular structures such as sarcoplasmic reticulum and proteins associated with them (3,5–7) have been proposed. From two- and three-dimensional analysis of mitochondrial arrangement, it is clear that rat cardiomyocytes have a very high degree of order (8,9). In such ordered environment, intracellular diffusion obstacles associated with sarcoplasmic reticulum can be responsible for anisotropy in diffusion that was shown by extended raster image correlation spectroscopy (6).
As an alternative explanation, Kongas et al. (10) proposed that low affinity to ADP in permeabilized fibers and cells can be attributed to long diffusion pathways in the experiments: unstirred layers surrounding the cells and fibers may provide a significant restriction of ADP-diffusion relative to metabolism; fibers and cells in the oxygraph may form clumps, where outer cells restrict diffusion to the inner cells. Although analysis of the data in light of intracellular diffusion restrictions has been commonly used, the alternative explanation of the data by long diffusion distances in the experimental setup has not been tested. Our recent data from rainbow trout approached the long diffusion distance hypothesis (unstirred layers and clumping of cells). The data argued against diffusion restriction by unstirred layers (11). However, they did suggest that trout cardiac fibers were not completely separated and/or were clumping during oxygraph experiments, because the affinity (quantified by apparent KM for exogenous ADP) of fibers was much lower (apparent KM higher) than that of isolated cardiomyocytes (11). Note that apparent KM for ADP was still larger in trout cardiomyocytes than in isolated mitochondria, indicating the existence of intracellular diffusion restrictions in trout cells.
The difference in the affinity of permeabilized trout cells and fibers is opposite to what has been reported for rat heart preparations, where the apparent KM of permeabilized fibers is similar to that of cardiomyocytes (12). We have never observed cell aggregation in the oxygraph during experiments on rat cardiomyocytes, or under the microscope after experiments. However, it cannot be ruled out that temporary microscopic cell aggregates are formed, so that the diffusion distance from the medium to the mitochondria inside the cells is effectively much larger than the radius of a single cardiomyocyte (10). As a result, formation of aggregates in isolated cardiomyocyte preparation in solution cannot be ruled out based on observation of similar affinities to ADP of permeabilized rat cardiomyocytes and fibers.
This study was designed to check whether permeabilized rat cardiomyocytes exhibit low affinity to exogenous ADP at single cell level. We took advantage of the fact that changes in the autofluorescence of reduced nicotinamide adenine dinucleotide (NADH) and oxidized flavoproteins (FPs) reflect the redox state of the cell (13,14). NADH and FP autofluorescence has been used extensively to characterize the state of respiratory chain: for example, response of isolated mitochondria (13,15) or permeabilized fibers (16,17) to ADP stimulation; response of isolated cardiomyocytes to drugs (18,19); or monitoring mitochondrial function in vivo (20).
NADH autofluorescence is mainly of mitochondrial origin (21,22). FP autofluorescence comes from three groups of flavoproteins: α-lipoamide dehydrogenase, electron transfer flavoprotein, and a third group, which is likely to be acyl-CoA dehydrogenases (23–25). α-Lipoamide dehydrogenase is the catalytic subunit of pyruvate dehydrogenase, α-ketoglutarate dehydrogenase in the citric acid cycle, and the branched chain α-keto acid dehydrogenase complex involved in amino-acid metabolism. As NADH is a cofactor for these dehydrogenases, the redox state of the flavin moiety of α-lipoamide dehydrogenase is in equilibrium with that of mitochondrial NAD+/NADH.
In this study, we recorded the autofluorescence of NADH and FP from single, permeabilized rat cardiomyocytes perfused with solution containing increasing concentrations of ADP and ATP. For comparison, the same experiment was performed on populations of permeabilized cardiomyocytes in a spectrofluorometer to mimic respiration kinetics experiments that have shown low affinity of mitochondrial respiration to exogenous ADP. From the analysis of the measured data by mathematical models, we demonstrate that the low affinity of mitochondrial respiration to exogenous ADP comes, in part, from intracellular diffusion obstacles in rat heart muscle cells.
Materials and Methods
Adult outbred Wistar rats of both sexes weighing 300–500 g were used in the experiments. Animal procedures were approved by the Estonian National Committee for Ethics in Animal Experimentation (Estonian Ministry of Agriculture).
Before the experiments, animals were anesthetized with 0.5 mg/kg ketamine (Bioketan, Vetoquinol Biowet, Gorzów Wielkopolski, Poland) and 125 mg/kg dexmedetomidine (Dexdomitor; Orion, Espoo, Finland).
Isolation of cardiomyocytes
Calcium-tolerant cardiomyocytes were isolated as described in Sepp et al. (3). During isolation of cardiomyocytes, we used solutions from Sepp et al. (3) with slight modifications. Solutions are listed in the Supporting Material.
Fluorescence microscopy
Microscope experiments were performed on an inverted Nikon Eclipse Ti-U microscope (Nikon, Tokyo, Japan), described in the Supporting Material. Immediately before each experiment, a new batch of cells were permeabilized for 5 min with gentle mixing in an Eppendorf tube with Mitomed solution (see the Supporting Material) containing 25 μg/mL saponin and 50 μM ADP. A fraction of the permeabilized cells was put into a diamond-shaped fast-exchange chamber (15 × 6 mm, RC-24N; Warner Instruments, Harvard Apparatus, March-Hugstetten, Germany) on the microscope. They were allowed to sediment for 5–10 min before starting the superfusion with Mitomed solution containing different concentrations of ADP. Only those cells located in the middle of the chamber were used for measurements. According to the manufacturer, the geometry of the chamber provided laminar flow of solutions during experiments at the used flow rate of ∼0.5 mL/min. The ADP concentration was increased stepwise from 50 to 100, 300, 500, 1000, and 2000 μM and the cells were superfused for at least 4.5 min at each step. The same experiment was done with ATP instead of ADP.
Spectrofluorometer recordings
Autofluorescence measurements on population level were performed in 4 mL plastic cuvettes (four-faced transparent cuvettes; Deltalab, Rubí, Spain) on a spectrofluorophotometer (Shimadzu RF-5301; Shimadzu Scientific Instruments, Kyoto, Japan). Autofluorescence spectra of flavoproteins and NADH were recorded using excitation and emission wavelengths similar to those used for microscope single cell studies: for NADH excitation was 340 nm, emission range 400–550 nm; for flavoproteins, excitation was 465 nm, emission range 500–600 nm. All spectra were taken three times to make sure that steady state was reached. The cell suspension was continuously stirred with magnetic stirrer bars (VWR, Wien, Austria) and before each measurement resuspended with a pipette to provide an homogeneous mixture. Autofluorescence of permeabilized cardiomyocytes was first recorded in substrate-free Mitomed solution in presence of 50 μM ADP or ATP, then substrates were added and cells were exposed to increasing concentrations of ADP or ATP, respectively. At the end of each titration, oligomycin and sodium cyanide were added to obtain the signal under fully reduced conditions. Spectra of cell suspension autofluorescence in substrate-free solution and in presence of oligomycin and cyanide were then used to normalize data of titration, as described below.
Analysis of fluorescence signal
Detailed description of analysis of fluorescence signal is given in the Supporting Material.
Statistics
The raw data were analyzed using homemade software. All results are shown as mean ± SD.
Mathematical models
The experimental data were analyzed by several mathematical models. Description of the models is given in the Supporting Material.
Results
Experimental results
The response of the permeabilized rat cardiomyocytes to changes in the surrounding solution was followed in fluorescence microscope. Two fluorescence signals were recorded from the same cell with the recorded signals corresponding to NADH and flavoproteins (FPs) fluorescence. In the beginning of the experiment, the cells were permeabilized by saponin. After that, the solution in the imaging chamber was varied and the fluorescence of cells was observed. Representative fluorescence images of the cells are shown on Fig. 1. Note how increase of exogenous ADP leads to reduction in NADH fluorescence and increase of FP fluorescence.
Figure 1.
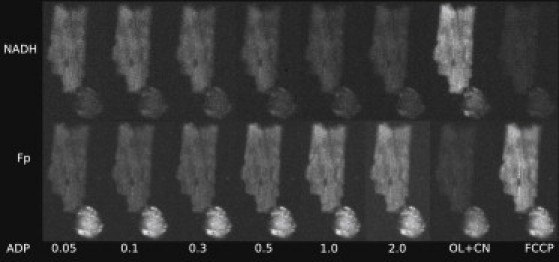
Example of the response of permeabilized cardiomyocytes to changes in solution. For demonstration, rod-shaped and nonrod-shaped cells are shown. Autofluorescence of the cells was recorded by fluorescence microscope with the fluorescence induced by 340 nm (top row) or 465 nm (bottom row) excitation. Note how gradual increase of ADP (concentration in mM shown below images) leads to changes in fluorescence with the maximal and minimal levels of fluorescence induced by oligomycin/cyanide (OL+CN) and FCCP. As it is clearly visible on the figure, fluorescence of nonrod-shaped cells (bottom right corner on all images) is relatively small in recordings of NADH fluorescence. However, the opposite was frequently true for recordings of fluorescence corresponding to flavoprotein (FP) signal.
To get the extremes in the levels of fluorescence, we subjected the cells to solutions that inhibit oxidative phosphorylation (solution containing oligomycin and cyanide, OL+CN) or an uncoupled mitochondrial respiratory chain by using the solution containing FCCP (Fig. 1). As it is demonstrated in Fig. 1, NADH fluorescence of nonrod-shaped cardiomyocytes was quite small (right bottom corner of images). The same was not true for FP fluorescence, with relatively high FP fluorescence observed in nonrod-shaped cardiomyocytes. Such level of autofluorescence in nonrod-shaped cells is consistent with earlier reports (21). For these cells, FP fluorescence either stayed relatively constant through the whole experiment or changed with the variation of ADP or ATP in solution similar to rod-shaped cardiomyocytes (results not shown).
We quantified the response of the cells to different solutions by calculating the average fluorescence of a cell and using the fluorescence levels recorded in presence of OL+CN and FCCP to normalize the data (see the Supporting Material). Representative traces with average fluorescence changes in a single cell during an experiment are shown in Fig. 2. As shown in Fig. 2, stimulation of respiration by exogenous ADP leads to a larger range of fluorescence changes in the cell than stimulation by exogenous ATP. When adding exogenous ATP, respiration is stimulated due to the hydrolysis of ATP by endogenous ATPases. Note that there is always a significant delay between the time-moment at which the new solution started to enter the microscope imaging chamber (dashed vertical lines in Fig. 2) and the response of the cell. However, after a few images, the fluorescence of the cell is stable until the next change of solution.
Figure 2.
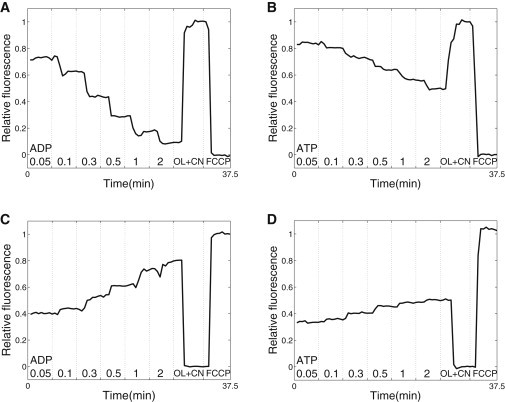
Average fluorescence of a single permeabilized cell exposed to the changes in solution denoted at the bottom. Fluorescence was recorded with excitation light of 340 nm (top row) or 465 nm (bottom row). The fluorescence was normalized by using the signal recorded in solutions OL+CN and FCCP as extreme values corresponding to relative fluorescence equal to 0 and 1 (see figure). The moment at which the change of solution was started by the experimenter is indicated (dashed vertical line). Note how stimulation of respiration by exogenous ADP (A and C) is able to change the fluorescence in a larger range than stimulation by exogenous ATP (B and D).
To compare the single cell response to the response of a cell population, the experiments were repeated in a fluorometer. Rat cardiomyocyte suspension was added to the fluorometer cuvette and after permeabilization, increasing amounts of ADP or ATP was added. Fluorescence spectra were recorded to determine the level of NADH and FP fluorescence. As explained in the Supporting Material, we had to avoid use of FCCP in the experiments in the fluorometer due to significant absorbance. For normalization of the fluorescence signal, the fluorescence of permeabilized cells was recorded before addition of substrates (but in the presence of low ADP or ATP). Sample spectra are shown in Fig. S1 in the Supporting Material.
A comparison of fluorescence levels recorded in a microscope (n = 8–13) and a fluorometer (n = 6) are shown in Fig. 3. As it is evident from Fig. 3, A and C, NADH and FP fluorescence changes similarly on single cell and population level when exogenous ADP is varied. When respiration is stimulated by ATP, the autofluorescence response is larger in the fluorometer than in the microscope (Fig. 3, B and D). This difference is induced by the differences in response at lower ATP concentrations. At higher ATP concentrations, NADH and FP fluorescence measured in a fluorometer does not change significantly (compare fluorescence at ATP concentrations of 1 mM and 2 mM, Fig. 3, B and D). This saturation effect has not been observed in the single cell measurements. The difference in recorded fluorescence response to changes in ADP and ATP are demonstrated in Fig. 3, E and F. Note how the curve corresponding to NADH fluorescence response to exogenous ATP stimulation is shifted to the right from the curve corresponding to exogenous ADP stimulation. For FP, the corresponding shift is to the left.
Figure 3.
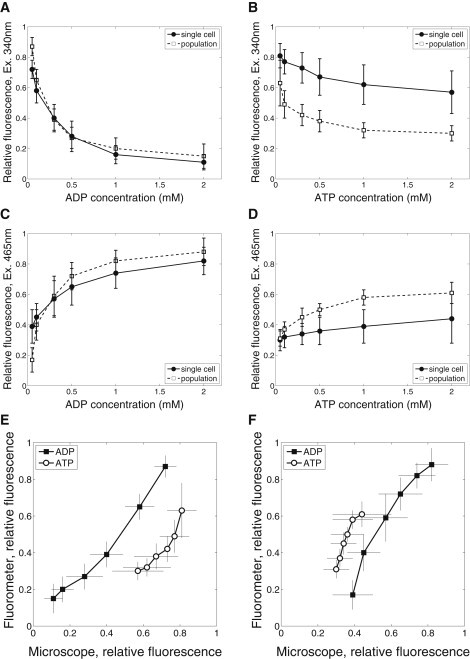
Comparison of fluorescence recordings performed on single cell level using fluorescence microscope with recordings on cell population level using fluorometer. The average fluorescence at different levels of exogenous ADP (A and C) and ATP (B and D) is shown for single cell and cell population recordings. Finally, average fluorescence recorded on single cell and population level is plotted against each other with fluorescence excited by 340 nm and 465 nm in E and F, respectively.
Because fluorometer measurements were performed on populations of cardiomyocytes, we could relate changes in NADH and FP fluorescence to changes in respiration rate (VO2). For that, VO2 measured on populations of rat cardiomyocytes under similar conditions were used (data taken from Sepp et al. (3)). The relationship between fluorescence and VO2 is shown in Fig. 4. Because VO2 was not measured at all ADP and ATP concentrations used in this study, we had to omit several fluorescence measurements in Fig. 4. Note that the relationship between fluorescence and VO2 is close to linear. This indicates that fluorescence changes follow similar kinetics as VO2. In addition, we observed that the fluorescence changes induced by exogenous ATP were larger than expected from VO2 measurements. As a result, the relationship between NADH (or FP) fluorescence and VO2 is not unique, but depends on the way the respiration is stimulated (Fig. 4, A and B).
Figure 4.

Relationship between fluorescence recorded in fluorometer (excitation 340 nm and 465 nm on A and B, respectively) and respiration rate. Note that the relationship is different for ADP and ATP stimulation.
Differences in fluorometer and microscope measurements analyzed by compartmentalized model of a cardiomyocyte
We have shown that the fluorescence response to variation in exogenous ATP concentration was different in fluorometer and microscope (Fig. 3, B and D). To understand the cause of this difference, respiration stimulation by exogenous ATP can be analyzed by mathematical model of permeabilized rat cardiomyocytes (3). Because, in our experiments, 3 mM inorganic phosphate was present in solution, effects induced by phosphate supply to the cell should be negligible. Thus, we can focus in our analysis on ATP and ADP. When respiration is stimulated by exogenous ATP, endogenous ATPases hydrolyze it to the ADP that would stimulate respiration in mitochondria. In addition, ADP produced by endogenous ATPases can also leave the cell in solution if the concentration of ADP in solution is smaller than in the cell. In the fluorometer cuvette, solution is not exchanged and reaches the steady state relatively fast, as measured by HPLC in similar configuration (3).
In the microscope chamber, the solution is exchanged and ADP produced by upstream cells can be washed out. To track the ADP concentration in the microscope chamber, we have to distinguish between ADP present in prepared ATP solution and ADP produced by ATPases in the microscope chamber. In our conditions, ADP concentration was 1.5% of ATP concentration in prepared solution, as determined earlier by HPLC in solution without cells (3). To estimate ADP produced by all cells in the microscope chamber, we assumed that the ATPase rate can be described by the Michaelis-Menten equation with apparent Km(ATP) of 0.38 mM (3). Maximal ATPase activity of a cell (4.2 fmol/s) can be estimated from activity of ATP synthase (0.54 mM/s, see description of reaction-diffusion-convection model in the Supporting Material); stimulation of respiration by exogenous ATP relative to stimulation by ADP (25% (3)); and the volume of a cell (cylinder with 20-μm diameter and 100-μm length).
Taking into account the cell counts after isolation and series of dilutions made, we had ∼1000 cells in a microscope chamber during experiments leading to 4 pmol/s maximal ATPase activity. When checked at all used concentrations of ATP by calculating ATPase rate using the Michaelis-Menten equation, the ADP concentration would increase by 8.1% (at 50 μM ATP in solution) and 5.1% (300 μM ATP) when compared with ADP contained in solution at a flow rate of 0.5 ml/min. Because a significant fraction of the cells is washed out at the beginning of the experiment, the effect of intracellular ATPases on the ADP concentration in the chamber is even smaller. Thus, in the microscope chamber, ADP produced by cells in the chamber has a minor effect and ADP in solution is mainly determined by ADP present in solution before entering the chamber.
To test further whether such differences in the solution surrounding the cells could cause the different fluorescence responses seen in Fig. 3 B, we calculated VO2. For comparison, a case with zero ADP in solution surrounding the cells is shown in Fig. 5. Note that in the case of zero ADP, there is still ATPase activity in the cell and some of the produced ADP stimulates respiration. As it is clear from the simulation results, ADP buildup during the measurements in the closed chamber configuration contributes significantly to VO2. From these simulation results, we conclude that the differences in NADH and FP fluorescence response to stimulation by endogenously generated ADP in fluorometer and microscope are caused by differences in the design of the corresponding measurement chambers.
Figure 5.
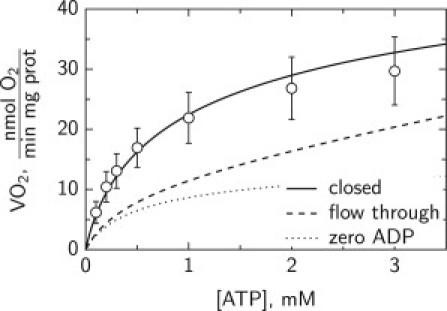
Calculated respiration rate VO2 stimulated by exogenous ATP in permeabilized cardiomyocytes in the surroundings that mimic the situation in fluorometer (solid line) or microscope imaging chamber (dashed line). In fluorometer, measurements are performed in closed chamber whereas in microscope the solution is changed as it flows through the imaging chamber. As a result, ADP in solution can either accumulate (closed chamber) or will stay relatively low (flow through chamber). In simulations, flow through chamber had ADP concentration proportional to added ATP, in agreement with small ATP contamination by ADP. For comparison, VO2 calculated with zero ADP concentration in solution surrounding the cell is shown (dotted line).
Influence of unstirred water layers on the measurements
The low affinity of respiration, as evidenced by NADH and FP to changes in extracellular ADP, suggest significant intracellular diffusion restrictions. However, such low affinity can be also induced by large unstirred water layers surrounding the cells in the fluorometer or microscope chambers. Although analysis of unstirred water layers in the fluorometer chamber is not trivial due to the stirring and mixing of the cells in the experiments, the situation in the microscope chamber can be analyzed in detail. In our conditions, the flow in the chamber is laminar. By approximating the microscope chamber by simplified geometry, we calculated the flow profile of the solution in the chamber (Fig. 6 A). The flow velocity was fastest near the inflow and outflow. In the center of the chamber, where the measurements were performed, the flow velocity reached ∼3100 μm/s at the surface of the solution. Near the cell, next to the cover glass, the flow is considerably slower. However, even 20 μm from the glass, the flow was >100 μm/s in the central region of the chamber. Assuming that there is no flow of solution through the cell, the corrected flow profile in the cell surroundings was calculated. In those simulations, the flow profile in the middle of microscope chamber was taken into account. The flow in the cell surroundings is shown in Fig. 6 B by streamlines and arrows.
Figure 6.
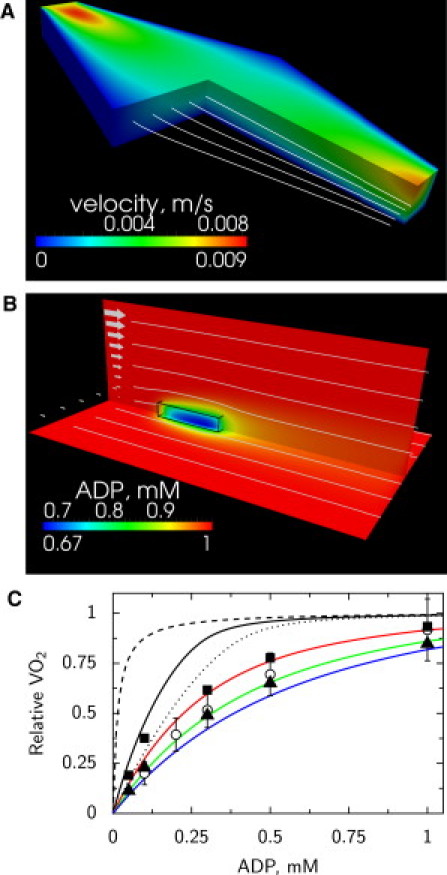
Analysis of single cell respiration in the microscope fast exchange chamber. (A) Flow profile in the microscope chamber found by the mathematical model. The flow profile is described by velocity magnitude (shown by color) and streamlines (white lines). At inflow (top left), the velocity is higher than at outflow (bottom right) due to the larger opening of the chamber at outflow. (B) Distribution of ADP (shown by color) predicted by the mathematical model around a cell situated in the middle of a chamber, attached to the glass. The location of the cell is outlined (black wire-frame) on the image. The flow in the box was calculated on basis of the flow distribution in the chamber taking into account the flow around the cell. The flow is indicated by the arrows (left) and streamlines (white lines). Note how flow of solution leads to asymmetric distribution of ADP next to the cell. (C) Influence of ADP mixing mechanisms on respiration rate of a cell in microscope chamber. Assuming that there are no intracellular diffusion restrictions, the calculated affinity of respiration to ADP is very high in the case of infinitely fast diffusion (dashed black line). If ADP is supplied just by diffusion, the affinity drops significantly (dotted black line). Taking into account flow distribution in the chamber, the predicted affinity of respiration to ADP (solid black line) is significantly higher that the one determined from experiments. For comparison, respiration rate dependency determined on the cell suspension in respiration chamber is shown (open dots) as well as respiration rate estimated from NADH (solid squares) and FP (solid triangles). Only by assuming significant intracellular diffusion restrictions modeled by increasing an apparent Km(ADP) of mitochondrial respiration to 0.15 mM (red line), 0.3 mM (green line), or 0.45 mM (blue line), is it possible to reproduce the measurements if the flow in the chamber is taken into account.
The calculated flow profile in the cell surroundings was used to analyze the influence of unstirred water layers on the measurements. For that, a reaction-diffusion-convection model was composed and we calculated the distribution of ADP in solution and inside the cell taking into account mitochondrial respiration, diffusion, and convection of ADP. When 1 mM ADP is used in the solution entering the chamber, the model predicts significant diffusion gradients between the solution and parts of the cell next to the cover glass with the lowest ADP concentration equal to 0.67 mM (Fig. 6 B). In those simulations, it was assumed that apparent Km(ADP) of respiration was 0.015 mM, i.e., the same as for isolated mitochondria. To analyze how the supply of ADP influences VO2 of the isolated cardiomyocyte, we calculated VO2 of the cell in different conditions. Assuming that apparent Km(ADP) of mitochondria is 0.015 mM, we could see a large difference on calculated VO2 when ADP was supplied by infinitely fast diffusion, diffusion as in water, and with the diffusion assisted by flow of solution (Fig. 6 C).
Note that when we take into account the flow surrounding the cell, the apparent affinity of VO2 to ADP is considerably higher than the measured one (solid line in Fig. 6 C). Here, the VO2 measured in an oxygraphy chamber for cell suspension (data from Sepp et al. (3)) is shown for comparison. Assuming that NADH and FP fluorescence is linearly related to VO2 we estimated the relative VO2 of a single cell from fluorescence measurements (Fig. 3, A and C). For that, fluorescence at zero ADP was taken into account in estimation of VO2 by subtracting it. The fluorescence at zero ADP was found by fitting fluorescence measurements with a Michaelis-Menten-type relationship with the shift corresponding to fluorescence level at zero ADP. As it is clear from Fig. 6 C, to reproduce the experimental data, the affinity of mitochondrial respiration to ADP has to be reduced significantly by increasing apparent Km(ADP) of respiration to 0.15–0.45 mM. This demonstrates that low affinity of respiration is induced, in part, by intracellular diffusion restrictions.
Discussion
According to our results, the fluorescence response to exogenous ADP and ATP stimulation was similar on single cell and population levels if we take into account the differences in experimental setups. On both studied levels, NADH and FP fluorescence varied when ADP was changed up to the millimolar range indicating a low affinity of mitochondrial oxidative phosphorylation to exogenous ADP. From the mathematical analysis of the measurements in microscope chamber, we demonstrated that low affinity of the respiration to exogenous ADP is in part induced by intracellular diffusion restrictions. To our knowledge, this is the first time the existence of intracellular diffusion restrictions for ADP has been demonstrated from experiments on single cells.
To study the autofluorescence of cardiomyocytes, we used a wide-field fluorescence microscope equipped with a sensitive camera. By using such setup and following a single isolated cardiomyocyte, we avoided complications that can occur in tissue preparations and in confocal imaging. In the studies on tissue or organ level, one has to compensate for organ motion, inhomogeneity of the cells, and absorption and scattering of excitation light and fluorescence by tissue. When confocal microscopy is used, small movement of the cell could lead to changes in focal plane that have to be taken into account. Due to the nature of the fluorescence microscope point-spread function, the signal is integrated through the whole thickness of the cell (point-spread function of our microscope has been published earlier in Laasmaa et al. (26)). As a result, small movements of the cell induced by changes in solution flow do not alter the measurements if the signal is averaged over the whole cell. In addition, use of a highly sensitive camera allowed us to reduce bleaching by attenuating the excitation light.
According to our results, changes in NADH and FP autofluorescence were linearly related to respiration rate (Fig. 4). Similar linear relationships were observed when respiration rates were varied by changes in substrates at different calcium levels (27). In our work, calcium, substrate, and inorganic phosphate levels were kept the same. As a result, regulation of respiration was rather simple and carried out by ADP in the vicinity of mitochondria. Such simple control probably resulted in the simple relationship between respiration rate, and NADH and FP autofluorescence.
The main result of this work is the demonstration of low ADP-affinity of mitochondrial respiration in single permeabilized cardiomyocytes. From the similar response of autofluorescence to stimulation of respiration by ADP and ATP on single cell and population level, we conclude that the analysis of intracellular diffusion on population of permeabilized cardiomyocytes is adequate and does not suffer from clumping of the cells in measurement solution. The differences in response of autofluorescence to stimulation by ATP (Fig. 3, B and D) were attributed to accumulation of ADP during measurements in the fluorometer chamber. As we have demonstrated earlier in similar setup by HPLC measurements (3), the ADP concentration increases from ∼0.03 mM to ∼0.06 mM during stimulation of respiration with 2 mM ATP. When oxidative phosphorylation is active, the ADP level stabilizes at 0.06 mM level. Note that the initial ADP was present as a small fraction in the injected ATP. This buildup of ADP in the surrounding solution leads to larger respiration rate, as demonstrated in Fig. 5 and can explain the larger autofluorescence response in fluorometer to stimulation of ATP compared to the measurements in microscope (Fig. 3, B and D).
Because single cell and cell populations results are similar, one can take advantage of both preparations in the studies. When larger population is used, it is possible to use macroscopical methods, such as following respiration rate by measuring oxygen concentration changes in solution, HPLC to determine dynamics of metabolite changes, and absorbance spectroscopy. Those methods have been applied in numerous studies (1,11,28), with our recent study applying a large set of them to analyze ADP compartmentation in permeabilized cardiomyocytes (3). Although macroscopical approaches are not possible on a single-cell level, there are clear advantages of using a single-cell preparation.
The main advantage is the ability to select a particular cell. As it is shown in Fig. 1, the response of a viable rod-shaped cardiomyocyte could be different from that of a contracted nonrod-shaped cell. In the microscope, we could choose the cells on the basis of their shape and response to external stimuli. This is not possible on a population level, because in population-level studies there is always a fraction of the cells that have been damaged during isolation. In addition, the single cell preparation allows us to study intracellular heterogeneity of the metabolism, such as metabolic oscillations (29–31). For regional analysis, confocal microscopy can be used (17) or image deconvolution algorithms to enhance fluorescence images. For deconvolution, several options exist with several open source deconvolution packages made available recently including end-user software packages or programming libraries (see Laasmaa et al. (32) and references within).
Although there are clear advantages in the use of single cell preparations, there is an important complication. Namely, to study the response of permeabilized cardiomyocytes to external stimuli, we are mainly limited to fluorescence-based methods. As we have done in this study, the response of mitochondrial oxidative phosphorylation was analyzed through autofluorescence of mitochondria. Unfortunately, we cannot yet relate that autofluorescence to respiration rate directly. In this work, we assumed that the linear relationships among VO2 and NADH and FP fluorescence (Fig. 4) holds for the measurements in the microscope chamber as well. This is a phenomenological relationship and may not hold in all conditions.
As a part of the solution to the problem of relating VO2 to fluorescence, mathematical models of oxidative phosphorylation can be used. Several detailed models are available that, with the proper calibration, could be applied to extract rates of the processes on the basis of fluorescence measurements. For example, mitochondrial respiration models developed by several groups (33–40) can be used as a starting point for development and calibration of the model that would be able to relate fluorescence measurements to respiration rate. Although all the details of regulation of oxidative phosphorylation are, to our knowledge, not yet known, and, consequently, none of the existing models is perfect, it should be possible to find a set of parameters that would reproduce the simpler experiments. For example, in our experiments, only ATP and ADP were varied and there was no variation of calcium, phosphate, and substrates leading to simple relationship between VO2 and fluorescence (Fig. 4).
As one of the advantages of using single cell preparation, the influence of the unstirred water layer surrounding the cell can be quantified. Here, by using several mathematical models, we found the flow profile in the chamber and in the vicinity of the cell (Fig. 6, A and B). Knowing the flow profile, it is possible to find the influence of ADP or ATP supply from the solution in the cell and separate diffusion gradients induced by intracellular structures from overall diffusion gradients in the system (Fig. 6, B and C). As it is clear from our simulations, intracellular diffusion restrictions are significant (compare black and colored solid lines in Fig. 6 C). In addition to intracellular diffusion restrictions, diffusion gradients induced by ADP supply in the chamber play a significant role as well (compare dashed and solid lines in Fig. 6 C). In our simulations, the cell was positioned along the flow.
We repeated the simulations with the cell positioned perpendicular to the flow and found that computed VO2-ADP relationships at different Km(ADP) were very close to the relationships found with the cell oriented along the flow (results not shown). This suggests that orientation of the cell positioned on the cover glass does not play a major role on the experimental outcome. However, on the basis of our analysis, we can recommend imaging the cell in the part of the chamber with the higher flow velocity (Fig. 6 A). This would reduce contribution of ADP supply in the overall gradients.
The demonstration that the diffusion restrictions are not induced by clumping of the cells in an oxygraph has important physiological consequences. As we have shown in this work, single permeabilized rat cardiomyocytes have a low affinity to exogenous ADP. From this, we conclude that there are significant diffusion restrictions between the solution surrounding the cell and the mitochondrial inner membrane. As we have shown earlier, on the basis of mathematical analysis of measurements performed on permeabilized rat heart muscle fibers and isolated cardiomyocytes, the mitochondrial outer membrane should lead to a diffusion gradient that is ≤0.16 mM (3,7) at half-maximal respiration rate with the rest of the gradient induced by some other intracellular structures. Those structures are not distributed uniformly, but are probably localized in certain areas of the cell, as demonstrated in analysis of respiration response kinetics to stimulation by ATP (5). When assuming that the rest of the diffusion gradient is induced by sarcoplasmic reticulum and proteins in its neighborhood, a very significant diffusion obstacle on that level was predicted by a three-dimensional reaction-diffusion model of rat heart muscle fiber (7).
The physiological role of such diffusion restrictions is still not clear, and is a subject of further studies. At present, we have not yet identified which intracellular structures are responsible for diffusion restrictions. As a result, we cannot predict whether those diffusion restrictions would influence intracellular energy fluxes in the heart leading to modulation of energy transfer depending on the workload (41). In addition, signaling, or response to pathological conditions can be influenced as well. However, what we have demonstrated in this work is that the diffusion restrictions that lower the affinity of mitochondrial respiration to exogenous ADP are localized within permeabilized rat cardiomyocytes.
Acknowledgments
The authors thank Merle Mandel for technical assistance (Laboratory of Systems Biology, Institute of Cybernetics, Tallinn University of Technology, Estonia); Aivar Lõokene, Terje Robal, and Miina Lillepruun (Lipoprotein group, Bioorganic chemistry, Department of Chemistry, Tallinn University of Technology, Estonia) for providing access and help with fluorometer; Hena Ramay and Martin Laasmaa for help with analyzing the data (Laboratory of Systems Biology, Institute of Cybernetics, Tallinn University of Technology, Estonia).
This work was supported by the Wellcome Trust (Fellowship No. WT081755MA) and Estonian Science Foundation (grants 8041 and 7344, PhD stipends for N.J. and M.S., respectively).
Footnotes
This is an Open Access article distributed under the terms of the Creative Commons-Attribution Noncommercial License (http://creativecommons.org/licenses/by-nc/2.0/), which permits unrestricted noncommercial use, distribution, and reproduction in any medium, provided the original work is properly cited.
Supporting Material
References
- 1.Kümmel L. Ca, Mg-ATPase activity of permeabilized rat heart cells and its functional coupling to oxidative phosphorylation of the cells. Cardiovasc. Res. 1988;22:359–367. doi: 10.1093/cvr/22.5.359. [DOI] [PubMed] [Google Scholar]
- 2.Veksler V.I., Kuznetsov A.V., Saks V.A. Mitochondrial respiratory parameters in cardiac tissue: a novel method of assessment by using saponin-skinned fibers. Biochim. Biophys. Acta. 1987;892:191–196. doi: 10.1016/0005-2728(87)90174-5. [DOI] [PubMed] [Google Scholar]
- 3.Sepp M., Vendelin M., Birkedal R. ADP compartmentation analysis reveals coupling between pyruvate kinase and ATPases in heart muscle. Biophys. J. 2010;98:2785–2793. doi: 10.1016/j.bpj.2010.03.025. [DOI] [PMC free article] [PubMed] [Google Scholar]
- 4.Rostovtseva T.K., Sheldon K.L., Sackett D.L. Tubulin binding blocks mitochondrial voltage-dependent anion channel and regulates respiration. Proc. Natl. Acad. Sci. USA. 2008;105:18746–18751. doi: 10.1073/pnas.0806303105. [DOI] [PMC free article] [PubMed] [Google Scholar]
- 5.Vendelin M., Eimre M., Saks V.A. Intracellular diffusion of adenosine phosphates is locally restricted in cardiac muscle. Mol. Cell. Biochem. 2004;256–257:229–241. doi: 10.1023/b:mcbi.0000009871.04141.64. [DOI] [PubMed] [Google Scholar]
- 6.Vendelin M., Birkedal R. Anisotropic diffusion of fluorescently labeled ATP in rat cardiomyocytes determined by raster image correlation spectroscopy. Am. J. Physiol. Cell Physiol. 2008;295:C1302–C1315. doi: 10.1152/ajpcell.00313.2008. [DOI] [PMC free article] [PubMed] [Google Scholar]
- 7.Ramay H.R., Vendelin M. Diffusion restrictions surrounding mitochondria: a mathematical model of heart muscle fibers. Biophys. J. 2009;97:443–452. doi: 10.1016/j.bpj.2009.04.062. [DOI] [PMC free article] [PubMed] [Google Scholar]
- 8.Vendelin M., Béraud N., Saks V.A. Mitochondrial regular arrangement in muscle cells: a “crystal-like” pattern. Am. J. Physiol. Cell Physiol. 2005;288:C757–C767. doi: 10.1152/ajpcell.00281.2004. [DOI] [PubMed] [Google Scholar]
- 9.Birkedal R., Shiels H.A., Vendelin M. Three-dimensional mitochondrial arrangement in ventricular myocytes: from chaos to order. Am. J. Physiol. Cell Physiol. 2006;291:C1148–C1158. doi: 10.1152/ajpcell.00236.2006. [DOI] [PubMed] [Google Scholar]
- 10.Kongas O., Yuen T.L., Krab K. High Km of oxidative phosphorylation for ADP in skinned muscle fibers: where does it stem from? Am. J. Physiol. Cell Physiol. 2002;283:C743–C751. doi: 10.1152/ajpcell.00101.2002. [DOI] [PubMed] [Google Scholar]
- 11.Sokolova N., Vendelin M., Birkedal R. Intracellular diffusion restrictions in isolated cardiomyocytes from rainbow trout. BMC Cell Biol. 2009;10:90. doi: 10.1186/1471-2121-10-90. [DOI] [PMC free article] [PubMed] [Google Scholar]
- 12.Appaix F., Kuznetsov A.V., Saks V. Possible role of cytoskeleton in intracellular arrangement and regulation of mitochondria. Exp. Physiol. 2003;88:175–190. doi: 10.1113/eph8802511. [DOI] [PubMed] [Google Scholar]
- 13.Chance B., Williams G.R. Respiratory enzymes in oxidative phosphorylation. III. The steady state. J. Biol. Chem. 1955;217:409–427. [PubMed] [Google Scholar]
- 14.Chance B., Schoener B., Nakase Y. Oxidation-reduction ratio studies of mitochondria in freeze-trapped samples. NADH and flavoprotein fluorescence signals. J. Biol. Chem. 1979;254:4764–4771. [PubMed] [Google Scholar]
- 15.Chance B., Baltscheffsky M. Spectroscopic effects of adenosine diphosphate upon the respiratory pigments of rat-heart-muscle sarcosomes. Biochem. J. 1958;68:283–295. doi: 10.1042/bj0680283. [DOI] [PMC free article] [PubMed] [Google Scholar]
- 16.Winkler K., Kuznetsov A.V., Kunz W.S. Laser-excited fluorescence studies of mitochondrial function in saponin-skinned skeletal muscle fibers of patients with chronic progressive external ophthalmoplegia. Biochim. Biophys. Acta. 1995;1272:181–184. doi: 10.1016/0925-4439(95)00085-2. [DOI] [PubMed] [Google Scholar]
- 17.Kuznetsov A.V., Mayboroda O., Kunz W.S. Functional imaging of mitochondria in saponin-permeabilized mice muscle fibers. J. Cell Biol. 1998;140:1091–1099. doi: 10.1083/jcb.140.5.1091. [DOI] [PMC free article] [PubMed] [Google Scholar]
- 18.Huang S., Heikal A.A., Webb W.W. Two-photon fluorescence spectroscopy and microscopy of NAD(P)H and flavoprotein. Biophys. J. 2002;82:2811–2825. doi: 10.1016/S0006-3495(02)75621-X. [DOI] [PMC free article] [PubMed] [Google Scholar]
- 19.Sedlic F., Pravdic D., Bienengraeber M. Monitoring mitochondrial electron fluxes using NAD(P)H-flavoprotein fluorometry reveals complex action of isoflurane on cardiomyocytes. Biochim. Biophys. Acta. 2010;1797:1749–1758. doi: 10.1016/j.bbabio.2010.07.009. [DOI] [PMC free article] [PubMed] [Google Scholar]
- 20.Mayevsky A., Barbiro-Michaely E. Use of NADH fluorescence to determine mitochondrial function in vivo. Int. J. Biochem. Cell Biol. 2009;41:1977–1988. doi: 10.1016/j.biocel.2009.03.012. [DOI] [PubMed] [Google Scholar]
- 21.Eng J., Lynch R.M., Balaban R.S. Nicotinamide adenine dinucleotide fluorescence spectroscopy and imaging of isolated cardiac myocytes. Biophys. J. 1989;55:621–630. doi: 10.1016/S0006-3495(89)82859-0. [DOI] [PMC free article] [PubMed] [Google Scholar]
- 22.Mayevsky A., Rogatsky G.G. Mitochondrial function in vivo evaluated by NADH fluorescence: from animal models to human studies. Am. J. Physiol. Cell Physiol. 2007;292:C615–C640. doi: 10.1152/ajpcell.00249.2006. [DOI] [PubMed] [Google Scholar]
- 23.Kunz W.S. Spectral properties of fluorescent flavoproteins of isolated rat liver mitochondria. FEBS Lett. 1986;195:92–96. doi: 10.1016/0014-5793(86)80137-5. [DOI] [PubMed] [Google Scholar]
- 24.Kunz W.S., Gellerich F.N. Quantification of the content of fluorescent flavoproteins in mitochondria from liver, kidney cortex, skeletal muscle, and brain. Biochem. Med. Metab. Biol. 1993;50:103–110. doi: 10.1006/bmmb.1993.1051. [DOI] [PubMed] [Google Scholar]
- 25.Chorvat D., Jr., Kirchnerova J., Chorvatova A. Spectral unmixing of flavin autofluorescence components in cardiac myocytes. Biophys. J. 2005;89:L55–L57. doi: 10.1529/biophysj.105.073866. [DOI] [PMC free article] [PubMed] [Google Scholar]
- 26.Laasmaa M., Vendelin M., Peterson P. Application of regularized Richardson-Lucy algorithm for deconvolution of confocal microscopy images. J. Microsc. 2011;243:124–140. doi: 10.1111/j.1365-2818.2011.03486.x. [DOI] [PMC free article] [PubMed] [Google Scholar]
- 27.Territo P.R., Mootha V.K., Balaban R.S. Ca2+ activation of heart mitochondrial oxidative phosphorylation: role of the F0/F1-ATPase. Am. J. Physiol. Cell Physiol. 2000;278:C423–C435. doi: 10.1152/ajpcell.2000.278.2.C423. [DOI] [PubMed] [Google Scholar]
- 28.Saks V.A., Belikova Y.O., Kuznetsov A.V. In vivo regulation of mitochondrial respiration in cardiomyocytes: specific restrictions for intracellular diffusion of ADP. Biochim. Biophys. Acta. 1991;1074:302–311. doi: 10.1016/0304-4165(91)90168-g. [DOI] [PubMed] [Google Scholar]
- 29.Romashko D.N., Marban E., O'Rourke B. Subcellular metabolic transients and mitochondrial redox waves in heart cells. Proc. Natl. Acad. Sci. USA. 1998;95:1618–1623. doi: 10.1073/pnas.95.4.1618. [DOI] [PMC free article] [PubMed] [Google Scholar]
- 30.Aon M.A., Cortassa S., O'Rourke B. Percolation and criticality in a mitochondrial network. Proc. Natl. Acad. Sci. USA. 2004;101:4447–4452. doi: 10.1073/pnas.0307156101. [DOI] [PMC free article] [PubMed] [Google Scholar]
- 31.Kurz F.T., Aon M.A., Armoundas A.A. Spatio-temporal oscillations of individual mitochondria in cardiac myocytes reveal modulation of synchronized mitochondrial clusters. Proc. Natl. Acad. Sci. USA. 2010;107:14315–14320. doi: 10.1073/pnas.1007562107. [DOI] [PMC free article] [PubMed] [Google Scholar]
- 32.Laasmaa M., Vendelin M., Peterson P. Application of regularized Richardson-Lucy algorithm for deconvolution of confocal microscopy images. J. Microsc. 2011;243:124–140. doi: 10.1111/j.1365-2818.2011.03486.x. [DOI] [PMC free article] [PubMed] [Google Scholar]
- 33.Jafri M.S., Dudycha S.J., O'Rourke B. Cardiac energy metabolism: models of cellular respiration. Annu. Rev. Biomed. Eng. 2001;3:57–81. doi: 10.1146/annurev.bioeng.3.1.57. [DOI] [PubMed] [Google Scholar]
- 34.Korzeniewski B. Regulation of ATP supply during muscle contraction: theoretical studies. Biochem. J. 1998;330:1189–1195. doi: 10.1042/bj3301189. [DOI] [PMC free article] [PubMed] [Google Scholar]
- 35.Vendelin M., Kongas O., Saks V. Regulation of mitochondrial respiration in heart cells analyzed by reaction-diffusion model of energy transfer. Am. J. Physiol. Cell Physiol. 2000;278:C747–C764. doi: 10.1152/ajpcell.2000.278.4.C747. [DOI] [PubMed] [Google Scholar]
- 36.Beard D.A. A biophysical model of the mitochondrial respiratory system and oxidative phosphorylation. PLOS Comput. Biol. 2005;1:e36. doi: 10.1371/journal.pcbi.0010036. [DOI] [PMC free article] [PubMed] [Google Scholar]
- 37.Wu F., Yang F., Beard D.A. Computer modeling of mitochondrial tricarboxylic acid cycle, oxidative phosphorylation, metabolite transport, and electrophysiology. J. Biol. Chem. 2007;282:24525–24537. doi: 10.1074/jbc.M701024200. [DOI] [PubMed] [Google Scholar]
- 38.Nguyen M.-H. T., Dudycha S.J., Jafri M.S. Effect of Ca2+ on cardiac mitochondrial energy production is modulated by Na+ and H+ dynamics. Am. J. Physiol. Cell Physiol. 2007;292:C2004–C2020. doi: 10.1152/ajpcell.00271.2006. [DOI] [PubMed] [Google Scholar]
- 39.Cortassa S., Aon M.A., Winslow R.L. A computational model integrating electrophysiology, contraction, and mitochondrial bioenergetics in the ventricular myocyte. Biophys. J. 2006;91:1564–1589. doi: 10.1529/biophysj.105.076174. [DOI] [PMC free article] [PubMed] [Google Scholar]
- 40.Bazil J.N., Buzzard G.T., Rundell A.E. Modeling mitochondrial bioenergetics with integrated volume dynamics. PLOS Comput. Biol. 2010;6:e1000632. doi: 10.1371/journal.pcbi.1000632. [DOI] [PMC free article] [PubMed] [Google Scholar]
- 41.Vendelin M., Hoerter J.A., Mazet J.L. Modulation of energy transfer pathways between mitochondria and myofibrils by changes in performance of perfused heart. J. Biol. Chem. 2010;285:37240–37250. doi: 10.1074/jbc.M110.147116. [DOI] [PMC free article] [PubMed] [Google Scholar]
- 42.Kushmerick M.J., Podolsky R.J. Ionic mobility in muscle cells. Science. 1969;166:1297–1298. doi: 10.1126/science.166.3910.1297. [DOI] [PubMed] [Google Scholar]
- 43.Bangerth W., Hartmann R., Kanschat G. Deal.II—a general purpose object oriented finite element library. ACM Trans. Math. Softw. 2007;33:24. [Google Scholar]
Associated Data
This section collects any data citations, data availability statements, or supplementary materials included in this article.