

Abstract
Circular dorsal ruffles (CDRs) are transient actin-rich ringlike structures that form on the dorsal surface of growth-factor stimulated cells. However, the dynamics and mechanism of formation of CDRs are still unknown. It has been observed that CDR formation leads to stress fibers disappearing near the CDRs. Because stress fiber formation can be modified by substrate stiffness, we examined the effect of substrate stiffness on CDR formation by seeding NIH 3T3 fibroblasts on glass and polydimethylsiloxane substrates of varying stiffnesses from 20 kPa to 1800 kPa. We found that increasing substrate stiffness increased the lifetime of the CDRs. We developed a mathematical model of the signaling pathways involved in CDR formation to provide insight into this lifetime and size dependence that is linked to substrate stiffness via Rac-Rho antagonism. From the model, increasing stiffness raised mDia1-nucleated stress fiber formation due to Rho activation. The increased stress fibers present increased replenishment of the G-actin pool, therefore prolonging Arp2/3-nucleated CDR formation due to Rac activation. Negative feedback by WAVE-related RacGAP on Rac explained how CDR actin propagates as an excitable wave, much like wave propagation in other excitable medium, e.g., nerve signal transmission.
Introduction
Circular dorsal ruffles (CDRs) are actin-rich structures formed on the dorsal surface of many mammalian cells after stimulation with various growth factors such as the platelet-derived growth factor (PDGF) (1–3). CDRs form in a ringlike manner on the dorsal surface of stimulated cells (thus the term “circular dorsal ruffles” or “circular membrane ruffles”) (1,4,5). Furthermore, protrusion of the dorsal surface of the plasma membrane has been observed at CDRs, and is thought to be driven by polymerization of the branched actin filament network (6). CDRs are dynamic and transient in nature, transversing along the dorsal membrane and disappearing within tens of minutes after growth factor stimulation (7). Less frequent occurrences of CDRs in tumor cells as compared to normal cells suggest that these structures might play an important role in cancer progression (8).
Although the functions of CDRs have not been conclusively established, they are generally believed to be involved in aiding cell motility (9–11) by providing large-scale reorganization of the actin cytoskeleton (7,12,13). In particular, cells that exhibit CDRs after PDGF stimulation have been observed to possess a higher degree of lamellipodial protrusions compared to cells that do not (7). In addition, it has been suggested that CDRs aid in the process of macropinocytosis (14), which allows the cell to internalize extracellular material including molecules and other particles such as cell fragments (15) efficiently. Cells that exhibit CDRs show an increase in macropinocytosis activity (16,17), and macropinosomes form at the site where CDRs disappear on the membrane surface. A third function of CDRs is the sequestration and internalization of receptor tyrosine kinases (RTK) after cell stimulation with ligands. This plays an important role in the modulation of growth factor initiated signaling events, which govern various cellular processes such as cell invasion, motility, and mitosis (14). When cells that express epidermal growth factor (EGF) receptors tagged with green fluorescence proteins are stimulated with EGF, it was observed that the EGF receptors localized within CDRs before being internalized from the cell membrane (8). This suggests that the constriction of CDRs could bring together the RTKs to a singular point on the membrane, facilitating their subsequent internalization into the cell.
Although CDRs have been long observed in cells (14,18,19), little is known about the mechanism of their formation. It has been observed that stress fibers that formed in fibroblasts seeded on fibronectin substrates disappeared in the vicinity of CDR formation (20,21). This suggests an antagonistic relationship between stress fibers and CDRs that could be a result of interactions among signaling proteins known to be involved in growth factor stimulated motility and stress fiber formation, such as Rac and Rho (22,23). Because stress fibers formation has been shown to be modulated by substrate stiffness (24,25), the apparent involvement of stress fibers in the generation of CDRs suggests that substrate stiffness could be a mode of control of CDR dynamics. However, in most of the studies on CDRs, cells are cultured on glass substrates (7). In this article, we quantitatively investigate the effect of varying stiffnesses on the dynamic properties of CDRs, such as their lifetimes and sizes. In addition, we examine the mechanisms of formation of CDRs through the use of mathematical models to explain the changes in the CDR dynamics, both numerically and analytically.
Methods
Preparation and characterization of elastic substrates
By varying the base/curing agent ratio in polydimethylsiloxane (PDMS) (Sylgard 184; Dow Corning, Midland, MI), the resulting elastic modulus (26,27) can be modified by changing the ratio of the cross-linking chains. Young's modulus values of 20, 50, 250, and 1800 kPa were obtained using ratios of 60:1, 50:1, 30:1, and 10:1 silicone elastomer base/curing agent, respectively. The mixtures were cultured in tissue culture plates and degassed under vacuum to remove any bubbles before curing overnight at 60°C. Cells were seeded on these three different elastomeric substrates as well as on glass substrates as a control. Characterization of the PDMS substrates was done using a tensile test (28–30). The flexibility of PDMS substrates with different base/curing agent ratios was determined by stretching sheets with dimensions of 100 mm × 20 mm × 1 mm with a known force F. The elastic modulus was subsequently calculated according to E = (F/A)/(Δl/l), where A is the cross-sectional area of the sheet, l and Δl are the original length and change in length of the sheet in the direction of the applied force, respectively.
Cell culture
To prepare PDMS substrates for cell culture, the surfaces were first sterilized using ethyl alcohol (190 proof, 95%, ACS/USP grade, No. 111USP190; PHARMCO-AAPER, Brookfield, CT). Phosphate-buffered saline (PBS, No. BP399-500; Fisher Scientific International, Hampton, NH) at a 10× solution was diluted to 1× with deionized water, filtered, and used as a buffer solution. The PDMS substrates were coated with fibronectin (10 μg/mL PBS, No. 39410; BD Biosciences, San Jose, CA) for 60 min. NIH 3T3 fibroblasts (National Institutes of Health, Bethesda, MD) were washed once with PBS and then exposed to trypsin-ethylenediamine-tetraacetate (0.05%, No. 25300; Invitrogen, Carlsbad, CA) for 5 min to dissociate them from the tissue culture plates.
The cells were then seeded onto the PDMS substrates and cultured at 37°C and 5% carbon dioxide in growth media consisting of Dulbecco's modified Eagle's medium supplemented with 10% calf serum, glutamine (0.3 mg/mL), streptomycin (100 μg/mL), penicillin (100 U/mL), and 20 mM n-2-hydroxyethylpiperazine-n′-2-ethanesulfonic acid at a pH of 7.4. Cells were incubated for 24 h to allow them to attach and spread. The cell culture media was replaced with media supplemented with 0.2% calf serum to allow the cells to be serum-starved. A quantity of 30 ng/mL of recombinant PDGF-BB (Peprotec; Invitrogen) was added to each sample. A sample was prepared for each of the PDGF-BB stimulation time intervals (2.5 min, then 5–50 min at 5-min intervals), and for each of the four PDMS substrate stiffness values (20 kPa, 50 kPa, 250 kPa, and 1800 kPa), as well as on glass, before immediately fixing and staining them.
Fluorescent staining and visualization
To visualize the cytoskeletal structure of the cells using fluorescent immunostaining, the cells were fixed with 4% paraformaldehyde and treated with 0.1% Triton-X, followed by staining with 6 μM phalloidin-tetramethylrhodamine-mine B isothiocyanate (No. P1951; Sigma-Aldrich, St. Louis, MO) and DAPI (40,6-diamidino-2-phenylindole, dihydrochloride; 2 μg in 1 mL PBS, No. D21490; Invitrogen), which labeled the actin filaments and the nucleus, respectively. After incubating the cells with phalloidin and DAPI, they were mounted on glass coverslips with Fluoromount-G (No. 0100-01; Southern Biotech, Birmingham, AL). By using an inverted fluorescent microscope (Axiovert 200; Carl Zeiss, Oberkochen, Germany) with a 63× (1.4 NA) objective, the actin filaments and nucleus of the NIH 3T3 fibroblasts were imaged.
Data analysis
The surface area of the plasma membrane enclosed by a CDR in the images was calculated using ImageJ software (National Institutes of Health). We traced the perimeter of a CDR in the images that were captured with our charge-coupled device camera, and determined the area by the pixels within the traced region. Through this approach, we also calculated the perimeter of the CDR, as well as the major and minor axis values of the best fit ellipsoid to the CDR, which is a function of ImageJ (National Institutes of Health). The persistence time of CDRs in cells cultured on a given substrate was based on the time interval after PDGF stimulation whereby the sample had no visible CDRs that could be identified.
Results and Discussion
CDR size is independent of substrate stiffness but CDR lifetime increases with substrate stiffness
The actin distribution in the cells before and after PDGF stimulation on different substrates is shown in Fig. 1. In the left column (Fig. 1, A–E), cells before PDGF stimulation contained stress fibers and do not appear to contain CDRs. However, the right column (Fig. 1, F–J) shows cells with CDRs forming 5 min after PDGF stimulation. The CDRs are actin ringlike structures, which cover a significant percentage of the projected area in an image of the entire cell. Along with the effects of substrate stiffness on the percentage of cells expressing CDRs (see the Supporting Material), we also examined the time dependence of CDR characteristics, and if this was affected by substrate stiffness. To quantify the dynamics of CDRs, their geometries were monitored over time for substrates with controlled stiffnesses. A representative response is shown in Fig. 2 for cells seeded on glass (Fig. 2, A–C) and 50 kPa substrate (Fig. 2, D–F) for times 10, 20, and 30 min after PDGF stimulation.
Figure 1.
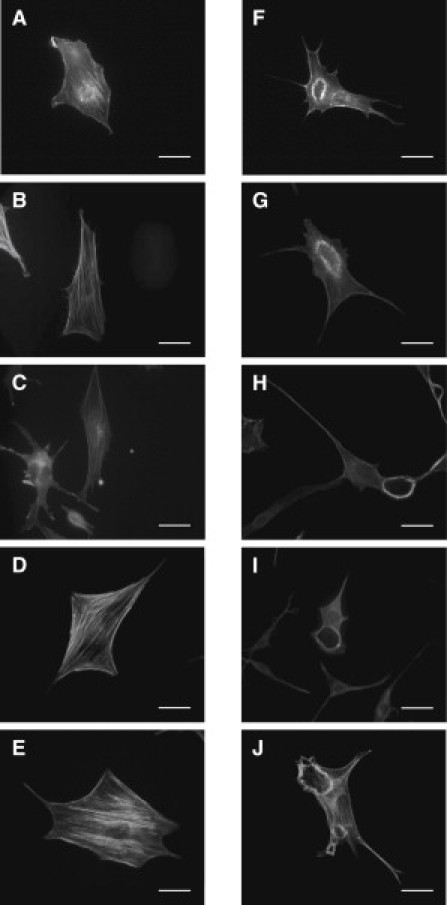
Stiffness-based comparison of CDRs formed in cells. Cells stained for F-actin before (A–E) and after (F–J) 5 min of PDGF stimulation. Cells were seeded on substrates with stiffnesses of (A and F) 20 kPa, (B and G) 50 kPa, (C and H) 250 kPa, (D and I) 1800 kPa, and on (E and J) glass. (Bars) 10 μm.
Figure 2.
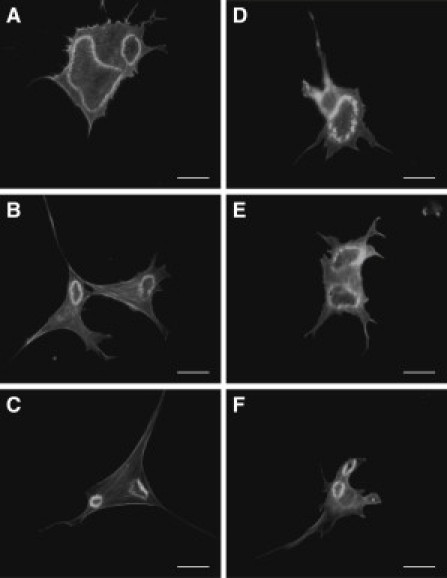
Time-based comparison of CDRs formed in cells seeded on (A–C) glass and on (D–F) 50 kPa PDMS substrates. The CDRs shown were taken of cells that had undergone (A and D) 10, (B and E) 20, and (C and F) 30 min of PDGF stimulation. (Bars) 10 μm.
To quantify average CDR size, four parameters were used: 1) The average projected area enclosed by the CDRs (Fig. 3 A); 2), the average ring perimeter (Fig. 3 B); and 3) and 4), the average length of the major and the minor axes (Fig. 3, C and D, respectively), which was accomplished through fitting the shapes of the CDRs to an ellipsoid. A total of 30 CDRs were observed for each of three cell populations, for each substrate, and at each time interval. For all cases of cells seeded on substrates with different stiffnesses, including on glass, the average size of the CDRs quantified by the four parameters mentioned above increased quickly from 0 to 2.5 min. Between 2.5 and 20 min, the average size of the CDR rings showed no discernable differences between the cell populations on all four substrates with differing stiffnesses. After 20 min, the observed CDR size for all cell populations started to decline. No CDRs were detected for cell populations on the 20, 50, 250, and 1800 kPa substrates after 25, 35, 40, and 45 min, respectively. In addition, no CDRs were found in any of the cell populations seeded on glass substrates after 45 min. Although the maximum size of CDRs was not affected by substrate stiffness (as shown in Fig. 3), the lifetime of CDRs appeared to increase with increasing substrate stiffness.
Figure 3.
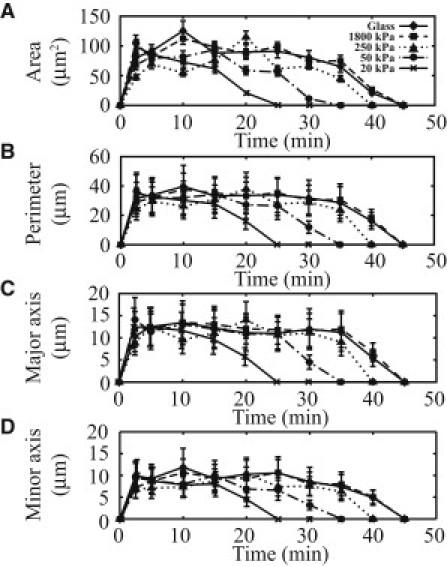
Quantification of the size of CDRs observed in cells. The (A) area, (B) perimeter and (C) major and as well as (D) minor axes of the best fit ellipsoid to the CDRs are shown. (n = 3.) (Bars) One standard error.
To understand the dependence of the size and lifetime of CDRs on substrate stiffness, we constructed a mathematical model of the signaling cascade that has been suggested to be involved in CDR formation under PDGF stimulation. This signaling cascade is summarized in Fig. 4. Past literature shows that upon PDGF stimulation, the phosphatidylinositol 3-kinase is activated that phosphorylates phosphatidylinositol (4,5)-bisphosphate on the plasma membrane, thus forming phosphatidylinositol (3,4,5)-trisphosphate (PIP3) (31). This causes the Rac guanine nucleotide exchange factor (RacGEF) to localize to the membrane, which promotes the activation of the small GTPase Rac (32). Excessive PIP3 formation is checked by PTEN formation (33). Activated Rac binds to the WAVE1 complex, resulting in the dissociation of the WAVE1 complex (34,35), rendering the WAVE1 protein available for binding with Arp2/3 (36), which promotes the nucleation of actin filaments, leading to generation of actin filaments close to the membrane. The activation of Rac can be regulated by RacGAPs. Studies have demonstrated the existence of RacGAPs that can bind to WAVE associated proteins, such as the 3BP-1 (which can bind to Abl, a protein in the WAVE1 complex) (37,38).
Figure 4.
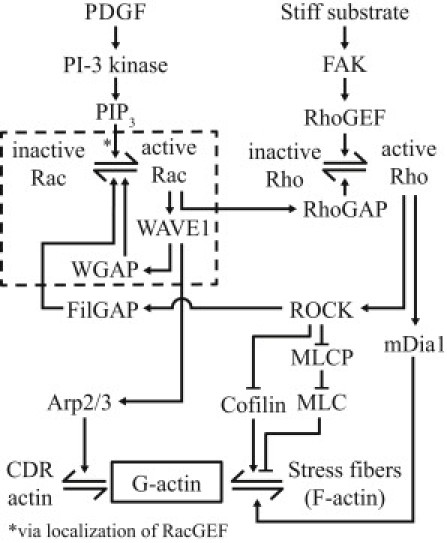
Summary of events leading up to CDR formation from PDGF stimulation for generation of the complete model. The reduced model is constructed from the events (enclosed within the dashes). References for these events are provided in the text.
Therefore, we suggest that the activation of a RacGAP that can bind to WAVE1, which we will refer to as “WGAP” in this article, provides a feedback mechanism to prevent the overactivation of Rac, which we will show later is required for the ringlike structure of CDRs. A specific example of WGAP is the WAVE-associated RacGAP found in neurons (39). Rac can also be regulated by and, in turn, regulates the stress fiber promoting small GTPase, Rho. Activated Rac binds and activates p190B Rho GTPase-activating protein (RhoGAP), leading to a reduction in Rho activity (40). Activated Rho, on the other hand, can be an antagonist to Rac by activation of the Rho-associated protein kinase (ROCK), which causes the activation of the RacGAP, FilGAP (41). Activated Rho is also known to encourage the formation of stress fibers at focal adhesions by 1), the activation of the Rho-associated protein kinase (ROCK), which increases phosphorylation of myosin light chains by the inactivation of myosin light chain phosphatase, and reduces levels of activated cofilin, both of which preserves the stress fibers formed at focal adhesions, and 2), the activation of mDia1, which is required for the nucleation of stress fibers (22,42). Increased activation of Rho can be a result of increased phosphorylation of the focal adhesion kinase (FAK), which activates the RhoGEF, p190RhoGEF (43), which has been observed in cells seeded on stiffer substrates (44,45). This would also result in an increase in the initial amount of stress fibers before PDGF stimulation. This suggests that increasing the substrate stiffness would result in an increase in the amount of stress fibers before the cells were subjected to PDGF stimulation. An analysis of the ratio of F-actin to the total amount of F-actin and G-actin in the cells before PDGF stimulation showed that there was indeed an increase in the ratio of F-actin as the substrate stiffness was increased (see the Supporting Material).
These interactions can be written in the form of mass action and Michaelis-Menten kinetics to form a set of coupled ordinary differential equations. In addition, we assume that these interactions occur in three separate noninteracting compartments: extracellular, membrane, and cytosolic. Within each compartment, the individual protein species can diffuse. Certain proteins, when activated, become bound/unbound from the membrane and take on the diffusive behavior of proteins in the membrane compartment (namely, phosphatidylinositol-3 kinase, PTEN, RacGEF, Rac, WAVE1, WGAP, RhoGAP, Arp2/3, and F-actin that make up the stress fibers and CDR actin). Therefore, with the inclusion of compartments and protein diffusion, our mathematical model comprises a set of coupled partial differential equations. Because the CDRs tend to take on a circular shape, we assume azimuthal symmetry and solve our system in the radial dimension only, using the region of PDGF receptor activation as the origin. The equations and parameters used in the simulations are included in the Supporting Material. The equations were solved in MATLAB (The MathWorks, Natick, MA) using the PDE solver pdepe, which discretizes the equations and evolves the functions explicitly.
Rac-Rho antagonism tunes the level of actin available for stress fibers and CDRs
There is evidence that increasing substrate stiffness can raise the amount of active FAK (44,45). Because FAK is involved in the formation of stress fibers that are composed of actin, we propose that the modulation of CDR lifetimes by the substrate stiffness occurs through alteration of FAK concentration in the cell. Before PDGF stimulation, the spreading of the cell and thus FAK activation results in the activation of Rho that, via the activation of ROCK, leads to the activation of RacGAP. Therefore, activated Rho generates the inactivation of Rac. Because active Rho leads to downstream activation of mDia1 and active Rac leads to downstream activation of Arp2/3, we see the presence of mDia1-nucleated stress fiber formation and absence of Arp2/3-nucleated CDR before stimulation, as shown in Fig. 1, A–E. However, upon addition of PDGF, Rac gets activated and causes the downstream activation of RhoGAP, leading to the inactivation of Rho. This causes the loss of mDia1-nucleated stress fibers formation and increase in Arp2/3-nucleated CDR formation. By increasing the substrate stiffness, there is heightened FAK activation, causing increased stress fiber formation before PDGF stimulation.
Once stimulated by PDGF, the stress fibers dissociate and the high amount of stress fibers initially present leads to increased replenishing of the G-actin pool, therefore effectively increasing the lifetime of the CDR that draws actin from the G-actin pool. The results from solving the mathematical model using different amounts of FAK are shown in Fig. 5. In Fig. 5 A, the size and lifetime of CDRs are shown for different concentrations of activated focal adhesion kinase (FAK), whereas Fig. 5, B and C, depicts the distribution of CDR versus time for two different concentrations of FAK. As mentioned previously, because activated FAK has been shown to increase with substrate stiffness (44) that leads to increased stress fiber formation before PDGF stimulation, the increase in lifetime of CDRs as the FAK concentration is raised (as shown in Fig. 5 A) is representative of increased CDR lifetime as substrate stiffness is raised. This also agrees with the experimental results. This suggests that CDRs and stress fibers can be used as markers to observe the antagonism between Rac and Rho that governs the competition between the two types of actin: Arp2/3-nucleated actin and mDia1-nucleated actin.
Figure 5.
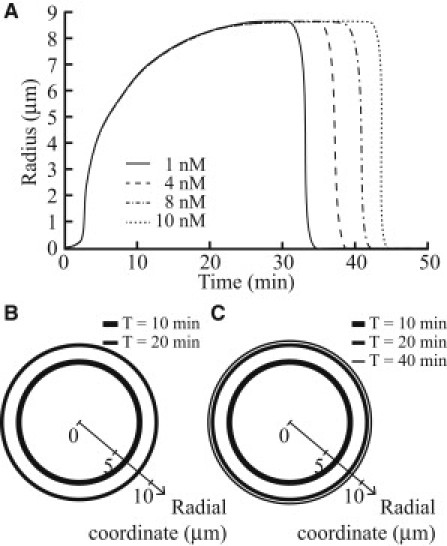
Simulations results for the effect of FAK concentration on CDRs. (A) Variation of radius of CDRs with time for different FAK concentrations. (B) CDR formation at T = 10 min and 20 min for [FAK] = 1 nM. Note that no CDR is observed at T = 40 min. (C) CDR formation at T = 10 min, 20 min, and 40 min for [FAK] = 10 nM.
Negative feedback by WGAP results in actin ring instead of actin patch formation
Our simulations, with the initial condition of PDGF being introduced uniformly throughout but that the PDGF receptors are assumed to occupy a small localized patch at the origin, led to rapid phosphorylation of PIP2 to PIP3 that propagated away from the point of stimulation gradually, due to the low diffusivity of membrane elements, while maintaining the location of its peak at the origin. The localization of PIP3 close to the front of a cell subjected to a uniform PDGF stimulation has been shown experimentally (46), which agrees with our simulation results. Activated Rac that localized to PIP3, however, formed a peak that traveled away from the origin quickly and attained a stable spatial location before moving toward the origin again while decaying at the same time, which led to CDR actin behaving in the same manner. This would resemble the generation of a CDR from a point into its ringlike structure. The mathematical model revealed that formation of the ringlike structure was a result of the negative feedback provided by WGAP. The high amounts of WAVE1 activated by the locally stimulated PDGF receptor is likely to have caused a spike in activated WGAP, resulting in a decrease in activated Rac at the site of stimulation. This can be observed in Fig. 6, E–H, which showed a growing region of actin centered at the origin that decreased in height at later times, in contrast with the ring generation in the presence of WGAP, represented in Fig. 6, A–C, as single peaks centered away from the origin (note that in Fig. 6 D, no peak is seen because the CDR has completely decayed).
Figure 6.
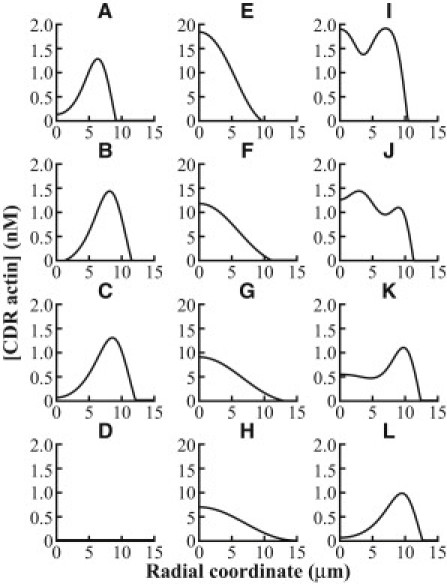
Simulation results for the effect of WGAP and multiple PDGF receptor aggregates on CDRs. The variations of [CDR actin] in radial space in the presence of WGAP at (A) T = 10 min, (B) T = 20 min, (C) T = 30 min, and (D) T = 40 min after PDGF receptor activation at the origin are shown. The single peak in [CDR actin] is seen to travel away from the origin, illustrating a growing ring of CDR actin. In the absence of WGAP, similar plots are shown in panels E–H. Note that without WGAP, the peak amount of [CDR actin] is elevated and centered at the origin, which translates to a patch of CDR actin that grows in size. Lastly, the variations of [CDR actin] after PDGF receptor activation at the origin and at radial coordinate of 7.5 μm is shown at (I) T = 2 min, (J) T = 4 min, (K) T = 8 min, and (L) T = 20 min. Note that only one peak is seen at later times, indicating that only one CDR actin ring is formed.
Multiple CDRs spread and merge into a single CDR
To study the scenario when two or more CDRs interact, we repeated the simulations but now with two localized patches of PDGF receptors to initiate two CDRs. The individual CDRs grow rapidly and merge to form a single CDR. A representative response is shown in Fig. 6, I–L. This can be understood as a phenomenon in excitable media (see below), where the passing wave leaves behind a refractory region in which a subsequent activation is not possible (47). Thus, as two distinct CDRs approach each other, they annihilate each other because neither one can cross the refractory region behind the leading edge of the approaching wave, where the Rac recently became inactive and cannot yet activate. Thus, multiple CDRs would converge to form one large CDR instead of forming a chain of intersecting CDRs. In fact, our imaging results presented no occurrences of intersecting CDRs found.
CDR actin propagates as an excitable wave
Finally, we propose that Rac and WGAP play key roles in the formation of CDRs and thus, we can write down a reduced model to describe the interaction between Rac and WGAP. The inactivation of Rac by WGAP is paralleled to an enzymatic reaction that requires the activation of WAVE1 and is in turn activated by Rac. Close examination of the results of the complex model shows us that the concentration of activated WAVE1 changes proportionately with activated Rac. Because the inactivation of Rac by WGAP requires both active Rac and active WAVE1, this reaction can be simplified to be a cooperative enzymatic reaction with a Hill coefficient of two by substituting WAVE1 with active Rac. Here, we use the Hill's equation to phenomenologically represent the inactivation of Rac by WGAP. The activation of WGAP can be simplified to a Michaelis-Menten-type reaction. At the same time, Rac and WGAP can diffuse as membrane-bound proteins. Therefore,
where T and R represent the time and radial dimensions, and X and Y represent active Rac and WGAP, respectively. The parameters V1 and Km1 characterize the enzymatic activation of Rac after PDGF stimulation, V2 and Km2 characterize the enzymatic deactivation of Rac by WGAP, V3 and Km3 characterize the enzymatic activation of WGAP after Rac activation, Xt and Yt denote the total Rac and WGAP present, and D represents the diffusion coefficients of Rac and WGAP, taken to be the same in this study. By introducing nondimensional quantities
we obtain
| (1) |
| (2) |
where
Here,
In this reduced model, we assume that actin concentration will be proportional to Rac concentration and hence to x. Numerical analysis of this reduced model shows that x forms a ring that grows and shrinks in time, observed as a single peak in CDR actin concentration that moves radially away from the origin then toward the origin. This justifies the choice of Rac and WGAP as key proteins responsible for the ringlike structure and the dynamics of CDRs.
A phase diagram depicting the kinetics of the reduced model with equal values for Xt and Yt (such that yt = 1) and suitable parameters in a homogenous solution such that diffusion can be neglected is shown in Fig. 7 A. Using standard linear stability analysis of the system, we were able to show that the only steady state of the system (x ≈ 0 and y = yt) is stable to perturbations. This can also be observed in Fig. 7 A, where all possible paths lead back to the steady state. Using a small value of V3, we can create an excitable system that displays two types of behavior depending on the magnitude of the deviation of WGAP from its steady-state value:
-
1.
When WGAP deviates slightly from its steady-state value regardless of the amount of Rac present, the system quickly returns to its stable steady state as can be observed in Fig. 7 A by the solid path. This indicates that upon attaining a state of high WGAP and low Rac (usually in the later part of PDGF stimulation), disturbances to the system caused by increasing Rac via additional PDGF stimulation would not result in CDR formation because Rac is quickly inactivated.
-
2.
A large deviation in WGAP from its steady state, however, can trigger a rapid growth of Rac whereas WGAP remains almost constant. This is reminiscent of PDGF stimulation, where the cell begins with a low value of WGAP and Rac (achieved by the absence of PDGF, where V1 is zero, resulting in no formation of Rac or WGAP). The rapid growth of Rac is halted when the amount of Rac approaches the value where F(x,y) is close to zero, therefore starting the slow phase of the kinetics, where Rac remains almost constant whereas WGAP increases slowly. The next fast phase of the kinetics is initiated when WGAP is suitably high, once again causing Rac to evolve much faster than WGAP. The plot of Rac and WGAP versus time is depicted in Fig. 7 B for the path traced out by the dashed curve in Fig. 7 A. This behavior is observed when the initial fraction of activated WGAP is below the ratio v1/v2 (see the Supporting Material for explanation); in this case, the ratio was 0.5. In a heterogeneous solution, however, the presence of diffusion results in the possibility of a traveling pulse solution. To illustrate this, we introduce a moving frame, denoted by ξ = r − ct, such that at high values of r, the equations are transformed to
| (3) |
| (4) |
Rac and WGAP are now functions of ξ, with c denoting the velocity of the moving frame. Therefore, as seen in Fig. 7 B, Rac takes on largely two values during its evolution: x+ ≈ Ract and x− ≈ 0. This implies that should a nonuniform solution be created for Rac, it would resemble a front that serves as an interface between the two regions. With a suitable choice of c, we can create a moving frame that travels with the moving front such that the front appears stationary in the moving frame. As the value of Rac is almost stationary in the slow regions (which, in these experiments, is most of the time in the evolution of Rac and WGAP), this velocity of the moving frame c, and therefore the moving front, is dependent on the amount of WGAP present. Moving out of the moving frame, this implies that a front/pulse in Rac created from x+ and x− would grow, then shrink, as the value of WGAP changes with time. Thus, the above analysis shows that the growth and decay of CDR actin can be explained as pulse propagation in an excitable media, in which a wave is able to propagate in a nonlinear dynamical system, which is the excitable media.
Figure 7.
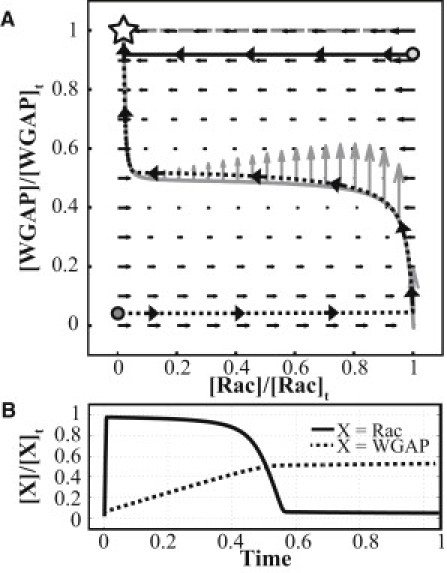
Phase diagram and time plots for Rac and WGAP, depicting the variation of Rac and WGAP with each other and in time, respectively. (A) Nullclines of F(x,y) = 0 (shaded line) and G(x,y) = 0 in (dashed line). (Arrows) Dynamics of Rac and WGAP (shaded arrows on the F(x,y) = 0 nullcline are scaled to 1000 times of the solid arrows). The stable steady state is indicated (star). (Solid curve) The rapid return of Rac and WGAP (from their values at the light-shaded dot) to their steady-state values when WGAP is only slightly decreased from its steady-state value. (Dashed curve) A typical course of excursion upon PDGF stimulation, where active Rac and active WGAP are both low, as indicated (dark-shaded dot). (B) Variation of Rac and WGAP with dimensionless time (with an initial state equivalent to that represented by the dark-shaded dot in panel A). WGAP attains the value of [WGAP]t at a much later time due to the slow dynamics of WGAP.
The finding that through the modification of the underlying substrate stiffness of cell populations, CDR kinetics after cell stimulation with PDGF can be controlled, has implications that are related to the functionalities of CDRs within a cell. For example, because it has been hypothesized that CDRs aid in cell migration (12,13) through large-scale actin network reorganization, reduced CDR kinetics could mean that the actin network is reorganized less quickly, which could affect cell motility potential. Also, because cells that exhibit CDRs might have a role to play in macropinocytosis (16,17), differing CDR kinetics could affect the rate at which this process occurs. Because CDR formation might aid in RTK sequestration and internalization after cell stimulation with ligands (8), reduced CDR dynamics would likely result in a reduced rate of these processes.
Conclusion
This study investigated how varying PDMS substrate stiffness affects CDR properties after PDGF stimulation of NIH 3T3 fibroblasts. To accomplish this, the cells were seeded on three PDMS substrates with differing stiffnesses as well as on glass substrates. We found that an increase in the underlying substrate stiffness of these cells increased the lifetime of CDRs but not their size. Mathematical modeling of the signaling pathways demonstrated that the increase in lifetime of CDRs with increasing substrate stiffness was an effect of the antagonism between Rac and Rho, as Rac activation coupled with increased substrate stiffness led to heightened disassembly of stress fibers as a result of Rac-induced deactivation of Rho.
The rise in G-actin available for Rac-induced CDRs formation therefore led to an increase in the lifetime of the CDRs. One future area of interest is to knock down or inhibit Arp2/3, which may reduce the amount of CDRs observed as Rac can no longer effect Arp2/3 nucleation of actin. A knock-down of mDia1, however, may reduce the lifetime of CDRs observed because fewer stress fibers are formed, resulting in diminished replenishing of the G-actin pool during CDR formation. On the other hand, PDGF stimulation followed by the inhibition of mDia1 may lead to prolonged CDR formation because the inhibition of mDia1 is a downstream effect of the inactivation of Rho. It is also noteworthy to mention that the absence of forces in the model suggest that the closing and disappearance of CDRs can be achieved independently of mechanical pulling on CDR actin, which can result from myosin localization to CDRs.
Using the same model, we also show how RacGAP that binds to WAVE1 (which we term “WGAP”) negatively regulated Rac and caused a local dip in the amount of Arp2/3-nucleated CDRs. This suggests that in the future, knocking out WGAP or mutating the binding domains between WGAP and WAVE1 may result in actin patch formation on the dorsal surface of migratory cells upon PDGF addition, which grow and disappear with similar dynamics as CDRs. Using a reduced model comprising only Rac and WGAP, we demonstrated that CDR actin growth and decay can be modeled as a pulse propagation in an excitable medium. The velocity of the moving front could be verified through live cell imaging in a future direction of this work. Through the potential effects that substrate stiffness has on CDR functionalities, such as macropinocytosis, cell motility, and RTK receptor internalization, we believe that our results have implications in fields ranging from mechanobiology to cancer research.
Acknowledgments
We thank Alexander Bershadsky and Ronen Zaidel-Bar for insightful discussions.
This work was supported in part by the National Science Foundation (CMMI-0856187 and CMMI-1013748) and the Office of Naval Research (N000140910215).
Contributor Information
Philip R. LeDuc, Email: prl@andrew.cmu.edu.
K.-H. Chiam, Email: chiamkh@ihpc.a-star.edu.sg.
Supporting Material
References
- 1.Mellström K., Heldin C.H., Westermark B. Induction of circular membrane ruffling on human fibroblasts by platelet-derived growth factor. Exp. Cell Res. 1988;177:347–359. doi: 10.1016/0014-4827(88)90468-5. [DOI] [PubMed] [Google Scholar]
- 2.Mellstroöm K., Höglund A.S., Lindberg U. The effect of platelet-derived growth factor on morphology and motility of human glial cells. J. Muscle Res. Cell Motil. 1983;4:589–609. doi: 10.1007/BF00712117. [DOI] [PubMed] [Google Scholar]
- 3.Tamura M., Iwamoto Y. The effect of platelet-derived growth factor on phagocytosis of cultured human trabecular cells. Exp. Eye Res. 1989;48:761–770. doi: 10.1016/0014-4835(89)90062-6. [DOI] [PubMed] [Google Scholar]
- 4.Araki N., Egami Y., Hatae T. Phosphoinositide metabolism during membrane ruffling and macropinosome formation in EGF-stimulated A431 cells. Exp. Cell Res. 2007;313:1496–1507. doi: 10.1016/j.yexcr.2007.02.012. [DOI] [PubMed] [Google Scholar]
- 5.Arvidsson A.K., Heldin C.H., Claesson-Welsh L. Transduction of circular membrane ruffling by the platelet-derived growth factor β-receptor is dependent on its kinase insert. Cell Growth Diff. 1992;3:881–887. [PubMed] [Google Scholar]
- 6.Dharmawardhane S., Sanders L.C., Bokoch G.M. Localization of p21-activated kinase 1 (PAK1) to pinocytic vesicles and cortical actin structures in stimulated cells. J. Cell Biol. 1997;138:1265–1278. doi: 10.1083/jcb.138.6.1265. [DOI] [PMC free article] [PubMed] [Google Scholar]
- 7.Krueger E.W., Orth J.D., McNiven M.A. A dynamin-cortactin-Arp2/3 complex mediates actin reorganization in growth factor-stimulated cells. Mol. Biol. Cell. 2003;14:1085–1096. doi: 10.1091/mbc.E02-08-0466. [DOI] [PMC free article] [PubMed] [Google Scholar]
- 8.Orth J.D., Krueger E.W., McNiven M.A. A novel endocytic mechanism of epidermal growth factor receptor sequestration and internalization. Cancer Res. 2006;66:3603–3610. doi: 10.1158/0008-5472.CAN-05-2916. [DOI] [PubMed] [Google Scholar]
- 9.Bereiter-Hahn J., Strohmeier R., Vöth M. Locomotion of Xenopus epidermis cells in primary culture. J. Cell Sci. 1981;52:289–311. doi: 10.1242/jcs.52.1.289. [DOI] [PubMed] [Google Scholar]
- 10.Soranno T., Bell E. Cytostructural dynamics of spreading and translocating cells. J. Cell Biol. 1982;95:127–136. doi: 10.1083/jcb.95.1.127. [DOI] [PMC free article] [PubMed] [Google Scholar]
- 11.Marchisio P.C., Capasso O., Gionti E. Cytoskeleton and adhesion patterns of cultured chick embryo chondrocytes during cell spreading and Rous sarcoma virus transformation. Exp. Cell Res. 1984;151:332–343. doi: 10.1016/0014-4827(84)90384-7. [DOI] [PubMed] [Google Scholar]
- 12.Hedberg K.M., Bengtsson T., Lindroth M. PDGF and neomycin induce similar changes in the actin cytoskeleton in human fibroblasts. Cell Motil. Cytoskeleton. 1993;24:139–149. doi: 10.1002/cm.970240207. [DOI] [PubMed] [Google Scholar]
- 13.Ballestrem C., Wehrle-Haller B., Imhof B.A. Actin dynamics in living mammalian cells. J. Cell Sci. 1998;111:1649–1658. doi: 10.1242/jcs.111.12.1649. [DOI] [PubMed] [Google Scholar]
- 14.Gu Z., Noss E.H., Brenner M.B. Integrins traffic rapidly via circular dorsal ruffles and macropinocytosis during stimulated cell migration. J. Cell Biol. 2011;193:61–70. doi: 10.1083/jcb.201007003. [DOI] [PMC free article] [PubMed] [Google Scholar]
- 15.Falcone S., Cocucci E., Meldolesi J. Macropinocytosis: regulated coordination of endocytic and exocytic membrane traffic events. J. Cell Sci. 2006;119:4758–4769. doi: 10.1242/jcs.03238. [DOI] [PubMed] [Google Scholar]
- 16.Dowrick P., Kenworthy P., Warn R. Circular ruffle formation and closure lead to macropinocytosis in hepatocyte growth factor/scatter factor-treated cells. Eur. J. Cell Biol. 1993;61:44–53. [PubMed] [Google Scholar]
- 17.Warn R., Brown D., Warn A. Cytoskeletal changes associated with cell motility. Symp. Soc. Exp. Biol. 1993;47:325–338. [PubMed] [Google Scholar]
- 18.Ruusala A., Sundberg C., Claesson-Welsh L. Platelet-derived growth factor (PDGF)-induced actin rearrangement is deregulated in cells expressing a mutant Y778F PDGF β-receptor. J. Cell Sci. 1998;111:111–120. doi: 10.1242/jcs.111.1.111. [DOI] [PubMed] [Google Scholar]
- 19.Hooshmand-Rad R., Claesson-Welsh L., Heldin C.H. Involvement of phosphatidyl inositide 3′-kinase and Rac in platelet-derived growth factor-induced actin reorganization and chemotaxis. Exp. Cell Res. 1997;234:434–441. doi: 10.1006/excr.1997.3636. [DOI] [PubMed] [Google Scholar]
- 20.Buccione R., Orth J.D., McNiven M.A. Foot and mouth: podosomes, invadopodia and circular dorsal ruffles. Nat. Rev. Mol. Cell Biol. 2004;5:647–657. doi: 10.1038/nrm1436. [DOI] [PubMed] [Google Scholar]
- 21.Moes M., Boonstra J., Regan-Klapisz E. Novel role of cPLA(2)α in membrane and actin dynamics. Cell. Mol. Life Sci. 2010;67:1547–1557. doi: 10.1007/s00018-010-0267-0. [DOI] [PMC free article] [PubMed] [Google Scholar]
- 22.Burridge K., Wennerberg K. Rho and Rac take center stage. Cell. 2004;116:167–179. doi: 10.1016/s0092-8674(04)00003-0. [DOI] [PubMed] [Google Scholar]
- 23.Takai Y., Sasaki T., Matozaki T. Small GTP-binding proteins. Physiol. Rev. 2001;81:153–208. doi: 10.1152/physrev.2001.81.1.153. [DOI] [PubMed] [Google Scholar]
- 24.Discher D.E., Janmey P., Wang Y.-L. Tissue cells feel and respond to the stiffness of their substrate. Science. 2005;310:1139–1143. doi: 10.1126/science.1116995. [DOI] [PubMed] [Google Scholar]
- 25.Yeung T., Georges P.C., Janmey P.A. Effects of substrate stiffness on cell morphology, cytoskeletal structure, and adhesion. Cell Motil. Cytoskeleton. 2005;60:24–34. doi: 10.1002/cm.20041. [DOI] [PubMed] [Google Scholar]
- 26.Brown X.Q., Ookawa K., Wong J.Y. Evaluation of polydimethylsiloxane scaffolds with physiologically-relevant elastic moduli: interplay of substrate mechanics and surface chemistry effects on vascular smooth muscle cell response. Biomaterials. 2005;26:3123–3129. doi: 10.1016/j.biomaterials.2004.08.009. [DOI] [PubMed] [Google Scholar]
- 27.Armani, A., C. Liu, and N. Aluru. 1999. Re-configurable fluid circuits by PDMS elastomer micromachining. Micro Electro Mechanical Systems 1999. Twelfth IEEE International Conference. 222–227.
- 28.Pelham R.J., Jr., Wang Y. Cell locomotion and focal adhesions are regulated by substrate flexibility. Proc. Natl. Acad. Sci. USA. 1997;94:13661–13665. doi: 10.1073/pnas.94.25.13661. [DOI] [PMC free article] [PubMed] [Google Scholar]
- 29.LeDuc P.R., Messner W.C., Wikswo J.P. How do control-based approaches enter into biology? Annu. Rev. Biomed. Eng. 2011;13:369–396. doi: 10.1146/annurev-bioeng-071910-124651. [DOI] [PubMed] [Google Scholar]
- 30.Lin Y.-W., Cheng C.-M., Chen C.C. Understanding sensory nerve mechanotransduction through localized elastomeric matrix control. PLoS ONE. 2009;4:e4293. doi: 10.1371/journal.pone.0004293. [DOI] [PMC free article] [PubMed] [Google Scholar]
- 31.Auger K.R., Serunian L.A., Cantley L.C. PDGF-dependent tyrosine phosphorylation stimulates production of novel polyphosphoinositides in intact cells. Cell. 1989;57:167–175. doi: 10.1016/0092-8674(89)90182-7. [DOI] [PubMed] [Google Scholar]
- 32.Hawkins P.T., Eguinoa A., Symons M. PDGF stimulates an increase in GTP-Rac via activation of phosphoinositide 3-kinase. Curr. Biol. 1995;5:393–403. doi: 10.1016/s0960-9822(95)00080-7. [DOI] [PubMed] [Google Scholar]
- 33.Gamba A., de Candia A., Serini G. Diffusion-limited phase separation in eukaryotic chemotaxis. Proc. Natl. Acad. Sci. USA. 2005;102:16927–16932. doi: 10.1073/pnas.0503974102. [DOI] [PMC free article] [PubMed] [Google Scholar]
- 34.Suetsugu S., Yamazaki D., Takenawa T. Differential roles of WAVE1 and WAVE2 in dorsal and peripheral ruffle formation for fibroblast cell migration. Dev. Cell. 2003;5:595–609. doi: 10.1016/s1534-5807(03)00297-1. [DOI] [PubMed] [Google Scholar]
- 35.Eden S., Rohatgi R., Kirschner M.W. Mechanism of regulation of WAVE1-induced actin nucleation by Rac1 and Nck. Nature. 2002;418:790–793. doi: 10.1038/nature00859. [DOI] [PubMed] [Google Scholar]
- 36.Takenawa T., Suetsugu S. The WASP-WAVE protein network: connecting the membrane to the cytoskeleton. Nat. Rev. Mol. Cell Biol. 2007;8:37–48. doi: 10.1038/nrm2069. [DOI] [PubMed] [Google Scholar]
- 37.Cicchetti P., Ridley A.J., Baltimore D. 3BP-1, an SH3 domain binding protein, has GAP activity for Rac and inhibits growth factor-induced membrane ruffling in fibroblasts. EMBO J. 1995;14:3127–3135. doi: 10.1002/j.1460-2075.1995.tb07315.x. [DOI] [PMC free article] [PubMed] [Google Scholar]
- 38.Richnau N., Aspenström P. RICH, a rho GTPase-activating protein domain-containing protein involved in signaling by Cdc42 and Rac1. J. Biol. Chem. 2001;276:35060–35070. doi: 10.1074/jbc.M103540200. [DOI] [PubMed] [Google Scholar]
- 39.Soderling S.H., Binns K.L., Scott J.D. The WRP component of the WAVE-1 complex attenuates Rac-mediated signaling. Nat. Cell Biol. 2002;4:970–975. doi: 10.1038/ncb886. [DOI] [PubMed] [Google Scholar]
- 40.Bustos R.I., Forget M.-A., Hansen S.H. Coordination of Rho and Rac GTPase function via p190B RhoGAP. Curr. Biol. 2008;18:1606–1611. doi: 10.1016/j.cub.2008.09.019. [DOI] [PMC free article] [PubMed] [Google Scholar]
- 41.Ohta Y., Hartwig J.H., Stossel T.P. FilGAP, a Rho- and ROCK-regulated GAP for Rac binds filamin A to control actin remodeling. Nat. Cell Biol. 2006;8:803–814. doi: 10.1038/ncb1437. [DOI] [PubMed] [Google Scholar]
- 42.Katoh K., Kano Y., Ookawara S. Rho-kinase dependent organization of stress fibers and focal adhesions in cultured fibroblasts. Genes to Cells. 2007;12:623–638. doi: 10.1111/j.1365-2443.2007.01073.x. [DOI] [PubMed] [Google Scholar]
- 43.Tomar A., Schlaepfer D.D. Focal adhesion kinase: switching between GAPs and GEFs in the regulation of cell motility. Curr. Opin. Cell Biol. 2009;21:676–683. doi: 10.1016/j.ceb.2009.05.006. [DOI] [PMC free article] [PubMed] [Google Scholar]
- 44.Friedland J.C., Lee M.H., Boettiger D. Mechanically activated integrin switch controls α5β1 function. Science. 2009;323:642–644. doi: 10.1126/science.1168441. [DOI] [PubMed] [Google Scholar]
- 45.Khatiwala C.B., Peyton S.R., Putnam A.J. Intrinsic mechanical properties of the extracellular matrix affect the behavior of pre-osteoblastic MC3T3-E1 cells. Am. J. Physiol. Cell Physiol. 2006;290:C1640–C1650. doi: 10.1152/ajpcell.00455.2005. [DOI] [PubMed] [Google Scholar]
- 46.Schneider I.C., Parrish E.M., Haugh J.M. Spatial analysis of 3′ phosphoinositide signaling in living fibroblasts. III. Influence of cell morphology and morphological polarity. Biophys. J. 2005;89:1420–1430. doi: 10.1529/biophysj.105.061218. [DOI] [PMC free article] [PubMed] [Google Scholar]
- 47.Tyson J.J., Keener J.P. Singular perturbation theory of traveling waves in excitable media (a review) Phys. D. 1988;32:327–361. [Google Scholar]
Associated Data
This section collects any data citations, data availability statements, or supplementary materials included in this article.