

Abstract
Objective
To examine whether high-deductible health plans (HDHPs) that exempt prescription drugs from full cost sharing preserve medication use for major chronic illness, compared with traditional HMOs with similar drug cost sharing.
Data Sources/Study Setting
We examined 2001–2008 pharmacy claims data of 3,348 continuously enrolled adults in a Massachusetts health plan for 9 months before and 24 months after an employer-mandated switch from a traditional HMO plan to a HDHP, compared with 20,534 contemporaneous matched HMO members. Both study groups faced similar three-tiered drug copayments. We calculated daily medication availability for all prescription drugs and four chronic medication classes: hypoglycemics, lipid-lowering agents, antihypertensives, and chronic obstructive pulmonary disease (COPD)/asthma controllers.
Study Design
Interrupted time-series with comparison group study design examining monthly level and trend changes in prescription drug utilization.
Principal Findings
The HDHP and control groups had comparable changes in the level and trend of all drugs after the index date; we detected similar patterns in the use of lipid-lowering agents, antihypertensives, and COPD/asthma controllers. Some evidence suggested a small relative decline in hypoglycemic use among diabetic patients in HDHPs.
Conclusions
Switching to an HDHP that included modest drug copayments did not change medication availability or reduce use of essential medications for three common chronic illnesses.
Keywords: High-deductible health plans, pharmaceutical use, chronic disease, differential cost-sharing
Employers and policy makers are increasingly turning to high-deductible health plans (HDHP) to control rising health care costs (Hilzenrath 2010). From 2006 to 2010 the percentage of employees covered by plans with at least a U.S.$1000 deductible increased from 10 percent to 27 percent (Henry J. Kaiser Family Foundation [KFF] 2010). Some analysts expect that the recently passed health insurance reform legislation will lead to an “explosion” in HDHP growth (Kerber 2010). However, the growing popularity of HDHPs has been accompanied by concern that members might underutilize necessary care due to prohibitive cost sharing (Parente, Feldman, and Christianson 2004; Dixon, Greene, and Hibbard 2008).
HDHPs require full cost sharing for most services until an annual deductible is met. In 2010, average deductibles for commercial health plans (i.e., HMO, PPO, POS, and savings option plans) with deductibles ranged from U.S.$601 to U.S.$1903 for individuals and U.S.$1321 to U.S.$3780 for families (KFF 2010). HDHPs associated with tax-advantaged Health Reimbursement Accounts (HRAs) or Health Savings Accounts (HSAs) to pay for qualifying medical expenses generally have higher deductibles than plans without spending accounts. Many HDHPs aim to encourage high-value care such as primary care visits and preventive services by excluding them from the deductible (KFF 2010). Although tax laws require that HSA-associated HDHPs fully subject drugs to the deductible, the majority of HDHPs utilize tiered drug copayment structures similar to traditional health plans (KFF 2010).
Previous research provides compelling evidence that increased cost sharing reduces health care utilization (Newhouse 1993). The landmark RAND Health Insurance Experiment of 1971–1986 found that patients facing high-level cost sharing reduced overall utilization by approximately 33 percent (Newhouse et al. 1981) and total spending by about 30 percent (Newhouse 1993). Both appropriate and inappropriate utilization decreased, including hospitalizations, outpatient visits, and preventive services (Lohr et al. 1986; Newhouse 1993). The 2007/2008 National Health Interview Survey found that adults in HDHPs had 70 percent more unmet medical or prescription drug needs than adults in traditional health insurance plans (Cohen 2010). Studies have also demonstrated that HDHPs with full cost sharing for prescription drugs alter the use of essential medications for chronic illness, including antihypertensives, statins, cardiac medications, asthma controllers, hypoglycemics, epilepsy medications, and antiulcerants (Greene et al. 2008; Nair et al. 2009; Chen, Levin, and Gartner 2010).
However, no studies have examined whether HDHPs that selectively exclude medications from full cost sharing can mitigate or prevent this reduced utilization. Such reductions could still occur if HDHP members (1) reduce contact with physicians due to cost sharing for services such as laboratory testing and radiology (providing fewer opportunities to receive prescriptions), (2) decide that overall increased levels of out-of-pocket payments for services under the deductible exceed their personal health care budget, causing reduced prescription drug purchasing, (3) are confused by complex benefit structures (Marquis 1981; Reed et al. 2009), or (4) experience “sticker shock” and subsequent decreases in generalized utilization because of a very high cost health care event such as an emergency department visit or hospitalization (Wharam et al. 2007).
We studied an HDHP that subjected prescription drugs to cost sharing levels typical of traditional health plans. We examined its impact on drugs that reduce morbidity or mortality among patients with major chronic illnesses, including diabetes, hypertension, hyperlipidemia, and chronic pulmonary disease. This research has major policy relevance because most HDHP members nationally face similar drug cost-sharing arrangements (KFF 2010).
METHODS
Study Setting
Harvard Pilgrim Health Care (HPHC) is a nonprofit insurer in New England that provides health benefits to over 1 million members. On April 1, 2002, HPHC began offering an HDHP to Massachusetts employers. Although the provider network, referral policies, and some copayment obligations are similar to HPHC's traditional HMO plans, the HDHP includes lower premiums (HPHC 2009a) and annual deductibles of U.S.$500–2000 for individuals and U.S.$1000–4000 for families (HPHC 2009b). Full coverage begins for individuals after reaching their deductible or for family members after their combined expenses reach the family deductible.
Most institutional services (e.g., emergency department visits and hospitalizations), diagnostic procedures, and treatments that are covered by the traditional plans are subject to the deductible in the HDHP. However, similar to the traditional HMO plans, modest copayments apply to most outpatient visits, including routine exams, urgent care visits, and specialist consultations (HPHC 2009b). These copayments must be paid whether or not the deductible has been met. Preventive services (e.g., immunizations, mammograms, and certain laboratory tests) have first dollar coverage (HPHC 2009b). The HDHPs also include an annual out-of-pocket maximum equal to twice the deductible amount but not <U.S.$2000 for individuals and U.S.$4000 for families (HPHC 2009b).
Employers that choose an HDHP may also opt to purchase a separate pharmacy benefit from HPHC comparable to those offered in the traditional HMO plans. The pharmacy benefits follow a three-tier design, with tier 1, 2, and 3 copayments generally ranging from U.S.$5.00 to U.S.$15.00, U.S.$10.00 to U.S.$30.00, and U.S.$25.00 to U.S.$50.00, respectively. The first tier typically includes generic drugs, the second tier includes preferred brands, while the third tier comprises the most expensive nonpreferred brands. A very small number of drugs are not covered at all. Some medications are eligible for purchase as 90-day mail order prescriptions with a slightly lower monthly copayment than retail pharmacy prescriptions. Pharmacy benefits do not include an out-of-pocket maximum (HPHC 2009b).
Study Design and Sample
We used a rigorous interrupted time-series with comparison group study design to examine level and trend changes in prescription drug utilization. Using previously established methods (Wharam et al. 2007, 2008), we created a study sample of HPHC members enrolled through Massachusetts employers that offered only a single type of HPHC insurance plan, reducing self-selection bias. We included two cohorts of interest: an HDHP and control group. The HDHP group included members who were enrolled in traditional HMO plans during a 1-year baseline period between April 1, 2001 and August 14, 2007 and who then experienced an employer-mandated switch to an HDHP (n = 16,962). We designated the date of this switch as the index date. We randomly matched each HDHP group member to eight contemporaneous HMO group members enrolled in traditional HMOs through MA employers during the same 1-year baseline period (n = 110,128). The cases and controls were also matched according to adult/child status and whether the plan was purchased through an independent broker (association plan). We assigned control members the same index date as their matched HDHP member.
From this pool we selected 3,348 HDHP members and 20,534 matched controls age 18–63 at baseline who were continuously enrolled for 12 months before and at least 24 months after the index date, and for whom we could detect prescription drug coverage in all years (see Appendix SA2). We limited our baseline period to 9 months so that we could use the preceding 3 months to assess prebaseline drug dispensing. We also selected an overlapping larger cohort of 7,090 HDHP members and 47,745 matched controls having at least 12 months of follow-up to in order to conduct sensitivity analyses described below.
For our analyses of chronic drug classes described below, we created disease-specific cohorts of HDHP members and controls with diabetes (n = 108 and n = 640, respectively), hypertension (n = 276 and n = 1672), hyperlipidemia (n = 205 and n = 1227), or chronic pulmonary disease (chronic obstructive pulmonary disease [COPD]/asthma [n = 79 and n = 564]) based on the presence of either two outpatient or one inpatient International Classification of Diseases, Ninth Revision, Clinical Modification (ICD-9) diagnoses during the baseline year. This method has been used in multiple previous studies (Wolff, Starfield, and Anderson 2002; Jha et al. 2003; Kilbourne et al. 2004; Gilmer et al. 2005; Solberg et al. 2006; Lipscombe et al. 2007). Because we defined our cohorts according to baseline health care utilization, with new diagnoses accruing during the baseline period but not after the index date, we expected an apparent increasing trend in medication utilization during baseline for both study groups that would not continue after the index date.
To determine whether there were differences in drug cost-sharing obligations over time between study groups, we calculated a weighted average of the copayment levels associated with the three drug tiers. This “mean effective copayment” for each member was slightly higher over the three study years for the HDHP group at U.S.$15.92, U.S.$18.28, and 18.55 compared with U.S.$13.42, U.S.$14.57, and U.S.$15.75 for controls, but annual increases were similar. HDHP group members faced mean outpatient visit copayments of approximately U.S.$15.35, U.S.$20.00, and U.S.$20.00 in the three study years, compared with values of U.S.$11.31, U.S.$12.41, and U.S.$13.35 among controls.
Outcome Measure
We measured drug utilization using HPHC pharmacy claims data. For members receiving dispensed medications, we calculated the daily average number of medications on hand in each monthly interval (daily medications available [DMA]) based on the reported days' supply dispensed in each pharmacy claim. For example, a member who received 30 days' supplies of metformin and glyburide on day 0 and then failed to refill both medications until day 45 would have a DMA of 2.0 in month 1 (both drugs available every day of the month) and 1.0 in month 2 (days 30–60 when only half the needed supply was available on average each day). We used the monthly DMA measure as a general indicator of intensity of utilization, because we were interested in evaluating changes in medication use over time.
We examined utilization patterns for all prescription medications, as well as four therapeutic drug classes with major morbidity and mortality benefits: hypoglycemics, antihypertensives, lipid-lowering agents, and COPD/asthma controllers (Psaty et al. 1997; Inzucchi 2002; Cholesterol Treatment Trialists' Collaborators 2005; Studer et al. 2005; Costa et al. 2006; Ho et al. 2006; Peters et al. 2006; Baguet et al. 2007; Giembycz et al. 2008). The drug classes were identified by linking the National Drug Code in each pharmacy claim to its corresponding therapeutic category according to the American Hospital Formulary Service classification system (First DataBank Inc. 2005). We focused on orally administered drugs, in addition to inhalation and subcutaneously administered COPD/asthma controllers.
The denominator for the analysis of all drug use was the entire study population, while the disease-specific cohorts made up the denominators for the analyses of chronic medication use.
Covariates
We examined the distributions of important baseline characteristics for both study groups, including age, gender, neighborhood socioeconomic and racial characteristics, health status, drug cost-sharing level, individual or family plan status (assessed at index date) (Wharam et al. 2007), association plan status, employer size (based on number of employees) (Wharam et al. 2007), proportion of medication users, and total health spending.
To derive neighborhood-based measures of socioeconomic status, we linked members' residential addresses to their 2000 U.S. Census block group, a subdivision of census tracts containing an average of 1000 individuals (U.S. Bureau of the Census 1994; Wharam et al. 2007). We created previously established categorical variables of neighborhood poverty status and education levels (Krieger et al. 2003; Wharam et al. 2007) and a composite variable for socioeconomic status (Wharam et al. 2007). We considered members to have low socioeconomic status if they lived in a census block with >10 percent of households below poverty level or 25 percent of adult household members with less than a high school education. To measure neighborhood racial characteristics, we used a dichotomous variable indicating whether a member lived in a predominately black neighborhood (≥66 percent black residents) (Wharam et al. 2008).
To assess health status, we used the aforementioned indicators of diabetes, hypertension, hyperlipidemia, and chronic pulmonary disease, as well as the Chronic Disease Score, a validated measure of morbidity constructed using members' baseline prescription drug utilization (Johnson, Hornbrook, and Nichols 1994; Clark et al. 1995; Fishman and Shay 1999; Wharam et al. 2007). We assumed that employer size, association status, and individual or family plan status were constant throughout the study (Wharam et al. 2007).
Statistical Analysis
We compared baseline characteristics by study group using t-tests and χ2-tests. To examine the changes in the level and trend of medication use for all HPHC members, we generated time series plots of the unadjusted mean DMA each month for all prescription drugs and for specific drug classes among members with diabetes, hypertension, hyperlipidemia, and chronic pulmonary disease. We also created time series plots of overall pharmaceutical spending for all prescription drugs. We tested the statistical significance of any level or trend changes using one-part generalized estimating equations (GEE) specified with the log link and Poisson variance function. We applied a first-order autoregressive working model to adjust for autocorrelation between adjacent individual monthly measurements and estimated the variance using the empirical sandwich estimator. This modeling approach is statistically valid even when a substantial fraction of members do not use medications (Buntin and Zaslavsky, 2004). Moreover, we focused on changes in the extent of medication use because we found no significant differential changes between study groups in the odds of having any medication from the baseline to the first follow-up year (see Appendix SA2).
The analytic model produced availability rate ratios (ARRs) using the monthly mean DMA. The primary independent variables in our analysis were time, indicating the time in months from the start of the baseline period through the follow-up period, intervention, denoting whether a given month was before or after the index date, and time after intervention, indicating the time in months after the index date. Thus, the exponentiated coefficient, exp(β), for time indicated the baseline trend of DMA of the control group (the ratio of two adjacent monthly availability rates); exp(β) for intervention indicated a level change (an ARR) in DMA immediately after the index date compared with the prior month for the control group; exp(β) for time after intervention indicated a trend change (an ARR) in DMA after the index date compared with the baseline trend for the control group. To calculate the differential changes in the level and trend of drug use between the study groups, we examined interactions between the study groups and primary independent variables, above, to estimate the ratio of ARRs after controlling for the key covariates (a differential reduction was indicated by a ratio of ARRs<1.0).
We adjusted for age, gender, individual, or family plan status, association status, employer size, neighborhood socioeconomic status, whether member lives in a predominately black neighborhood, and drug cost-sharing changes. Members could experience small increases in drug cost sharing at the annual “anniversary” date when employers can change benefit packages. We controlled for the possible impact of these increases by including terms in the model for secondary level and trend changes at the first month of the second follow-up year. These secondary effects estimate the impact of increased drug cost sharing on use after the first year of follow-up; we also used them to estimate the possible confounding effect of increased drug cost sharing at the index date that occurred simultaneously with the HDHP switch.
We tested the sensitivity of our results by running identical GEE models on the larger cohort of members who were continuously enrolled for at least 1 year, thus including in the analysis members who discontinued coverage at any time during the second follow-up year.
Due to the small sample sizes within the disease-specific cohorts, we used aggregate segmented time-series analysis as an additional analytic method to test for differential trend changes in medication use in these cohorts. When sample sizes are small, time-series models can be more efficient in detecting intervention effects than regression models that include individual-level covariates and interaction terms. We calculated the difference in the monthly mean DMA between the study groups and displayed these unadjusted differenced means on the plot with the unadjusted mean values. This analytic method provides a visual representation of relative changes in the medication use trend after the index date while controlling for secular changes. We fitted time-series models that controlled for baseline trend to estimate the statistical significance of any trend changes in the differenced means after the index date. An unchanged trend or slope after the index date would indicate no effect of the HDHP switch. To achieve greater efficiency we eliminated the level change predictor, which was very small in magnitude and statistically nonsignificant.
All analyses were conducted using SAS version 9.2 (SAS Institute, Cary, NC, USA) and we specified an a priori statistical significance level of p<0.05.
RESULTS
Baseline Characteristics of Cohort Members
We found small differences in baseline demographic and health characteristics between the two study groups (Table 1). Members in the HDHP and control groups had similar mean ages (44.9 and 44.2, respectively, p<0.01) and were evenly divided by gender. Study group members lived in neighborhoods with similar poverty and education levels. HDHP group members had a slightly lower mean Chronic Disease Score, but the prevalence of diabetes, hypertension, hyperlipidemia, and chronic pulmonary disease was comparable. Fewer members of the HDHP group were in family plans (62.4 percent versus 70.2 percent in the control group, p<0.001) and more were employed by small firms. The majority of members in the HDHP and control groups used a prescription drug during baseline (61.2 percent and 63.4 percent, respectively, p = 0.02). The proportion of users in the disease-specific cohorts ranged from 44.5 percent to 87.0 percent (see Appendix SA2). Mean health spending during the baseline year was lower among HDHP members compared with controls (U.S.$3672.90 versus U.S.$4420.60, p<0.001).
Table 1.
Baseline Characteristics
| HDHP Group | Control Group | ||||
|---|---|---|---|---|---|
| Characteristic | (n = 3,348) | (n = 20,534) | p value | ||
| Mean age on index date, years (SD) | 44.9 | (11.0) | 44.2 | (10.7) | <0.01 |
| Female, n (%) | 1762 | (52.6) | 10927 | (53.2) | 0.529 |
| Plan type, n (%) | |||||
| In family plan | 2088 | (62.4) | 14421 | (70.2) | <0.001 |
| In association plan | 1074 | (32.1) | 8570 | (41.7) | <0.001 |
| Employer size, n (%) | |||||
| Small (2–50 employees) | 2175 | (65.0) | 11213 | (54.6) | <0.001 |
| Mid (51–250 employees) | 931 | (27.8) | 1087 | (5.3) | |
| Large (251–999 employees) | 186 | (5.6) | 2294 | (11.2) | |
| ≥1000 | 56 | (1.7) | 5940 | (28.9) | |
| Neighborhood, n (%) | |||||
| Residents below poverty level | |||||
| <5% | 1865 | (55.7) | 12533 | (61.0) | <0.001 |
| 5–9.9% | 831 | (24.8) | 4830 | (23.5) | |
| 10–19.9% | 502 | (15.0) | 2319 | (11.3) | |
| ≥20% | 150 | (4.5) | 852 | (4.2) | |
| Residents with less than high school education | |||||
| <15% | 2565 | (76.6) | 16194 | (78.9) | <0.01 |
| 15–24.9% | 541 | (16.2) | 2859 | (13.9) | |
| 25–39.9% | 181 | (5.4) | 1172 | (5.7) | |
| ≥40% | 61 | (1.8) | 309 | (1.5) | |
| More than 66% black residents | 10 | (0.3) | 182 | (0.9) | <0.001 |
| Chronic disease score | |||||
| Mean (SD) | 1250.9 | (1295.6) | 1360.2 | (1668.5) | <0.001 |
| 25th percentile (healthiest) | 520.1 | 520.1 | |||
| Median | 895.9 | 895.9 | |||
| 75th percentile | 1575.8 | 1607.4 | |||
| Health condition, n (%) | |||||
| Diabetes | 108 | (3.2) | 640 | (3.1) | 0.737 |
| Hypertension | 276 | (8.2) | 1672 | (8.1) | 0.843 |
| Hyperlipidemia* | 205 | (6.1) | 1227 | (6.0) | 0.739 |
| Chronic pulmonary disease† | 79 | (2.4) | 564 | (2.7) | 0.200 |
| Proportion with prescription drug use, n (%) | 2050 | (61.2) | 13016 | (63.4) | 0.017 |
| Mean total health care expenditures, U.S.$ (SD) | 3672.90 | (10107.06) | 4420.60 | (15130.15) | <0.001 |
| Mean effective copayment for drugs, U.S.$ (SD) | 15.92 | (3.1) | 13.42 | (3.7) | <0.001 |
Association plans are sold through independent brokers.
Hyperlipidemia subgroup comprises members with diagnoses of hyperlipidemia, coronary artery disease, and peripheral vascular disease.
Chronic pulmonary disease subgroup comprises members with diagnoses of asthma and chronic obstructive pulmonary disease.
HDHP, high-deductible health plan.
Time Series of Medication Use and Spending
Figure 1 shows the time series of the actual and differenced mean DMA for all prescription drugs among all study members. Overall, both groups experienced a gradual increase in mean DMA over the three study years, with the average level of medication use slightly lower for the HDHP group throughout the study period. The HDHP group demonstrated a similar trend in mean DMA after the index date in comparison to the control group. The time series of overall prescription drug spending showed comparable increasing trends for both study groups (Figure 2).
Figure 1.
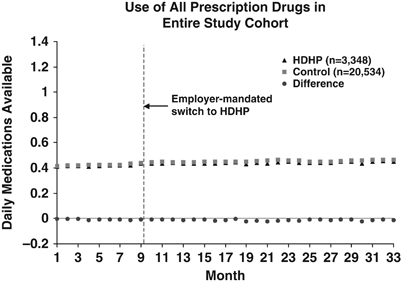
Times Series Plot Showing the Trends in Actual and Differenced Mean DMA for All Prescription Drugs. DMA, Daily Medications Available; HDHP, High-Deductible Health Plans
Figure 2.
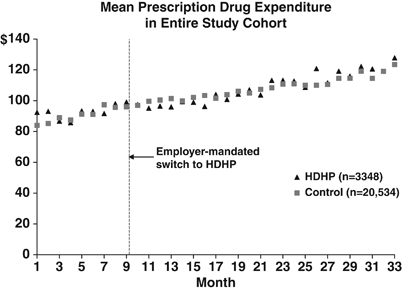
Times Series Plot Showing the Trends in Pharmaceutical Spending for All Prescription Drugs. HDHP, High-Deductible Health Plans
The time series for the four therapeutic drug classes among members with chronic illness are shown in Figure 3. Relative to the controls, the HDHP group had greater average use of hypoglycemics, lipid-lowering agents, and COPD/asthma controllers and lower use of antihypertensives throughout the study period. For all four chronic illness groups, the mean drug class-specific DMA of the HDHP and control groups increased gradually during the baseline year as an increasing number of cohort members acquired the target diagnoses. For each drug class, there were no immediate changes in the mean DMA level from the month before to immediately after the index date. During the two follow-up years, the HDHP and control chronic illness subgroups experienced comparable trends in mean DMA for antihypertensives, lipid lowering agents, and COPD/asthma controllers. HDHP members with diabetes appeared to experience somewhat smaller increases in mean DMA for hypoglycemics than control members.
Figure 3.
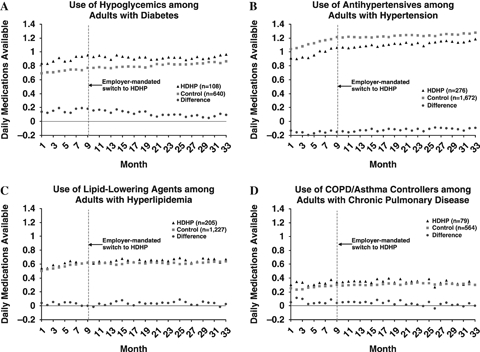
Times Series Plots Showing the Trends in Actual and Differenced Mean DMA for (A) Hypoglycemics, (B) Antihypertensives, (C) Lipid-Lowering Agents, and (D) COPD/Asthma Controllers. COPD, Chronic Obstructive Pulmonary Disease; DMA, Daily Medications Available; HDHP, High-Deductible Health Plans
Adjusted Change in Medication Use with GEE Model
Table 2 shows the results from the adjusted GEE model using the ratio of ARRs. Compared with baseline, both groups showed statistically equivalent changes in DMA level and trend for all drug categories after the index date (ratio of ARRs between study groups ranged from 0.97 to 1.05; p = 0.14–0.94). A sensitivity analysis of medication use among the 1-year continuously enrolled cohorts, in which sample sizes were approximately doubled, revealed nearly identical results.
Table 2.
Effect of High-Deductible Health Plan Switch on Medication Use
| Generalized Estimating Equations Model | Segmented Time-Series Regression Model | |||
|---|---|---|---|---|
| Change Parameter | Ratio of Change in Mean DMA after Switch versus Control Group (ratio of ARRs)* | p-value | Slope Change in Differenced DMA Means after Switch (β)† | p-value |
| All prescription drugs (n = 23,882) | ||||
| Level change after switch | 1.00 | 0.877 | — | |
| Trend change after switch | 1.00 | 0.469 | 0.001 | 0.209 |
| Hypoglycemics (n = 748)‡ | ||||
| Level change after switch | 0.98 | 0.682 | — | |
| Trend change after switch | 0.99 | 0.166 | -0.007 | <0.01 |
| Antihypertensives (n = 1,948) | ||||
| Level change after switch | 1.01 | 0.783 | — | |
| Trend change after switch | 1.00 | 0.705 | 0.000 | 0.984 |
| Lipid-lowering agents (n = 1,432) | ||||
| Level change after switch | 0.97 | 0.489 | — | |
| Trend change after switch | 1.01 | 0.138 | 0.002 | 0.528 |
| COPD/asthma controllers (n = 643) | ||||
| Level change after switch | 1.05 | 0.684 | — | |
| Trend change after switch | 1.00 | 0.944 | -0.001 | 0.837 |
Ratio of ARRs = ratio of availability rate ratios. Generalized estimating equations models adjusted for baseline trend, changes in level and trend, age, sex, individual versus family plan type, association status, employer size, socioeconomic status, whether member lives in a predominately black neighborhood, and changes in drug cost-sharing after the first follow-up year.
Segmented time-series regression models adjusted for baseline trend and changes in trend; we eliminated the level change predictor due to its very small magnitude and statistical nonsignificance.
Denominator for each drug subcategory comprises a disease-specific cohort: members with diabetes, hypertension, hyperlipidemia, or chronic pulmonary disease, respectively.
COPD, chronic obstructive pulmonary disease; DMA, daily medications available.
In most cases, small drug cost sharing increases after the first follow-up year were not associated with changes in medication use; the control group experienced a very small decrease in trend for COPD/asthma controllers (ARR = 0.99; p = 0.03, data not shown), although this trend reduction was not statistically different from the constant trend for the HDHP group.
Aggregate Change in Medication Use with Segmented Time-Series Regression Model
Our findings using the alternate segmented time-series regression method (Table 2) also suggest that the HDHP and control groups experienced similar trend changes for all prescription drugs, antihypertensives, lipid-lowering agents, and COPD/asthma controllers (p = 0.21–0.98). However, the trend reduction in hypoglycemic use was slightly greater for the HDHP group compared with the control group (slope change = −0.007; p<0.01). To put this result in context, after 2 years of follow-up, HDHP diabetic patients used 77 percent of hypothesized medications according to their baseline trend (0.92 DMA/1.20 DMA), compared with 90 percent for the controls (0.86 DMA/0.95 DMA).
DISCUSSION
HDHPs seek to contain escalating health insurance premiums by shifting the burden of health care costs to employees. These arrangements often exclude certain services from the deductible to preserve beneficial utilization, and the majority exempt prescription drugs. Our study is the first to our knowledge to examine the impact of this design feature on medication use.
In general, we found that this strategy was effective. Members who experienced an employer-mandated switch to a HDHP had nearly identical patterns of medication use as members who remained in a traditional HMO. The trend in overall prescription drug spending was also similar between the study groups.
We found inconsistent evidence that patients with diabetes who shifted to HDHPs may have experienced small relative decreases in hypoglycemic use. This result was statistically significant in the segmented time-series regression model but not in the adjusted GEE model, possibly due to insufficient statistical power. If true, the small selective effect on hypoglycemic use could be explained by the relatively more complex and costly nature of diabetes care or the use of nonpharmacologic methods to control the disease. When faced with increased cost sharing for tests or treatments for their diabetes and other health conditions, diabetes patients may be more inclined to reduce medication use to lower out-of-pocket health care expenses.
Related studies on the relationship between HDHPs and medication use have focused primarily on arrangements that require full cost sharing for drugs up to the annual deductible level. Although results are mixed, these studies show evidence of reductions in drug use (Dixon, Greene, and Hibbard 2008; Greene et al. 2008; Parente, Feldman, and Chen 2008; Nair et al. 2009; Chen, Levin, and Gartner 2010). For example, members in HDHP plans with full drug cost sharing fill fewer prescriptions overall (Nair et al. 2009) and for chronic conditions (Parente, Feldman, and Chen 2008) than members in traditional managed care plans. Such HDHPs are also associated with discontinuation of drugs to treat high cholesterol (Greene et al. 2008; Chen, Levin, and Gartner 2010), epilepsy (Chen, Levin, and Gartner 2010), and hypertension (Greene et al. 2008). These plans have also been linked to lower medication adherence for asthma (Nair et al. 2009; Chen, Levin, and Gartner 2010), heart conditions (Chen, Levin, and Gartner 2010), high cholesterol (Nair et al. 2009; Chen, Levin, and Gartner 2010), diabetes (Nair et al. 2009), gastroesophageal reflux (Nair et al. 2009), and hypertension (Nair et al. 2009). These findings are noteworthy because studies outside the HDHP literature have found that reduced medication adherence among diabetes patients is associated with increased hospitalization and all-cause mortality (Ho et al. 2006).
Our findings demonstrate that drug utilization is largely sustained following a switch to HDHP coverage when enrollees receive standard tiered copayment pharmacy benefit packages. These results address concerns that generalized cost sharing increases under HDHPs could have indirect effects, reducing use of medications excluded from the deductible. To this end, our results add to the current evidence base that suggests that carefully designed HDHPs can effectively preserve the use of essential health services (Busch et al. 2006; Rowe et al. 2008; Wharam et al. 2008). However, vulnerable populations may be at greater risk for cost-related underuse of essential medications even when exempted from an annual deductible. Larger studies among such populations are urgently needed. Future studies should also examine whether “value-based” health plan design features such as excluding outpatient visits from deductibles contribute to the preservation of prescription drug use.
Our study has several limitations. First, despite our strong study design and analytic approach, there may be residual confounding in our adjusted or aggregate analyses due to unobserved changes in study group characteristics at the index date. This might occur, for example, if there was selective dropout from insurance coverage among employees whose employers opted for HDHP coverage versus those whose employers chose to remain in traditional plans. Because we required continuous enrollment before and after the coverage transition, our results reflect utilization only among those who maintained insurance coverage. Second, we could not calculate the exact impact of drug cost-sharing increases at the index date; however, we found a negligible effect of the small drug copayment increases after the first follow-up year. Thus, we assume a similar negligible effect at the index date. Third, our method for detecting members with drug coverage could have led to underestimates, but not differentially by study group. Fourth, our study was not designed to assess changes in drug utilization among patients who were newly diagnosed in the follow-up year; therefore, we may have underestimated the impact of the HDHP on chronically ill members who were not yet diagnosed at the time of the plan switch. Fifth, a very small number of members (6 HDHP and 16 control members) turned 65 years of age before the end of the study and were therefore eligible to receive Medicare benefits. Finally, we studied HDHPs with somewhat lower deductibles on average compared with typical HRA or HSA-HDHPs that include medicines under the deductible. Nevertheless, plans similar to the HDHPs we studied remain more common (KFF 2010).
This research has two important policy implications. HDHPs with modest drug cost sharing may be a viable policy option for preserving overall use of medications while more broadly controlling costs. Our study provides an evidence base for policy makers and employers considering this option. Second, our research shows that carefully designed HDHPs can preserve the use of several chronic medication classes that are essential in managing diseases causing a high degree of morbidity and mortality. However, there may be illness-specific exceptions to this finding, such as diseases that are severe and costly.
In conclusion, switching to an HDHP insurance plan that included modest, tiered copayments for medications did not change overall prescription drug dispensing or reduce the use of essential medications for three common chronic illnesses. Future studies should examine the impact of HDHPs on medication use for diabetes patients and other vulnerable populations to ensure that essential care is maintained. As HDHP growth accelerates, employers and policy makers should strongly consider adopting standard pharmacy benefit packages outside of the deductible to preserve essential medication use.
Acknowledgments
Joint Acknowledgment/Disclosure Statement: This research was supported by a faculty grant funded by the HPHC Foundation. The funding source had no role in the design and conduct of the study; in the collection, management, analysis, and interpretation of the data; or in the preparation, review, and approval of the manuscript.
The authors are grateful to Ms. Irina Miroshnik and Ms. Amy Johnson Graves, both of the Harvard Medical School and HPHC Institute Department of Population Medicine, for their assistance in data collection and programming support, respectively. We also thank Dr. David Cochran, formerly HPHC's senior vice president of strategic development, and many others at HPHC for providing access to data and technical support. Ms. Sheila Reiss also received support from the Harvard University Ph.D. Program in Health Policy and the Harvard Medical School Fellowship in Pharmaceutical Policy Research.
Disclosures: None.
Disclaimers: None.
Supporting Information
Additional supporting information may be found in the online version of this article:
Appendix SA1: Author Matrix.
Appendix SA2: Technical Appendix.
Please note: Wiley-Blackwell is not responsible for the content or functionality of any supporting materials supplied by the authors. Any queries (other than missing material) should be directed to the corresponding author for the article.
REFERENCES
- Baguet JP, Legallicier B, Auquier P, Robitail S. Updated Meta-Analytical Approach to the Efficacy of Antihypertensive Drugs in Reducing Blood Pressure. Clinical Drug Investigation. 2007;27:735–253. doi: 10.2165/00044011-200727110-00001. [DOI] [PubMed] [Google Scholar]
- Buntin MB, Zaslavsky AM. Too Much Ado about Two-Part Models and Transformation? Comparing Methods of Modeling Medicare Expenditures. Journal of Health Economics. 2004;23((3)):525–42. doi: 10.1016/j.jhealeco.2003.10.005. [DOI] [PubMed] [Google Scholar]
- Busch SH, Barry CL, Vegso SJ, Sindelar JL, Cullen MR. Effects of a Cost-Sharing Exemption on Use of Preventive Services at One Large Employer. Health Affairs. 2006;25:1529–36. doi: 10.1377/hlthaff.25.6.1529. [DOI] [PubMed] [Google Scholar]
- Chen S, Levin R, Gartner J. Medication Adherence and Enrollment in a Consumer-Driven Health Plan. American Journal of Managed Care. 2010;16:e43–50. [PubMed] [Google Scholar]
- Cholesterol Treatment Trialists' Collaborators. Efficacy and Safety of Cholesterol-Lowering Treatment: Prospective Meta-Analysis of Data from 90,056 Participants in 14 Randomised Trials of Statins. Lancet. 2005;366:1267–78. doi: 10.1016/S0140-6736(05)67394-1. [DOI] [PubMed] [Google Scholar]
- Clark DO, Von Korff M, Saunders K, Baluch WM, Simon GE. A Chronic Disease Score with Empirically Derived Weights. Medical Care. 1995;33:783–95. doi: 10.1097/00005650-199508000-00004. [DOI] [PubMed] [Google Scholar]
- Cohen RA. 2010. “NCHS Data Brief: Impact of Type of Insurance Plan on Access and Utilization of Health Care Services for Adults Aged 18-64 Years with Private Health Insurance: United States, 2007–2008.” Centers for Disease Control and Prevention [accessed on March 23, 2010]. Available at http://www.cdc.gov/nchs/data/databriefs/db28.htm.
- Costa J, Borges M, David C, Vaz Carneiro A. Efficacy of Lipid Lowering Drug Treatment for Diabetic and Non-Diabetic Patients: Meta-Analysis of Randomised Controlled Trials. British Medical Journal. 2006;332:1115–24. doi: 10.1136/bmj.38793.468449.AE. [DOI] [PMC free article] [PubMed] [Google Scholar]
- Dixon A, Greene J, Hibbard J. Do Consumer-Directed Health Plans Drive Change in Enrollees' Health Care Behavior? Health Affairs. 2008;27:1120–31. doi: 10.1377/hlthaff.27.4.1120. [DOI] [PubMed] [Google Scholar]
- First DataBank Inc. National Drug Data File (NDDF) Plus Documentation. San Bruno, CA: The Hearst Corporation; 2005. [Google Scholar]
- Fishman PA, Shay DK. Development and Estimation of a Pediatric Chronic Disease Score Using Automated Pharmacy Data. Medical Care. 1999;37:874–83. doi: 10.1097/00005650-199909000-00004. [DOI] [PubMed] [Google Scholar]
- Giembycz MA, Kaur M, Leigh R, Newton R. A Holy Grail of Asthma Management: Toward Understanding How Long-Acting Beta(2)-Adrenoceptor Agonists Enhance the Clinical Efficacy of Inhaled Corticosteroids. British Journal of Pharmacology. 2008;153:1090–104. doi: 10.1038/sj.bjp.0707627. [DOI] [PMC free article] [PubMed] [Google Scholar]
- Gilmer TP, O'Connor PJ, Rush WA, Crain AL, Whitebird RR, Hanson AM, Solberg LI. Predictors of Health Care Costs in Adults with Diabetes. Diabetes Care. 2005;28:59–64. doi: 10.2337/diacare.28.1.59. [DOI] [PubMed] [Google Scholar]
- Greene J, Hibbard J, Murray JF, Teutsch SM, Berger ML. The Impact of Consumer-Directed Health Plans on Prescription Drug Use. Health Affairs. 2008;27:1111–9. doi: 10.1377/hlthaff.27.4.1111. [DOI] [PubMed] [Google Scholar]
- Harvard Pilgrim Health Care (HPHC) 2009a. “Best Buy Plans.” Harvard Pilgrim Health Care website [accessed February 17, 2010]. Available at https://www.harvardpilgrim.org/portal/page?_pageid = 213,54804&_dad = portal&_schema = PORTAL.
- Harvard Pilgrim Health Care (HPHC) 2009b. “Schedules or Summaries of Benefits: Best Buy HMO 500/1000/1500/2000.” Harvard Pilgrim Health Care website [accessed February 17, 2010]. Available at https://www.harvardpilgrim.org/portal/page?_pageid = 848,170114&_dad = portal&_schema = PORTAL.
- Henry J. Kaiser Family Foundation (KFF) Employer Health Benefits 2010 Annual Survey. Henry J. Kaiser Family Foundation and Health Research & Educational Trust: Menlo Park, CA; 2010. [Google Scholar]
- Hilzenrath DS. 2010. “Employers Plan to Shift More Health-Care Costs to Workers, Survey Reports.”The Washington Post [accessed March 15, 2010]. Available at http://www.washingtonpost.com/wp-dyn/content/article/2010/03/11/AR2010031100740.html?referrer=emailarticle.
- Ho PM, Rumsfeld JS, Masoudi FA, McClure DL, Plomondon ME, Steiner JF, Magid DJ. Effect of Medication Nonadherence on Hospitalization and Mortality among Patients with Diabetes Mellitus. Archives of Internal Medicine. 2006;166:1836–41. doi: 10.1001/archinte.166.17.1836. [DOI] [PubMed] [Google Scholar]
- Inzucchi SE. Oral Antihyperglycemic Therapy for Type 2 Diabetes: Scientific Review. Journal of the American Medical Association. 2002;287:360–72. doi: 10.1001/jama.287.3.360. [DOI] [PubMed] [Google Scholar]
- Jha AK, Perlin JB, Kizer KW, Dudley RA. Effect of the Transformation of the Veterans Affairs Health Care System on the Quality of Care. New England Journal of Medicine. 2003;348:2218–27. doi: 10.1056/NEJMsa021899. [DOI] [PubMed] [Google Scholar]
- Johnson RE, Hornbrook MC, Nichols GA. Replicating the Chronic Disease Score (CDS) from Automated Pharmacy Data. Journal of Clinical Epidemiology. 1994;47:1191–9. doi: 10.1016/0895-4356(94)90106-6. [DOI] [PubMed] [Google Scholar]
- Kerber R. 2010. “Advocates See Growth for Health Savings Accounts.”Reuters: U.S. Edition [accessed May 5, 2010]. Available at http://www.reuters.com/article/idUSTRE62M4AY20100323.
- Kilbourne AM, Cornelius JR, Han X, Pincus HA, Shad M, Salloum I, Conigliaro J, Haas GL. Burden of General Medical Conditions among Individuals with Bipolar Disorder. Bipolar Disorders. 2004;6:368–73. doi: 10.1111/j.1399-5618.2004.00138.x. [DOI] [PubMed] [Google Scholar]
- Krieger N, Chen JT, Waterman PD, Rehkopf DH, Subramanian SV. Race/Ethnicity, Gender, and Monitoring Socioeconomic Gradients in Health: A Comparison of Area-Based Socioeconomic Measures—The Public Health Disparities Geocoding Project. American Journal of Public Health. 2003;93:1655–71. doi: 10.2105/ajph.93.10.1655. [DOI] [PMC free article] [PubMed] [Google Scholar]
- Lipscombe LL, Jamal SA, Booth GL, Hawker GA. The Risk of Hip Fractures in Older Individuals with Diabetes. Diabetes Care. 2007;30:835–41. doi: 10.2337/dc06-1851. [DOI] [PubMed] [Google Scholar]
- Lohr KN, Brook RH, Kamberg CJ, Goldberg GA, Leibowitz A, Keesey J, Reboussin D, Newhouse JP. Use of Medical Care in the Rand Health Insurance Experiment: Diagnosis- and Service-Specific Analyses in a Randomized Controlled Trial. Medical Care. 1986;24:S1–S87. [PubMed] [Google Scholar]
- Marquis MS. Consumers' Knowledge about Their Health Insurance Coverage. Santa Monica: The Rand Corporation; 1981. Available at https://www.rand.org/pubs/reports/2007/R2753.pdf. [PMC free article] [PubMed] [Google Scholar]
- Nair K, Park J, Wolfe P, Saseen J, Read Allen R, Ganguly R. Consumer-Driven Health Plans: Impact on Utilization and Expenditures for Chronic Disease Sufferers. Journal of Occupational and Environmental Medicine. 2009;51:594–602. doi: 10.1097/JOM.0b013e31819b8c1c. [DOI] [PubMed] [Google Scholar]
- Newhouse JP. Free For All? Lessons from the RAND Health Insurance Experiment. Cambridge, MA: Harvard University Press; 1993. [Google Scholar]
- Newhouse JP, Manning WG, Morris CN, Orr LL, Duan N, Keeler EB, Leibowitz A, Marquis KH, Marquis MS, Phelps CE, Brook RH. Some Interim Results from a Controlled Trial of Cost Sharing in Health Insurance. New England Journal of Medicine. 1981;305:1501–7. doi: 10.1056/NEJM198112173052504. [DOI] [PubMed] [Google Scholar]
- Parente ST, Feldman R, Chen S. Effects of a Consumer Driven Health Plan on Pharmaceutical Spending and Utilization. Health Services Research. 2008;43:1542–56. doi: 10.1111/j.1475-6773.2008.00857.x. [DOI] [PMC free article] [PubMed] [Google Scholar]
- Parente ST, Feldman R, Christianson JB. Evaluation of the Effect of a Consumer-Driven Health Plan on Medical Care Expenditures and Utilization. Health Services Research. 2004;39:1189–20. doi: 10.1111/j.1475-6773.2004.00282.x. [DOI] [PMC free article] [PubMed] [Google Scholar]
- Peters SP, Ferguson G, Deniz Y, Reisner C. Uncontrolled Asthma: A Review of the Prevalence, Disease Burden and Options for Treatment. Respiratory Medicine. 2006;100:1139–51. doi: 10.1016/j.rmed.2006.03.031. [DOI] [PubMed] [Google Scholar]
- Psaty BM, Smith NL, Siscovick DS, Koepsell TD, Weiss NS, Heckbert SR, Lemaitre RN, Wagner EH, Furbert CD. Health Outcomes Associated with Antihypertensive Therapies Used as First-Line Agents: A Systematic Review and Meta-Analysis. Journal of the American Medical Association. 1997;277:739–45. [PubMed] [Google Scholar]
- Reed M, Fung V, Price M, Brand R, Benedetti N, Derose SF, Newhouse JP, Hsu J. High-Deductible Health Insurance Plans: Efforts to Sharpen a Blunt Instrument. Health Affairs. 2009;28:1145–54. doi: 10.1377/hlthaff.28.4.1145. [DOI] [PubMed] [Google Scholar]
- Rowe JW, Brown-Stevenson T, Downey RL, Newhouse JP. The Effect of Consumer-Directed Health Plans on the Use of Preventive And Chronic Illness Services. Health Affairs. 2008;27:113–20. doi: 10.1377/hlthaff.27.1.113. [DOI] [PubMed] [Google Scholar]
- Solberg LI, Engebretson KI, Sperl-Hillen JM, Hroscikoski MC, O'Connor PJ. Are Claims Data Accurate Enough to Identify Patients for Performance Measures or Quality Improvement? The Case of Diabetes, Heart Disease, and Depression. American Journal of Medical Quality. 2006;21:238–45. doi: 10.1177/1062860606288243. [DOI] [PubMed] [Google Scholar]
- Studer M, Briel M, Leimenstoll B, Glass TR, Bucher HC. Effect of Different Antilipidemic Agents and Diets on Mortality: A Systematic Review. Archives of Internal Medicine. 2005;165:725–30. doi: 10.1001/archinte.165.7.725. [DOI] [PubMed] [Google Scholar]
- U.S. Bureau of the Census. Geographical Areas Reference Manual. Washington, DC: U.S. Bureau of the Census; 1994. Available at http://www.census.gov/geo/www/garm.html. [Google Scholar]
- Wharam JF, Galbraith AA, Kleinman KP, Soumerai SB, Ross-Degnan D, Landon BE. Cancer Screening before and after Switching to a High-Deductible Health Plan. Annals of Internal Medicine. 2008;148:647–55. doi: 10.7326/0003-4819-148-9-200805060-00004. [DOI] [PubMed] [Google Scholar]
- Wharam JF, Landon BE, Galbraith AA, Kleinman KP, Soumerai SB, Ross-Degnan D. Emergency Department Use and Subsequent Hospitalizations among Members of a High-Deductible Health Plan. Journal of the American Medical Association. 2007;297:1093–102. doi: 10.1001/jama.297.10.1093. [DOI] [PubMed] [Google Scholar]
- Wolff JL, Starfield B, Anderson G. Prevalence, Expenditures, and Complications of Multiple Chronic Conditions in the Elderly. Archives of Internal Medicine. 2002;162:2269–76. doi: 10.1001/archinte.162.20.2269. [DOI] [PubMed] [Google Scholar]
Associated Data
This section collects any data citations, data availability statements, or supplementary materials included in this article.