

Abstract
Objectives
To determine the impact of unit-level nurse staffing on quality of discharge teaching, patient perception of discharge readiness, and postdischarge readmission and emergency department (ED) visits, and cost-benefit of adjustments to unit nurse staffing.
Data Sources
Patient questionnaires, electronic medical records, and administrative data for 1,892 medical–surgical patients from 16 nursing units within four acute care hospitals between January and July 2008.
Design
Nested panel data with hospital and unit-level fixed effects and patient and unit-level control variables.
Data Collection/Extraction
Registered nurse (RN) staffing was recorded monthly in hours-per-patient-day. Patient questionnaires were completed before discharge. Thirty-day readmission and ED use with reimbursement data were obtained by cross-hospital electronic searches.
Principal Findings
Higher RN nonovertime staffing decreased odds of readmission (OR = 0.56); higher RN overtime staffing increased odds of ED visit (OR = 1.70). RN nonovertime staffing reduced ED visits indirectly, via a sequential path through discharge teaching quality and discharge readiness. Cost analysis projected total savings from 1 SD increase in RN nonovertime staffing and decrease in RN overtime of U.S.$11.64 million and U.S.$544,000 annually for the 16 study units.
Conclusions
Postdischarge utilization costs could potentially be reduced by investment in nursing care hours to better prepare patients before hospital discharge.
Keywords: Hospital discharge, discharge readiness, readmission, emergency department utilization, cost
Readmission and emergency department (ED) use within the first 30 days following hospital discharge represent adverse, potentially avoidable, and costly outcomes of hospitalization (Friedman and Basu 2004; Goldfield et al. 2008; Jencks, Williams, and Coleman 2009). The aims of this study were to determine the following: (1) the direct effect of nursing unit staffing structure onpostdischarge utilization of readmissions and ED visits within 30 days; (2) the indirect effect through its influence on the quality of discharge teaching and patient's perception of readiness for discharge; and (3) the cost-benefit of adjustments to unit-level nurse staffing on postdischarge utilization.
BACKGROUND
One in five Medicare patients was readmitted within 30 days after hospital discharge in 2003–2004. Ninety percent of these readmissions were unplanned. The cost of readmission has been estimated to exceed U.S.$17 billion annually (Jencks, Williams, and Coleman 2009). Approximately 6.8 percent of patients discharged from hospitals in 2005–2006 visited EDs within 7 days, of which 31 percent were readmitted (Burt, McCaig, and Simon 2008).
Little is known about the relationship between nurse staffing during hospitalization and postdischarge outcomes. However, there is a growing evidence base supporting the relationship between nurse staffing structure and within-hospitalization patient outcomes, primarily using staffing data aggregated to the hospital level (Aiken et al. 2002, 2003; Needleman et al. 2002; Cho et al. 2003; Seago, Williamson, and Atwood 2006; Kane et al. 2007). Two studies of unit-level nurse staffing have found associations of nurse experience with inpatient medication errors (Blegen, Vaughn, and Goode 2001) and mortality (Van den Heede et al. 2009). Lower unit nurse staffing have been associated with higher inpatient care costs (Titler et al. 2005, 2007).
This study expands existing evidence by linking nurse staffing to postdischarge utilization. Unlike earlier studies that linked nurse staffing directly to patient outcomes in a reduced-form approach, this study estimates a structural model, based on Donabedian's (1966) quality model, that includes a core nursing process (discharge teaching) as an explanatory link between unit staffing structure and patient outcomes at discharge (readiness for discharge) and beyond hospitalization (readmissions and ED visits within 30 days).
Poor discharge preparation contributes to readmissions to the hospital (Mistiaen, Francke, and Poot 2007; Jack et al. 2009). Patients and their family caregivers often perceive they are not adequately prepared for discharge and attribute postdischarge problems to their unmet informational needs (Mamon et al. 1992; Reiley et al. 1996; Driscoll 2000; Henderson and Zernike 2001). Quality of discharge teaching provided by nurses has been associated with patient perception of discharge readiness (Weiss et al. 2007) and both have been associated with readmission (Koelling et al. 2005; Weiss et al. 2007). While reasons for readmission are multifactorial and influenced by complex and interacting comorbidities (Anderson et al. 2006; Strunin, Stone, and Jack 2007), many readmissions within 30 days are viewed as preventable and considered failures of discharge processes (Goldfield et al. 2008; Minott 2008).
Current efforts to improve hospital discharge are focused on establishing evidence-based physician and health team practices using discharge transition models that include discharge advocates (Greenwald, Denham, and Jack 2007; Jack et al. 2009), transition coaches (Coleman et al. 2008), advanced practice nurses (Naylor et al. 1999), and community-based services (Grimmer, Moss, and Falco 2004; Center for Allied Health Evidence 2010) to assist with care coordination, negotiating the complexities of the health system, and surveillance. These models have demonstrated promising results in terms of reductions in adverse outcomes, postdischarge utilization, and associated costs in elderly patients and others at high risk for readmission. In many hospitals, however, the staff nurse, the focus of this study, is the front-line interface with patients and has responsibility for discharge teaching and other discharge preparation processes (Nosbusch, Weiss, and Bobay 2011).
Meleis' Transitions Theory (2000) provides additional insights for conceptualizing the discharge process and its outcomes. The nature of the transition (type, pattern, properties), the conditions that facilitate or inhibit the person's transitional journey, and nursing therapeutic practices impact patterns of response, or outcomes. In this study, nursing therapeutics includes the structure within which nurses practice and the processes of care that are directly delivered to the patient. “Nature of the transition” and “transition condition” variables serve as control variables. Table 1 specifies the theoretical concepts, study variables, and empirical measures.
Table 1.
Relationships of Donabedian's Quality Model and Meleis' Transitions Theory to Study Variables and Measures
| Meleis' Transitions Theory | |||||
|---|---|---|---|---|---|
| Nature of Transition | Transition Conditions | Nursing Therapeutics | Patterns of Response | ||
| Donabedian's Quality Model | |||||
| Structure | Process | Outcome | |||
| Patient-level control variables | Patient-level control variables | Nurse staffing | Quality of discharge teaching | Readiness for hospital discharge | Postdischarge utilization |
| Measures | |||||
| Type of admission | Age | RN non-OT HPPD | Quality of discharge teaching scale | Readiness for hospital discharge scale | Readmission |
| MDC | Sex | RN OT HPPD | ED visits | ||
| Severity of illness | Race | Non-RN non-OT HPPD | |||
| Length of stay | Socioeconomic status | Non-RN OT HPPD | |||
| Living alone | |||||
| Prior hospitalization | Unit-level controls | ||||
| Transition coordination | RN vacancy | ||||
| Discharge content needed | Patient turnover | ||||
| Costs | |||||
| RN nonovertime and overtime salaries | ED and readmission costs and net revenue/loss | ||||
ED, emergency department; HPPD, hours-per-patient-day; MDC, major diagnostic category; OT, overtime; RN, registered nurse.
In addition to the conceptual strength, this study has several methodological advantages. Unit-level nurse staffing data better reflects the reality of point-of-service patient care than hospital-aggregate data (Lake and Friese 2006). Modeling the impact of variations in staffing within nursing units over time strengthens causal inference compared to earlier cross-sectional studies. Estimation of quality and cost implications permits identification of potential benefits to investment in hospital nurse labor within current and emerging payment models.
METHODS
Within a prospective, longitudinal, observational design, a nested multilevel panel data approach was used to test direct and indirect sequential relationships between unit-level nurse staffing variables, patient-reported quality of discharge teaching process, patient-reported readiness for hospital discharge, and postdischarge utilization of readmission and ED visits and related cost-benefit.
Sample and Setting
The sampling goal was to obtain a study sample representing the spectrum of patients admitted to acute care hospitals for medical–surgical conditions. Sample selection criteria were at least 18 years of age, spoke English or Spanish, hospitalized on a medical–surgical unit, and discharged directly home with or without home health services and without hospice care. Equivalent numbers of subjects were randomly selected within each of 16 participating medical–surgical units of four hospitals within a single health care system in the Midwestern United States. The health system has been recognized by the American Nurses Credentialing Center's Magnet Recognition Program for excellence in professional nursing practice. The target sample size of 110 patients per unit, for a total of 1,760 patients, was estimated to provide 80 percent power at 0.05 significance in estimating the impact of nurse staffing variables on discharge process and subsequent outcome measures (Bosker, Snijders, and Guldemond 2003).
A total of 4,050 patients were prescreened as eligible, of whom 395 (9.8 percent) were deemed ineligible due to insufficient English or Spanish language proficiency, lack of decisional capacity without presence of a family caregiver, admission for observation only, or unavailable for enrollment, and 1,616 (39.9 percent) refused participation. Of the 2,039 who enrolled, 128 (6.3 percent) later became ineligible due to discharge to a destination other than home, 12 (0.6 percent) were duplicate enrollees within 30 days (the second enrollment was recoded as readmission), and 7 (0.3 percent) withdrew. The final sample included 1,892 patients for whom complete data were available on nurse staffing and readmission variables. Of the 1,892, 1,458 (77.1 percent) completed the Quality of Discharge Teaching Scale (QDTS) and 1,449 (76.6 percent) completed the Readiness for Hospital Discharge Scale (RHDS). Sample characteristics are presented in Table 2.
Table 2.
Sample Characteristics (N = 1,892)
| Mean | SD | |
|---|---|---|
| Staffing variables | ||
| RN nonovertime staffing* | 5.0 | 0.8 |
| Non-RN nonovertime staffing* | 3.8 | 0.7 |
| RN overtime staffing* | 0.2 | 0.1 |
| Non-RN overtime staffing* | 0.1 | 0.1 |
| Discharge process variables | ||
| Quality of Discharge Teaching Scale (QDTS): | ||
| “Content received” subscale (0–10†) | 5.0 | 2.7 |
| “Delivery” subscale (0–10†) | 7.8 | 2.1 |
| Outcome variables | ||
| Readiness for Hospital Discharge Scale (RHDS) (0–10†) | 8.0 | 1.4 |
| n | % | |
|---|---|---|
| ED visits only (unplanned/related) | 80 | 4.2 |
| Readmission (unplanned/related) | 183 | 9.7 |
| Any unplanned/related postdischarge occurrence (ED or readmission) | 263 | 13.9 |
| Mean | SD | |
|---|---|---|
| Unit control variables | ||
| Admission–discharge ratio | 0.02 | 0.01 |
| RN vacancy rate | 10.3 | 8.1 |
| Patient control variables | ||
| QDTS | 4.0 | 2.6 |
| “Content needed” subscale (0–10†) | ||
| Age (range 18–102) | 58.2 | 16.8 |
| Socioeconomic status‡ (8–66†) | 36.9 | 13.1 |
| Length of stay (range 1–46) | 4.3 | 3.8 |
| n | % | |
|---|---|---|
| Sex: male | 856 | 45.2 |
| Race: | ||
| White | 1486 | 80.4 |
| Black | 247 | 13.4 |
| Hispanic | 78 | 4.2 |
| Other | 38 | 2.0 |
| Prior hospitalization for same condition | 796 | 42.1 |
| Transition coordination§ | 679 | 35.9 |
| Severity of illness: | ||
| 1 (minor) | 456 | 24.1 |
| 2 (moderate) | 776 | 41.0 |
| 3 (major) | 548 | 29.0 |
| 4 (extreme) | 112 | 5.9 |
| Medical type (nonsurgical) admission | 843 | 44.6 |
| Lives alone | 448 | 26.2 |
Measured in hours-per-patient day.
Theoretical and actual range of scores.
Socioeconomic status—Hollingshead Four Factor Index of Social Status.
Transition coordination includes case manager, care coordinator, community services assessment and/or referral, home health referral.
Study Variables and Measures
Unit-level nurse staffing structure variables were obtained from administrative data routinely collected for submission to the National Database of Nursing Quality Indicators. Variables reported monthly as hours-per-patient-day included the following: registered nurse (RN) nonovertime staffing and non-RN nonovertime staffing (productive nonovertime hours worked by RN and non-RN unit staff with direct patient care responsibilities, divided by inpatient days); and RN and non-RN overtime staffing (RN and non-RN overtime hours divided by inpatient days).
Discharge teaching was defined as the composite of teaching occurring during the hospitalization to prepare the patient and family for discharge. The QDTS (Weiss et al. 2007) is a patient self-report measure that uses an 11-point (0 to10) scale format to record patients' perceptions about the quality of discharge teaching received from their nurses during the course of discharge preparation. For this study, it served as a measure of the nursing process of discharge teaching as received by the patient. Two “content” subscales of six paired items measure the amount of “content needed” and “content received” related to information about managing care at home after discharge. The “delivery” subscale consists of 12 items measuring perceptions about the skill of nurses as educators (e.g., listening, answering concern, consistence, timing, promoting confidence) in presenting discharge teaching to the patient and family. Higher scores indicate greater amount of discharge-related information needed and received and higher quality approach used to “deliver” discharge preparation content.
For this study sample, Cronbach's α reliability estimates were 0.86, 0.85, and 0.93 for the three subscales, respectively. Confirmatory factor analysis provided further evidence of construct validity to the results of prior testing (Weiss et al. 2007). Because “content received” and “delivery” subscales had different predictive relationships with readiness for discharge in the prior study, the subscales were included separately as primary variables in the analysis model. The “content needed” subscale was used as a patient-level control variable.
The RHDS (Weiss and Piacentine 2006; Weiss et al. 2007) measures patient perception of readiness to go home from the hospital on a 21-item scale using a 0–10 rating format. Higher scores indicate greater perceived readiness. The scale includes four dimensions of discharge readiness: personal status—how the patient is feeling on the day of discharge; knowledge—how much the patient knows about discharge-related topics; perceived coping ability—how well the patient expects to be able to handle medical and nonmedical demands at home; and expected support—the amount of emotional and tangible support the patient expects to have after discharge. For this study sample, the Cronbach's α reliability estimate was 0.90 and confirmatory factor analysis supported the a priori scale structure (Weiss and Piacentine 2006).
Postdischarge utilization of ED visits and readmissions within 30 days was extracted from electronic hospital information systems. Encounters were reviewed by three reviewers and were included in the analysis if they were unplanned and related to the primary diagnosis or a comorbidity of the index hospitalization. Because readmissions and ED visits without readmission on the same encounter have different implications for patient well-being, resource use, and costs, the two types of encounters were examined separately. To assess completeness of readmission and ED visit data, a telephone interview was conducted at 31 days postdischarge with a 10 percent random sample of study participants. Of 138 contacted, one readmission and one ED visit to a nonstudy hospital were identified (1.4 percent).
Patient turnover, measured as admission–discharge ratio ([admissions+discharges]/patient days), and RN vacancy rate (ratio of vacant to budgeted RN full-time equivalent positions [FTEs]) were included as unit-level control variables to account for differences in patient flow and underlying staffing insufficiency that could impact the delivery of care processes and outcomes. Patient-level control variables included demographics (sex, age, race, socioeconomic status [Hollingshead 1975], living alone), clinical condition (major diagnostic category, type of admission [medical, surgical], severity of illness), and resource utilization (previous hospitalization, transition coordination, length of stay) (Corrigan and Martin 1992; McCusker et al. 2000; Phillips et al. 2004; Anderson et al. 2006; Billings et al. 2006; Van Walraven et al. 2010). Socioeconomic status and living alone were self-reported by the patient. All other variables were extracted from hospital information systems. Transition coordination was coded as present if a discharge transition support service (e.g. case manager, discharge coordinator, home health referral, community services assessment/referral) was recorded.
Cost and reimbursement data for postdischarge encounters were obtained from hospital cost accounting systems. Data were extracted at least 120 days postencounter to assure costs and reimbursement had been posted.
Data Collection Procedures
The study protocol was approved by university and health system Institutional Review Boards. Data were collected between January and July 2008. Using a within-unit randomization procedure, eligible patients were contacted by study research assistants. Informed consent was obtained on the day before or day of discharge. QDTS and RHDS were given to study patients within 4 hours before discharge by the research assistants or unit staff (using reminder triggers). Readmission and ED data for eligible encounters at any of the four study hospitals were extracted through cross-hospital electronic searching with multiple patient identifiers.
Analysis Methods
Stata Statistical Software Version 11.0 (Stata Corporation 2009) was used for statistical analyses. Patient and unit-level data were matched by date of discharge. Missing data on QDTS and RHDS were mean-substituted if more than 50 percent of item responses were completed. Designed as a system of four simultaneous recursive equations (Appendix SA2), the estimation model allowed testing of direct and indirect relationships among variables that appear in more than one equation. To reflect the sequential nature of the relationships, outcome variables became predictor variables in all subsequent equations. Linear regression equations for quality of discharge teaching (equation [1]: QDTS “content received” and equation [2]: QDTS “delivery”) included the four unit-level nurse staffing variables (RN and non-RN nonovertime and overtime hours-per-patient-day) as predictor variables. Linear regression equation for Readiness for Hospital Discharge (equation [3]) included nurse staffing and the QDTS variables as predictors. Multinomial logistic regression equation for readmission and ED visits (equation [4]) included nurse staffing, QDTS, and RHDS as predictors. All models included patient and unit-level control variables in order to determine the independent influence of the primary variables of interest. The panel structure of the data was modeled by including hospital-level and unit-level fixed effects in all models, as well as a linear time trend, which eliminated the influence of between-unit variance in the study variables and allowed estimation of the relationship between the study variables within-unit over-time. This procedure makes the estimation robust to confounding that could result from not fully controlling for unobserved underlying differences among the study units. The full model was estimated with robust standard errors using the seemingly unrelated estimation technique [suest command], which accounted for the possibility of interdependence of individual observations that arise from the clustered multilevel data structure, and for the interrelated nature of the error terms between the equations.
Direct and the indirect relationships among the study variables were estimated with regression coefficients from equations (1), (2), and (3). For the logistic model (equation [4]), the coefficients were replaced with average marginal effects (ME) (i.e. the average marginal change in the probability of postdischarge utilization for a unit change in the predictor variable), calculated using the margins command. Indirect effects were calculated through recursive substitution using estimated coefficients from multiple equations. Individual coefficients and their combinations were tested using standard nonlinear hypothesis testing techniques and the variance–covariance matrix of regression coefficients that includes both within- and between-equations parameter covariances.
A cost-benefit analysis estimated the total financial impact of modifying nurse staffing to improve postdischarge utilization. The cost basis for nurse staffing variables was derived from the 2008 average hourly cost of compensation, including salary and benefits, from the Bureau of Labor Statistics (US Department of Labor 2009). RN hourly compensation was U.S.$45.83 (salary, U.S.$31.66; benefits, U.S.$14.17) and non-RN hourly compensation was U.S.$29.66 (salary, U.S.$19.28; benefits, U.S.$10.38). Cost of overtime was calculated as 1.5 times the hourly salary without benefits. Costs associated with readmission and ED visits were calculated from actual cost and reimbursement data for these encounters derived from the study health system's cost accounting system.
Staffing costs and postdischarge utilization costs were estimated on a per-patient basis for the index hospitalization (n = 1,892). The estimated per-patient costs of additional staffing were calculated for a 1 SD increase in nonovertime and overtime hours-per-patient-day multiplied by the length of stay. These staffing costs were combined with the expected per-patient reduction in the hospital's revenue margin (reimbursement for postdischarge utilization minus its cost) derived from the predicted magnitude of reduction (ME) in readmission and ED visits to obtain the total per-patient financial impact on the hospital. Payer cost savings per hospitalized patient were estimated by calculating the expected reduction in reimbursement payments for readmission and ED visits (ME times reimbursement for each encounter type, respectively). Annual patient volume for the l6 units participating in the study was estimated and annual net potential cost savings were calculated.
RESULTS
Descriptive statistics for primary study variables and patient and unit-level control variables are reported in Table 2. On average, patients received 9.1 total hours of combined RN and non-RN care (nonovertime and overtime), comprised predominantly of regular (nonovertime) hours. Few overtime hours were used during the study period, a reflection of cost-containment efforts. Fluctuations in average unit RN staffing and postdischarge utilization rates over the 7-month study period are displayed in Figure 1.
Figure 1.
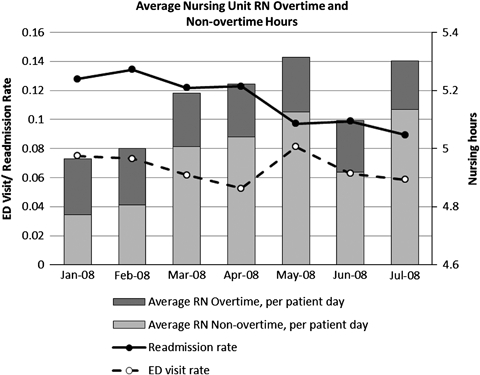
Longitudinal Fluctuations in Nursing Unit Average Registered Nurse (RN) Hours-Per-Patient-Day and Readmission/ED Visit Rates
Patients generally rated the quality of their discharge teaching as relatively high, with the “delivery” of teaching rated at 7.8 (SD = 2.1) out of 10. The amount of discharge teaching “content received” was rated at the midpoint of the 0–10 scale (mean = 5.0, SD = 2.7), exceeding the amount of teaching patients reported needing (QDTS “content needed” = 4.0, SD = 2.6). Patients reported high levels of readiness for discharge with a scale mean of 8.0 (SD = 1.4) out of 10.
The 30-day all-cause readmission rate for the sample was 11.9 percent (n = 225) of which 9.7 percent (n = 183) were unplanned and related to the primary diagnosis or a comorbidity of the index hospitalization. In addition, 5.1 percent (n = 96) of patients had ED visits without readmission in the same period, of which 4.2 percent, (n = 80) were unplanned and related. These rates are lower than reported in population samples that exclude patients <65 years and/or include encounters for other than adult medical–surgical conditions and discharges to long-term and continuing care facilities (Burt, McCaig, and Simon 2008; Jencks, Williams, and Coleman 2009).
Results of the simultaneous equations model (equations [1–4]) are presented in Table 3.
Table 3.
Results for Simultaneous Equation Estimation
| Equation 1 QDTS_“Content Received” | Equation 2 “QDTS_Delivery” | Equation 3 RHDS | Equation 4 Unplanned Related Postdischarge Utilization | ||||||||||||||||||||||
|---|---|---|---|---|---|---|---|---|---|---|---|---|---|---|---|---|---|---|---|---|---|---|---|---|---|
| Emergency Department | Readmission | ||||||||||||||||||||||||
| 95% CI | 95% CI | 95% CI | 95% CI | 95% CI | |||||||||||||||||||||
| B | SE | Lower | Upper | p>z | B | SE | Lower | Upper | p>z | B | SE | Lower | Upper | p>z | OR | SE | Lower | Upper | p>z | OR | SE | Lower | Upper | p>z | |
| RHDS | 0.76 | 0.11 | 0.57 | 1.00 | 0.05 | 0.88 | 0.08 | 0.74 | 1.05 | 0.17 | |||||||||||||||
| QDTS delivery | 0.35 | 0.02 | 0.30 | 0.40 | 0.00 | 1.11 | 0.13 | 0.88 | 1.39 | 0.36 | 1.11 | 0.08 | 0.97 | 1.27 | 0.13 | ||||||||||
| QDTS received | 0.07 | 0.02 | 0.03 | 0.11 | 0.00 | 0.99 | 0.08 | 0.84 | 1.17 | 0.93 | 1.00 | 0.06 | 0.89 | 1.13 | 0.77 | ||||||||||
| RN nonovertime # | −0.05 | 0.14 | −0.32 | 0.23 | 0.74 | 0.27 | 0.13 | 0.01 | 0.53 | 0.04 | −0.08 | 0.08 | −0.24 | 0.09 | 0.37 | 1.73 | 0.74 | 0.75 | 4.00 | 0.20 | 0.56 | 0.15 | 0.33 | 0.93 | 0.04 |
| Non-RN nonovertime # | −0.03 | 0.09 | −0.22 | 0.15 | 0.73 | 0.04 | 0.08 | −0.12 | 0.20 | 0.60 | 0.05 | 0.05 | −0.05 | 0.15 | 0.36 | 1.20 | 0.41 | 0.61 | 2.35 | 0.59 | 0.83 | 0.15 | 0.58 | 1.19 | 0.60 |
| RN overtime # | −0.17 | 0.09 | −0.34 | 0.00 | 0.06 | −0.16 | 0.09 | −0.34 | 0.01 | 0.07 | 0.00 | 0.05 | −0.10 | 0.11 | 0.95 | 1.70 | 0.44 | 1.02 | 2.83 | 0.04 | 1.23 | 0.21 | 0.88 | 1.73 | 0.34 |
| Non-RN overtime # | 0.10 | 0.08 | −0.06 | 0.26 | 0.22 | −0.03 | 0.09 | −0.20 | 0.14 | 0.76 | −0.06 | 0.05 | −0.17 | 0.04 | 0.24 | 0.78 | 0.21 | 0.46 | 1.33 | 0.37 | 0.87 | 0.15 | 0.63 | 1.21 | 0.60 |
| R2 | 0.51 | 0.12 | 0.37 | 0.17 | |||||||||||||||||||||
Notes. The model was estimated using the simultaneous equations method with robust (cluster-adjusted) standard errors. Estimates are from linear regressions for equations 1, 2, and 3 and multinomial logistic regression for equation 4. All equations include unit and hospital-level fixed effects, a linear time trend, unit level controls for admission–discharge ratio and RN vacancy rate, and patient-level controls for age, sex, race, socioeconomic status, lives alone, MDC, severity of illness, type of admission (medical, surgical), length of stay, prior hospitalization for same condition, QDTS content needed, received transition coordination services.
Figures in bold indicate statistically significant findings at p <.05.
QDTS, Quality of Discharge Teaching Scale; RHDS, Readiness for Hospital Discharge Scale; #, measured in hours-per-patient day.
Direct Effects of Nurse Staffing on Postdischarge Utilization (Equation [4])
RN nonovertime and RN overtime staffing were significant contributors to the model. The panel data analysis revealed that in the months of the study when nursing units had higher RN nonovertime staffing, the odds of patient readmission were lower. One SD size increase in RN nonovertime staffing (0.75 hours-per-patient-day) was directly associated with a 0.44 reduction in the odds of an unplanned/related readmission (OR = 0.56, p<.05), for a 4.4 percentage point reduction in probability of readmission (ME = −0.044, p<.05). There was not a significant direct association between RN nonovertime staffing and the likelihood of an ED visit (OR = 1.73, ME = 0.020, p = .20). RN overtime was positively associated with postdischarge utilization; when RN overtime staffing was higher, the odds of ED use were also higher. A SD size increase in RN overtime staffing (0.07 hours-per-patient-day) was directly associated with a 0.70 increase in the odds of an ED visit (OR = 1.70, p<.05), or a 1.7 percentage point increase in the probability of an ED visit (ME = 0.017, p<.05). No direct effects were observed between non-RN staffing and postdischarge utilization.
Indirect Sequential Effect of Nurse Staffing on Utilization through QDTS and RHDS (Equations [1–4])
There was a path of significant associations from RN staffing to patient-reported quality of discharge teaching, from quality of discharge teaching to patient-reported discharge readiness, and from discharge readiness to postdischarge ED use. While the association between nurse staffing variables and quality of discharge teaching (QDTS) “content received” subscale was nonsignificant (equation [1]), a SD size increase in RN nonovertime staffing was significantly associated with a 0.27 (p = <.05) higher score (on a 10-point scale) on the quality of discharge teaching (QDTS) “delivery” subscale (equation [2]). A 1-point increase (out of 10) in the mean QDTS “delivery” subscale score was associated with 0.35-point (p<.001) increase in the mean discharge readiness (RHDS) score (equation [3]). The amount of discharge information (QDTS “content received” subscale) was also significantly but less strongly associated with discharge readiness (a 1-point higher QDTS “content received” score increased RHDS by 0.07 points [p<.001]) (equation [3]). Higher discharge readiness scores were in turn associated with 0.24 lower odds of an ED visit (OR = 0.76, p = .05) (equation [4]). No effects were observed for RN overtime staffing or non-RN staffing on quality of discharge teaching or discharge readiness. Importantly, quality of discharge teaching scores was not significantly associated with postdischarge utilization, suggesting a path of influence from quality of discharge teaching to the proximate outcome of patient's perception of discharge readiness, which is then associated with ED use.
Cost-Benefit Analysis
A cost-benefit analysis of modifying nurse staffing was performed for the two staffing variables with significant impact on postdischarge utilization. Increasing RN nonovertime staffing by 1 SD (0.75 hours-per-patient-day) was estimated to have a negative impact on hospitals of U.S.$197.92 per hospitalized patient (sum of increased RN staffing costs, U.S.$145.74, and loss of revenue from reduced readmissions, U.S.$52.18, per hospitalized patient), while saving payers U.S.$607.51 per hospitalized patient from reduced postdischarge utilization, for a net potential savings of U.S.$409.59 per hospitalized patient. Likewise, reducing RN overtime staffing by 1 SD (0.07 hours-per-patient-day) was estimated to result in savings to hospitals of U.S.$8.18 per hospitalized patient derived from offsetting reduced revenue from ED visits with reduced overtime salary costs. Reduced utilization of ED visits would benefit payers in the amount of U.S.$10.98 per hospitalized patient, for a net potential savings of U.S.$19.16 per hospitalized patient.
For the 16 units included in the study, the annualized estimated net cost savings is U.S.$11.64 million from investment in additional RN nonovertime staffing and U.S.$544,000 from reducing RN overtime staffing, although costs accrue to hospitals and savings to payers in current payment models.
DISCUSSION
The findings of this study add to the substantial body of work on the impact of nurse staffing on inpatient care outcomes by (1) documenting the impact of hospital nursing care beyond hospital discharge; (2) linking unit-level staffing to quality of a nursing care process (discharge teaching), and to outcomes at discharge (readiness) and postdischarge (utilization); (3) estimating the costs and savings associated with investment in nurse staffing. The use of unit-level staffing data measured within-unit over time and inclusion of structure and process measures provides stronger evidence of a link to patient outcomes and cost-benefit than in prior cross-sectional studies that used between-unit or between-hospital comparisons.
In this study sample, there was a direct, negative association between RN hours to which patients were exposed during hospitalization and the odds of subsequent readmission. Among patients hospitalized on the same nursing unit, those who were discharged when RN nonovertime staffing was higher were less likely to subsequently be readmitted. When RN overtime staffing was higher, the odds of postdischarge occurrence of ED visits increased, consistent with previous findings that nurses' performance may be suboptimal in extended work hour situations (Rogers et al. 2004). Variation in amount of non-RN staffing did not explain postdischarge utilization, pointing to the importance of the amount of RN-level care provider time to patient outcomes (Aiken et al. 2002; Needleman et al. 2002; Cho et al. 2003).
To understand the mechanism through which nurse staffing levels could affect postdischarge outcomes, the relationship to a nursing process measure (quality of discharge teaching) was evaluated. As anticipated, when RN staffing hours were higher, patients reported higher quality discharge teaching. With more hours allocated per-patient-day, nurses have more time available for core functions, particularly time-consuming functions like discharge teaching. Effective discharge preparation goes beyond basic information-giving to planning and problem solving for self-care management in the home after discharge. Patient engagement in self-management is an important part of successful transition to home-based care (Glasgow et al. 2002; Hibbard et al. 2004; Ryan, Aloe, and Mason-Johnson 2009).
The study documented a path of influence from RN nonovertime staffing through discharge teaching and patient perception of discharge readiness to ED use, but not readmission. Posthospitalization ED use occurs due to concerns about symptoms, complications (that may arise from failure to follow home instructions or inadequate knowledge about recovery), or lack of access to other care sources (Burt, McCaig, and Simon 2008). Effective discharge teaching and the subsequent increase in discharge readiness may have prevented ED use associated with self-care deficiencies but not postdischarge complications unrelated to self-care abilities that require readmission.
Explanations of nursing process mediators of the relationship between nurse staffing and readmission are needed. Although others have documented beneficial effects of programmed discharge transition activities on readmission and the role of discharge planning on patient outcomes (Coleman et al. 2008; Jack et al. 2009; Popejoy, Moylan, and Galambos 2009), the unique role and contribution of the hospital staff nurse, who is often responsible for carrying out discharge preparation functions, is still unclear. With direct interaction and indirect coordination time for discharge processes approaching 1.5 hours per patient (Jack et al. 2009), differentiation of discharge processes requiring RN-level skill could support planning for adequate staffing to achieve critical patient outcomes.
Three recommendations for health care policy and practice emerge from the study findings: (1) manage nurse staffing levels to achieve optimal patient outcomes; (2) implement assessment of quality of discharge teaching and discharge readiness as standard predischarge practices; and (3) align payment models to encourage nurse staffing levels supportive of postdischarge outcomes. These recommendations contribute to the arsenal of strategies addressing health care quality and cost reforms.
Management of within-unit variation in nurse staffing holds the potential to improve postdischarge outcomes and costs of care. Staffing management is both a hospital and unit-level function. Strategic decisions to increase nurse staffing and recruitment/retention efforts to sustain optimal staffing levels are hospital-level management actions; control strategies to avoid understaffing are the role of unit-based managers.
Assessment of quality of discharge teaching and discharge readiness are not standard predischarge practices either for quality measurement purposes or as opportunities for anticipatory correction. Implementation of these assessments within discharge protocols will promote early identification of patients without adequate discharge knowledge and skills for self-management after discharge. The assessments could trigger anticipatory interventions for reinforcement of discharge preparation and for transitional support services during the posthospitalization period. The QDTS and RHDS tools have been used in research with adults of all ages (Bobay et al. 2010). Shortened forms are currently being tested.
The cost-benefit analysis revealed a substantial potential economic benefit to increasing nurse staffing. Costs of improved hospital RN staffing could be offset by costs avoided through averting postdischarge utilization. However, there is no business case for increasing nurse staffing when the financial beneficiaries of reduced postdischarge utilization are the payer and patient (Needleman 2008). Implementation of payment reforms such as gain-sharing, bundling of payments for hospital and posthospital care, and creation of structures accountable for continuum of care services will incentivize optimal staffing to improve discharge processes, and achieve desired patient outcomes and cost savings (Guterman and Drake 2010).
Limitations
There are several limitations to the study design and methods. The patient sample included patients at least 18 years of age who were discharged home. Patients discharged to long-term care were not included. Postdischarge encounters outside the four study hospitals were not accessible. The Magnet-recognized health system that served as the study site may not represent the staffing patterns and quality of care, including discharge preparation process, within non-Magnet facilities. Therefore, the relationships of nurse staffing to discharge preparation and postdischarge utilization may be different in other patient and health system samples.
The focus of the study was the impact of within-unit variation of direct RN and non-RN hours of care. Within-unit variation was sampled over 7 monthly intervals. The availability of monthly staffing averages rather than daily staffing assigned to individual patients precluded linking patient-specific data directly to the actual days of hospitalization. Unit-level staffing aggregated within the month of discharge is the best routinely available approximation of care delivered to individual patients and offers better explanatory support than hospital-level aggregate data. As information technology systems evolve, direct linking of nurse staffing data to the individual patient's hospital stay will be possible. The precision with which staffing estimates and patient-level data are linked should be a consideration in planning future studies.
The study model did not include variables related to models of nursing and interdisciplinary care coordination and delivery, other measures of staffing such as FTEs or nurse-patient ratios, or direct observation of discharge teaching and other preparatory activities. Nurse staffing variables that have been previously linked to hospitalization outcomes, such as RN education and experience (Blegen, Vaughn, and Goode 2001; Aiken et al. 2003), were reported annually by the study units and therefore were insufficient for within-unit panel analysis. Nonnurse factors that could impact readmission, such as physician practices, were not investigated.
The cost model used regional nurse staffing cost estimates. While this was done to increase generalizability of the study findings, it may be different than the health care system's actual staffing costs. Projections for costs and savings included hospital-reported costs only and did not include payments for physician services.
CONCLUSIONS
This study extends previous health services research on the impact of nurse staffing on patient outcomes of hospitalization by linking the unit-level nurse staffing directly to postdischarge readmission and indirectly through discharge teaching process to patient readiness for discharge and subsequent ED visits. Findings support recommendations to (1) monitor and manage unit-level nurse staffing to optimize impact on postdischarge outcomes, (2) implement assessment of quality of discharge teaching and discharge readiness as standard predischarge practices, and (3) realign payment structures to offset costs of increasing nurse staffing with costs avoided through improved postdischarge utilization.
Acknowledgments
Joint Acknowledgment/Disclosure Statement: The study was funded through a grant from the Robert Wood Johnson Foundation Interdisciplinary Nursing Quality Research Initiative.
Disclosures: None.
Disclaimers: None.
Supporting Information
Additional supporting information may be found in the online version of this article:
Appendix SA1: Author Matrix.
Appendix SA2: Simultaneous Equation Model for Regressions of Readmission and ED Utilization on Nurse Staffing, Quality of Discharge Teaching, and Readiness for Hospital Discharge.
Please note: Wiley-Blackwell is not responsible for the content or functionality of any supporting materials supplied by the authors. Any queries (other than missing material) should be directed to the corresponding author for the article.
REFERENCES
- Aiken LH, Clarke SP, Cheung RB, Sloane DM, Silber JH. Educational Levels of Hospital Nurses and Surgical Patient Mortality. Journal of the American Medical Association. 2003;290(12):1617–23. doi: 10.1001/jama.290.12.1617. [DOI] [PMC free article] [PubMed] [Google Scholar]
- Aiken LH, Clarke SP, Sloane DM, Sochalski J, Silber JH. Hospital Nurse Staffing and Patient Mortality, Nurse Burnout, and Job Dissatisfaction. Journal of the American Medical Association. 2002;288(16):1987–93. doi: 10.1001/jama.288.16.1987. [DOI] [PubMed] [Google Scholar]
- Anderson MA, Levsen J, Dusio ME, Bryant PJ, Brown SM, Burr CM, Brown-Benn C. Evidence-Based Factors in Readmission of Patients with Heart Failure. Journal of Nursing Care Quality. 2006;21(2):160–7. doi: 10.1097/00001786-200604000-00012. [DOI] [PubMed] [Google Scholar]
- Billings J, Dixon J, Mijanovich T, Wennberg D. Case Finding for Patients At Risk of Readmission to Hospital: Development of Algorithm to Identify High Risk Patients. British Medical Journal. 2006;333(7563):327. doi: 10.1136/bmj.38870.657917.AE. doi: 10.1136/bmj.38870.657917.AE. [DOI] [PMC free article] [PubMed] [Google Scholar]
- Blegen MA, Vaughn TE, Goode CJ. Nurse Experience and Education: Effect on Quality of Care. Journal of Nursing Administration. 2001;31(1):33–9. doi: 10.1097/00005110-200101000-00007. [DOI] [PubMed] [Google Scholar]
- Bobay K, Jerofke T, Weiss M, Yakusheva O. Age-related Differences in Perception of Quality of Discharge Teaching and Readiness for Hospital Discharge. Geriatric Nursing. 2010;31(3):178–87. doi: 10.1016/j.gerinurse.2010.03.005. [DOI] [PubMed] [Google Scholar]
- Bosker RJ, Snijders TAB, Guldemond H. 2003. PINT (Power IN Two-Level Designs): Estimating Standard Errors of Regression Coefficients [computer program]
- Burt CV, McCaig LF, Simon AE. 2008. Emergency Department Visits by Persons Recently Discharged from U.S. Hospitals. National Health Statistics Reports, no.6. Hyattsville, MD: National Center for Health Statistics.
- Center For Allied Health Evidence. University Of South Australia” [accessed on March 1, 2010]. Available a http://www.unisa.edu.au/cahe/resources/DCP/default.asp.
- Cho SH, Ketefian S, Barkauskas VH, Smith DG. The Effects of Nurse Staffing on Adverse Events, Morbidity, Mortality, and Medical Costs. Nursing Research. 2003;52(2):71–9. doi: 10.1097/00006199-200303000-00003. [DOI] [PubMed] [Google Scholar]
- Coleman EA, Parry C, Chalmers SA, Min S-J. The Care Transition Intervention: Results of a Randomized Clinical Trial. Archives of Internal Medicine. 2008;166:1822–8. doi: 10.1001/archinte.166.17.1822. [DOI] [PubMed] [Google Scholar]
- Corrigan JM, Martin JB. Identification of Factors Associated with Hospital Readmission and Development of a Predictive Model. Health Services Research. 1992;27(1):81–101. [PMC free article] [PubMed] [Google Scholar]
- Donabedian A. Evaluating the Quality of Medical Care. Milbank Memorial Fund Quarterly. 1966;44(3, suppl):166–206. [PubMed] [Google Scholar]
- Driscoll A. Managing Post-Discharge Care at Home: An Analysis of Patients' and Their Carers' Perceptions of Information Received during Their Stay in Hospital. Journal of Advanced Nursing. 2000;31(5):1165–73. doi: 10.1046/j.1365-2648.2000.01372.x. [DOI] [PubMed] [Google Scholar]
- Friedman B, Basu JJ. The Rate and Cost of Hospital Readmissions for Preventable Conditions. Medical Care Research and Review. 2004;61(2):225–40. doi: 10.1177/1077558704263799. [DOI] [PubMed] [Google Scholar]
- Glasgow RE, Funnell MM, Bonomi AE, Davis C, Beckham V, Wagner EH. Self-Management Aspects of the Improving Chronic Illness Care Breakthrough Series: Implementation with Diabetes and Heart Failure Teams. Annals of Behavioral Medicine. 2002;24(2):80–7. doi: 10.1207/S15324796ABM2402_04. [DOI] [PubMed] [Google Scholar]
- Goldfield NI, McCullough EC, Hughes JS, Tang AM, Eastman B, Rawlins LK, Averill RF. Identifying Potentially Preventable Readmissions. Health Care Financing Review. 2008;30(1):75–91. [PMC free article] [PubMed] [Google Scholar]
- Greenwald JL, Denham CR, Jack BW. The Hospital Discharge: A Review of a High Risk Care Transition with Highlights of a Reengineered Discharge Process. Journal of Patient Safety. 2007;3(2):97–106. [Google Scholar]
- Grimmer K, Moss J, Falco J. Experiences of Elderly Patients Regarding Independent Community Living after Discharge from Hospital: A Longitudinal Study. International Journal for Quality in Health Care. 2004;16(6):465–72. doi: 10.1093/intqhc/mzh071. [DOI] [PubMed] [Google Scholar]
- Guterman S, Drake H. Developing Innovative Payment Approaches: Finding the Path to High Performance. New York: The Commonwealth Fund; 2010. [Google Scholar]
- Henderson A, Zernike W. A Study of the Impact of Discharge Information for Surgical Patients. Journal of Advanced Nursing. 2001;35(3):435–41. doi: 10.1046/j.1365-2648.2001.01857.x. [DOI] [PubMed] [Google Scholar]
- Hibbard JH, Stockard J, Mahoney ER, Tusler M. Development of the Patient Activation Measure (PAM): Conceptualizing and Measuring Activation in Patients and Consumers. Health Services Research. 2004;39(4, part 1):1005–26. doi: 10.1111/j.1475-6773.2004.00269.x. [DOI] [PMC free article] [PubMed] [Google Scholar]
- Hollingshead A. Four Factor Index of Social Status. New Haven, CT: Yale University; 1975. [Google Scholar]
- Jack BW, Chetty VK, Anthony D, Greenwald JL, Sanchez GM, Johnson AE, Forsythe SR, O'Donnell JK, Paasche-Orlow MK, Manasseh C, Martin S, Culpepper L. A Reengineered Hospital Discharge Program to Decrease Rehospitalization: A Randomized Trial. Annals of Internal Medicine. 2009;150(3):178–87. doi: 10.7326/0003-4819-150-3-200902030-00007. [DOI] [PMC free article] [PubMed] [Google Scholar]
- Jencks SF, Williams MV, Coleman EA. Rehospitalizations among Patients in the Medicare Fee-For-Service Program. New England Journal of Medicine. 2009;360(14):1418–2. doi: 10.1056/NEJMsa0803563. [DOI] [PubMed] [Google Scholar]
- Kane RL, Shamliyan T, Mueller C, Duval S, Wilt T. 2007. “Nursing Staffing and Quality of Patient Care.” Evidence Report/Technology Assessment No. 151 (Prepared by the Minnesota Evidence-Based Practice Center under Contract No. 290-02-0009). AHRQ Publication No. 07-E005 [accessed on April 8, 2009]. Available at http://www.Ahrq.Gov/Downloads/Pub/Evidence/Pdf/Nursestaff/Nursestaff.Pdf.
- Koelling TM, Johnson ML, Cody RJ, Aaronson KD. Discharge Education Improves Clinical Outcomes in Patients with Chronic Heart Failure. Circulation. 2005;111(2):179–85. doi: 10.1161/01.CIR.0000151811.53450.B8. [DOI] [PubMed] [Google Scholar]
- Lake ET, Friese CR. Variations in Nursing Practice Environments: Relation to Staffing and Hospital Characteristics. Nursing Research. 2006;55(1):1–9. doi: 10.1097/00006199-200601000-00001. [DOI] [PubMed] [Google Scholar]
- Mamon J, Steinwachs DM, Fahey M, Bone LR, Oktay J, Klein L. Impact of Hospital Discharge Planning on Meeting Patient Needs after Returning Home. Health Services Research. 1992;27(2):155–7. [PMC free article] [PubMed] [Google Scholar]
- McCusker J, Cardin S, Bellavance F, Belzile E. Return to the Emergency Department among Elders: Patterns and Predictors. Academic Emergency Medicine. 2000;7(3):249–5. doi: 10.1111/j.1553-2712.2000.tb01070.x. [DOI] [PubMed] [Google Scholar]
- Meleis AI, Sawyer LM, Im E, Messias DKH, Schumacher K. Experiencing Transitions: An Emerging Middle-range Theory. Advances in Nursing Science. 2000;23(1):12–28. doi: 10.1097/00012272-200009000-00006. [DOI] [PubMed] [Google Scholar]
- Minott J. 2008. “Reducing Hospital Readmissions” [accessed on April 8, 2009]. Available at http://www.academyhealth.Org/Files/Publications/Reducing_Hospital_Readmissions.pdf.
- Mistiaen P, Francke AL, Poot E. Interventions Aimed at Reducing Problems in Adult Patients Discharged from Hospital to Home: A Systematic Meta-review. BMC Health Services Research. 2007;7:47–65. doi: 10.1186/1472-6963-7-47. [DOI] [PMC free article] [PubMed] [Google Scholar]
- Naylor MD, Brooten D, Campell R, Jacobsen BS, Mezey MD, Pauly MV. Comprehensive Discharge Planning and Home Follow-Up of Hospitalized Elders: A Randomized Clinical Trial. Journal of the American Medical Association. 1999;281:613–20. doi: 10.1001/jama.281.7.613. [DOI] [PubMed] [Google Scholar]
- Needleman J. Is What's Good for the Patient Good for the Hospital? Aligning Incentives and the Business Case for Nursing. Policy, Politics, and Nursing Practice. 2008;9(2):80–7. doi: 10.1177/1527154408320047. [DOI] [PubMed] [Google Scholar]
- Needleman J, Buerhaus P, Mattke S, Stewart M, Zelevinsky K. Nurse-Staffing Levels and the Quality of Care in Hospitals. New England Journal of Medicine. 2002;346(22):1715–22. doi: 10.1056/NEJMsa012247. [DOI] [PubMed] [Google Scholar]
- Nosbusch JM, Weiss ME, Bobay KL. Challenges Confronting the Acute Care Staff Nurse in Discharge Planning: An Integrated Review of the Literature. Journal of Clinical Nursing. 2011;20(5-6):754–74. doi: 10.1111/j.1365-2702.2010.03257.x. [DOI] [PubMed] [Google Scholar]
- Phillips CO, Wright SM, Kern DE, Singa RM, Shepperd S, Rubin HR. Comprehensive Discharge Planning with Postdischarge Support for Older Patients with Congestive Heart Failure: A Meta-Analysis. Journal of the American Medical Association. 2004;291(11):1358–67. doi: 10.1001/jama.291.11.1358. [DOI] [PubMed] [Google Scholar]
- Popejoy LL, Moylan K, Galambos C. A Review of Discharge Planning Research of Older Adults 1990–2008. Western Journal of Nursing Research. 2009;31(7):923–47. doi: 10.1177/0193945909334855. [DOI] [PubMed] [Google Scholar]
- Reiley P, Iezzoni LI, Phillips R, Davis RB, Tuchin LI, Calkins D. Discharge Planning: Comparison of Patients and Nurses' Perceptions of Patients Following Hospital Discharge. Journal of Nursing Scholarship. 1996;28(2):143–7. doi: 10.1111/j.1547-5069.1996.tb01207.x. [DOI] [PubMed] [Google Scholar]
- Rogers A, Wei-Ting H, Scott L, Aiken L, Dinges D. The Working Hours of Hospital Staff Nurses and Patient Safety. Health Affairs. 2004;23(4):202–1. doi: 10.1377/hlthaff.23.4.202. [DOI] [PubMed] [Google Scholar]
- Ryan M, Aloe K, Mason-Johnson J. Improving Self-Management and Reducing Hospital Readmission in Heart Failure Patients. Clinical Nurse Specialist. 2009;23(4):216–21. [Google Scholar]
- Seago JA, Williamson A, Atwood C. Longitudinal Analyses of Nurse Staffing and Patient Outcomes: More about Failure to Rescue. Journal of Nursing Administration. 2006;36(1):13–21. doi: 10.1097/00005110-200601000-00005. [DOI] [PubMed] [Google Scholar]
- Stata Corporation. Stata (release 11) statistical software. College Station, TX: Stata Corporation; 2009. [Google Scholar]
- Strunin L, Stone M, Jack B. Understanding Rehospitalization: Can Hospital Discharge Be Modified to Reduce Recurrent Hospitalization? Journal of Hospital Medicine. 2007;2(5):297–304. doi: 10.1002/jhm.206. [DOI] [PubMed] [Google Scholar]
- Titler M, Dochterman J, Kim T, Kanak M, Shever M, Picone DM, Everett L, Budreau G. Cost of Care for Seniors Hospitalized for Hip Fracture and Related Procedures. Nursing Outlook. 2007;55(1):5–14. doi: 10.1016/j.outlook.2006.06.006. [DOI] [PubMed] [Google Scholar]
- Titler M, Picone JDM, Everett L, Xie X-J, Kanak M, Fei Q. Cost of Hospital Care for Elderly at Risk of Falling. Nursing Economics. 2005;23(6):290–306. [PubMed] [Google Scholar]
- United States Department of Labor. Bureau of Labor Statistics. 2009 “Employer Cost For Employee Compensation” [accessed on February 4, 2010]. Available at http://www.Bls.Gov/Data/#Wages.
- Van den Heede K, Sermeus W, Diya L, Clarke SP, Lesaffre E, Vleugels A, Aiken LH. Nurse Staffing and Patient Outcomes in Belgian Acute Hospitals: Cross-sectional Analysis of Administrative Data. International Journal of Nursing Studies. 2009;46(7):928–39. doi: 10.1016/j.ijnurstu.2008.05.007. [DOI] [PMC free article] [PubMed] [Google Scholar]
- Van Walraven C, Dhalla IA, Bell C, Etchells E, Stiell IG, Zarnke K, Austin PC, Forster AJ. Derivation and Validation of an Index to Predict Early Death or Unplanned Readmission after Discharge from Hospital to the Community. Canadian Medical Association Journal. 2010;182(6):551–7. doi: 10.1503/cmaj.091117. [DOI] [PMC free article] [PubMed] [Google Scholar]
- Weiss ME, Piacentine LB. Psychometric Properties of the Readiness For Hospital Discharge Scale. Journal of Nursing Measurement. 2006;14(3):163–80. doi: 10.1891/jnm-v14i3a002. [DOI] [PubMed] [Google Scholar]
- Weiss ME, Piacentine LB, Lokken L, Ancona J, Archer J, Gresser S, Holmes SB, Toman S, Toy A, Vega-Stromberg T. Predictors and Outcomes of Readiness for Hospital Discharge in Acute Medical–Surgical Patients. Clinical Nurse Specialist. 2007;21(1):31–42. doi: 10.1097/00002800-200701000-00008. [DOI] [PubMed] [Google Scholar]
Associated Data
This section collects any data citations, data availability statements, or supplementary materials included in this article.