Abstract
A method has been developed to quantify synephrine in bitter orange raw material, extracts, and dietary supplements. Single-laboratory validation has been performed on the method to determine the repeatability, accuracy, selectivity, limit of detection/limit of quantification (LOQ), ruggedness, and linearity for p-synephrine and 5 other biogenic amines: octopamine, phenylephrine (m-synephrine), tyramine, N-methyltyramine, and hordenine, which may be present in bitter orange. p-Synephrine was found to be the primary biogenic amine present in all materials tested, accounting for >80% of the total biogenic amine content in all samples except a finished product. Repeatability precision for synephrine was between 1.48 and 3.55% RSD. Synephrine recovery was between 97.5 and 104%. The minor alkaloids were typically near the LOQ of the method (300–900 μg/g) in the test materials, and between-day precision for the minor compounds was poor because interferences could sometimes be mistakenly identified as one of the minor analytes. Recoveries of the minor components ranged from 99.1 to 103% at approximately 6000 μg/g spike level, to 90.7 to 120% at 300 μg/g spike level.
Zhi Shi is a traditional Chinese medicine derived from the unripe fruit of Citrus aurantium L. [Rutaceae] (CA), which has been used to activate vital energy and circulation, eliminate phlegm, and disperse stagnation (1). CA is commonly referred to in commerce as bitter orange, sour orange, or Seville orange. In addition to containing over 60 flavonoids (2, 3), CA has been reported to contain a number of biogenic amines, including p-synephrine (4–6), octopamine (6), tyramine (6), and N-methyltyramine (5). Penzak et al. reported the primary biogenic amine present in CA as phenylephrine (m-synephrine; 7), a known mydriatic and decongestant present in pharmaceutical preparations. Allison et al. were unable to determine whether CA contained p-synephrine, phenylephrine, or both, because the botanical materials they examined had not been properly authenticated (8). Another closely related biogenic amine, hordenine (N,N-dimethyltyramine), may also be present in CA (9, 10). Wheaton and Stewart elucidated the biosynthetic pathway of p-synephrine from tyramine in citrus species (11). Structures of the 6 biogenic amines of interest are presented in Figure 1.
Figure 1.
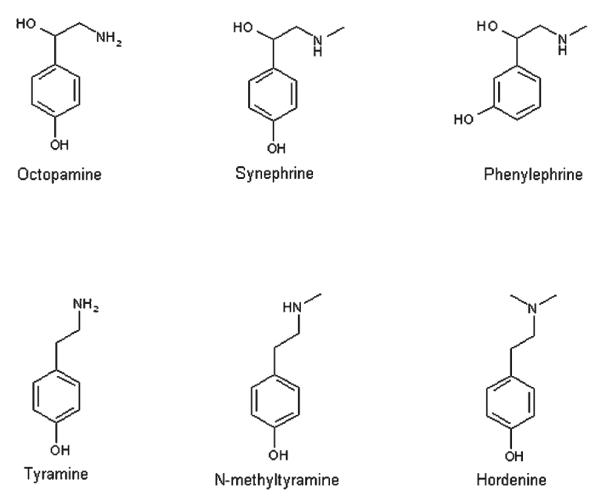
Structures of biogenic amines.
Synephrine is a sympathomimetic compound that has been shown to have effects on the cardiovascular system through adrenergic stimulation (12, 13), and it may help reduce body fat in humans through a thermogenic action (9, 14, 15). A significant number of dietary supplements used for weight management claim to contain extracts of CA standardized to synephrine. There is some evidence that use of dietary supplements containing extracts of CA can cause increases in blood pressure and heart rate (16) and incidences of myocardial infarction (17), and CA has been implicated in adverse cardiovascular reactions (18), although currently data are insufficient to support any of these adverse events.
Because of the possible health concerns associated with the use of dietary supplements containing CA, it is desirable to have an analytical method capable of determining the levels of synephrine and the other biogenic amines in both CA raw materials and finished products. Several methods have been published for the determination of one or more of the biogenic amines in various matrixes. These methods include capillary electrophoresis for the separation of d-synephrine, l-synephrine, d-octopamine, l-octopamine, tyramine, N-methyltyramine, and hordenine (10); reversed-phase column high-performance liquid chromatography (RP-LC) for the determination of octopamine, synephrine, and tyramine (6); column-switching cation-exchange LC with scanning-wavelength ultraviolet (UV) and fluorescence detection for the determination of ephedrine alkaloids and synephrine (19); ion-pairing LC for the determination of octopamine and synephrine/phenylephrine (7); and ion-exchange chromatography for the separation of p-synephrine, octopamine, hordenine, tyramine, and N-methyltyramine (20). None of these methods, however, has demonstrated the ability to separate and quantify all 6 compounds of interest, and most have very limited validation data.
A method capable of separating all 6 biogenic amines of interest in CA raw materials (ground botanical and extracts) and dietary supplement products that contain CA extract was developed and validated. The method uses aqueous extraction followed by mixed-mode RP/ion-pairing LC with UV detection. The biogenic amines are very polar compounds with poor retention in traditional RP systems, necessitating the use of an anionic ion-pairing agent to achieve retention. Several different ion-pairing agents were investigated for suitability. It was determined that using an acidic mobile phase in conjunction with the ion-pairing agent resulted in coelution of at least 2 of the analytes of interest, independent of organic solvent concentration or ion-pairing agent concentration. Adjustment of the mobile phase to a pH near the pKa values of the analytes allowed resolution of all 6 amines. Detection and quantification was achieved at 224 nm, the UV absorbance maximum of synephrine. The accuracy, repeatability, linearity, range, selectivity, and ruggedness of the method were demonstrated.
Experimental
Samples
Immature dried whole fruit labeled as “C. aurantium” and a powdered dry extract labeled as “C. aurantium” standardized to contain 30% synephrine were obtained from Nutratech (Pompton Plains, NJ). No voucher specimen was available for these materials, however, they were representative of materials in commerce. Powdered, lyophilized bitter orange raw material and a powdered bitter orange fruit extract were obtained from the National Institute of Standards and Technology (NIST; Gaithersburg, MD). Three supplement products were purchased from local retail establishments. Two products were purchased in June 2003, and one product was purchased in December 2005. The ingredients listed on the label of Product A (tablets) were Ma Huang, guarana seed, CA, and white willow bark extracts. (Note: This product is no longer available.) Product B (2 piece hard gelatin capsules) was labeled to contain a propriety blend of CA fruit extract, St. John’s wort extract, l-phenylalanine, green tea leaf extract, quercetin, citrus bioflavonoid complex, ginger root, and cayenne root. Listed ingredients for Product C (2 piece hard gelatin capsules) were Garcinia cambogia extract, glucomannan, alpha lipoic acid, willow bark extract (purple and white), l-carnitine, green tea leaf extract, caffeine, and guarana seed extract. Product C was used as a matrix blank. Labeled ingredient claims of the dietary supplements were not verified.
Apparatus
(a) LC system.—Dionex Summit (Dionex Corp., Sunnyvale, CA) or Agilent 1100 LC (Agilent Technologies Inc., Palo Alto, CA) systems with quaternary (low-pressure mixing) gradient pumps, autosampler, temperature-controlled column compartment, and variable wavelength UV detector. Systems were controlled and data collected and analyzed by Dionex Chromeleon software (ver. 6.6). The liquid chromatograph was operated under the following conditions: mobile phase flow rate, 0.85 mL/min; column temperature, 35°C; injection volume, 20 μL; detection, 224 nm.
(b) LC column.—Luna C18(2), 3.0 × 150 mm, 5 μm particle size (Phenomenex, Torrance, CA).
(c) Analytical balance.—Model AT201 (Mettler Toledo, Columbus, OH) and Model 250D (Ohaus, Florham, NJ), ±0.01 mg readability.
(d) Microbalance.—Model MT5, ±0.001 mg readability (Mettler).
(e) Ultrasonic bath.—Model 150D (VWR International, S. Plainfield, NJ).
(f) pH meter.—Model pH 500, ±0.01 pH unit readability (Oakton, Vernon Hills, IL).
(g) PTFE syringe filters.—Phenex, 0.45 μm × 25 mm (Phenomenex).
(h) Benchtop centrifuge.—Drucker variable speed (Phillipsburg, PA).
(i) Mobile phase filtration apparatus.—Equipped with a 0.2 μm nylon membrane filter (Sigma-Aldrich, St. Louis, MO).
(j) Laboratory micro-mill.—Bel-Art (Pequannock, NJ).
Reference Standards
All purities were obtained from the supplier’s certificate of analysis and were determined by chromatographic purity, water content, and residual solvent content. No independent confirmation of the purity was performed.
(a) p-Synephrine.—99.9% purity (ChromaDex, Santa Ana, CA).
(b) Octopamine HCl.—89.3% purity (ChromaDex).
(c) Phenylephrine HCl.—99.2% purity (Sigma-Aldrich).
(d) Tyramine HCl.—100% purity (ChromaDex).
(e) N-methyltyramine.—99.5% purity (ChromaDex).
(f) Hordenine sulfate.—92.1% purity (ChromaDex).
Reagents and Solvents
(a) Solvents.—Acetonitrile (Pharmco, Brookfield, CT), methanol (Pharmco), water (in-house), LC grade.
(b) Phosphoric acid, 85%.—ACS reagent grade (Sigma-Aldrich).
(c) Sodium 1-hexanesulfonate (HSA).—For ion-pairing chromatography (TCI, Tokyo, Japan).
(d) Boric acid.—ACS reagent grade (Sigma-Aldrich).
(e) Potassium hydroxide, 85%.—ACS reagent grade (Sigma-Aldrich).
(f) 5 M Potassium hydroxide in water.—Dissolve 28.0 g KOH in 100 mL water and allow to equilibrate to room temperature.
(g) 20 mM Borate buffer, pH 8.2.—Dissolve 4.8 g boric acid in 4 L water and adjust the pH to 8.2 (±0.05) with 5 M KOH.
(h) 0.1% Phosphoric acid in water.—Add 1.0 mL of 85% H3PO4 to 1 L water and mix well.
(i) Mobile phase A (10 mM hexanesulfonate in borate buffer).—Dissolve 1.86 g HSA in 1.0 L of 20 mM borate buffer, pH 8.2. Filter through a 0.2 μm nylon membrane filter.
(j) Mobile phase B [20 + 80 (v/v) acetonitrile–borate buffer + 10 mM hexanesulfonate].—Mix 200 mL acetonitrile with 800 mL of 20 mM borate buffer, pH 8.2. Dissolve 1.86 g HSA in the solution and filter through a 0.2 μm nylon membrane filter.
Preparation of Test Solutions
(a) Stock standard solution.—Accurately weigh about 13 mg each of octopamine HCl, phenylephrine HCl, tyramine HCl, and hordenine sulfate, and 10 mg each of p-synephrine and N-methyltyramine, and transfer into a 100 mL volumetric flask. Add 5 mL methanol and 25 mL water to the flask, and sonicate for 5 min. Allow to cool to room temperature, then dilute to volume with water. This solution contains about 100 μg/mL of each compound calculated as the free base.
(b) Instrument calibration solutions.—Prepare serial dilutions of the stock standard solution in water at concentrations of about 1, 5, 10, 20, and 50 μg/mL of each compound calculated as the free base.
(c) Botanical raw materials.—If necessary, grind the whole dried fruit to a powder that passes through a 60 mesh sieve using a laboratory micro-mill. Accurately weigh about 300 mg powdered fruit and transfer into a 100 mL volumetric flask. Add 50 mL of 0.1% H3PO4 in water, and sonicate the slurry for 1 h. Allow the solution to cool to room temperature and dilute to volume with 20 mM borate buffer, pH 8.2. Mix the resulting material well, and centrifuge a 15 mL portion for 10 min. Transfer an aliquot of the supernatant solution into an LC autosampler vial for analysis.
(d) Powdered extracts.—Accurately weigh about 100 mg powdered bitter orange raw material extract and transfer into a 100 mL volumetric flask. Add 50 mL of 0.1% H3PO4 in water and sonicate the slurry for about 15 min. After cooling to room temperature, dilute the mixture to volume with 20 mM borate buffer, pH 8.2, and mix well. Filter an aliquot of the resulting solution through a 0.45 μm PTFE syringe filter into an LC autosampler vial. (Note: If the synephrine concentration in the sample extract is >10%, a dilution must be made by pipetting 10 mL of the stock sample solution into a 50 mL volumetric flask and diluting to volume with 20 mM borate buffer, pH 8.2.)
(e) Dietary supplement capsules.—Empty the contents of 20 whole capsules, and mix the fill material well. Weigh about 300 mg capsule fill material into a 100 mL volumetric flask. Add 50 mL of 0.1% H3PO4 in water and sonicate the slurry for about 15 min. After cooling to room temperature, dilute the mixture to volume with 20 mM borate buffer, pH 8.2, and mix well. Centrifuge a 15 mL portion for 10 min, and transfer an aliquot of the supernatant into an LC autosampler vial for analysis.
(f) Dietary supplement tablets.—Grind 20 tablets in a laboratory micro-mill to a fine powder so that it passes through a 60 mesh screen. Weigh about 300 mg powdered tablet material into a 100 mL volumetric flask. Add 50 mL of 0.1% H3PO4 in water and sonicate the slurry for about 15 min. After cooling to room temperature, dilute the mixture to volume with 20 mM borate buffer, pH 8.2, and mix well. Centrifuge a 15 mL portion for 10 min, and transfer an aliquot of the supernatant into an LC autosampler vial for analysis.
Determination
(a) Mobile phase gradient program.—Elute the analytes with a linear gradient program starting at 100% Mobile Phase A (0 min) and ending at 100% Mobile Phase B (30 min). The column should be re-equilibrated at the starting mobile phase conditions for at least 7 min after each injection.
(b) System suitability tests.—Make duplicate injections of the stock standard solution and each calibration standard. The correlation coefficient of the calibration line for each biogenic amine must be >0.999. The relative standard deviation (RSD) of the calibration curve is no more than 3.0% for each biogenic amine. The resolution between phenylephrine and tyramine in the first stock standard solution injection must be not less than 1.0. The tailing factor, calculated at 5% peak height, must be no more than 1.7 for synephrine in the first stock standard solution chromatogram.
(c) Injection.—Make single injections of each standard and test solution. After every 20 sample injections, and after all of the sample injections are completed, make a single injection of each standard solution.
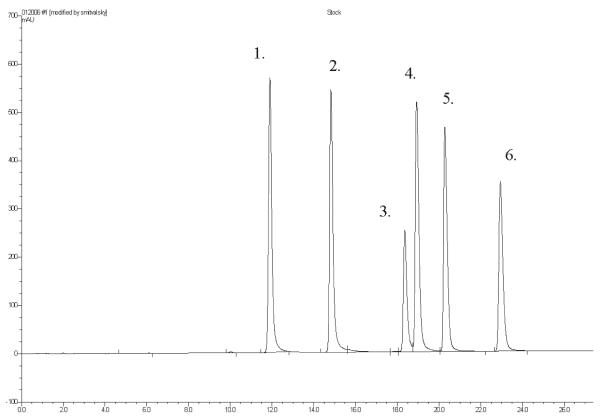
(d) Retention times.—The approximate retention times for each analyte are presented in Figure 2.
Figure 2.
Stock standard solution chromatogram peak assignments and approximate retention times: (1) Octopamine (11.7 min), (2) p-synephrine (14.6 min), (3) phenylephrine (18.0 min), (4) tyramine (18.7 min), (5) N-methyltyramine (20.1 min), and (6) hordenine (22.8 min).
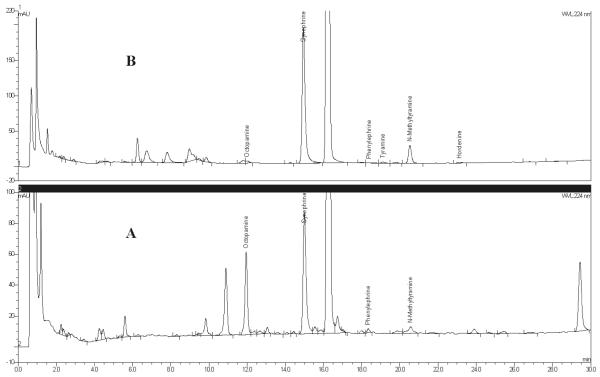
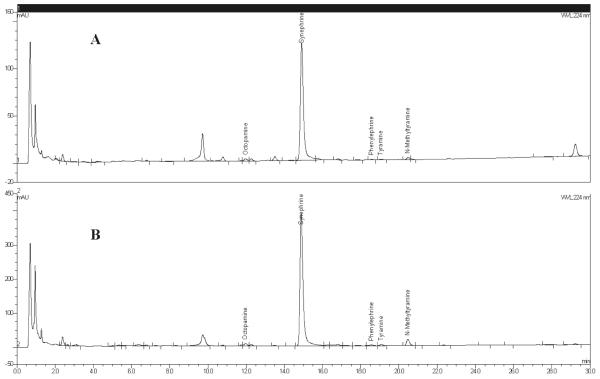
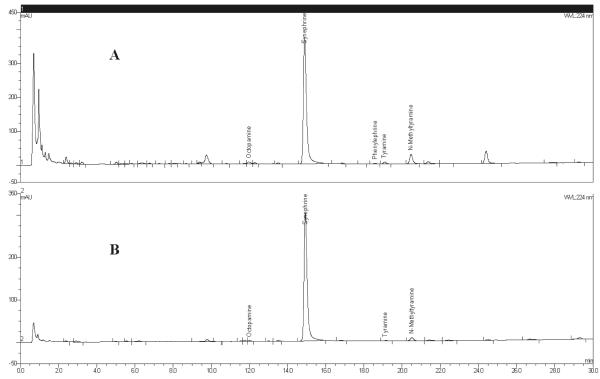
(e) Chromatograms.—Representative standard and sample chromatograms are presented in Figures 2–5.
Figure 5.
Dietary supplement finished products containing bitter orange chromatograms: (A) Product A dietary supplement capsules and (B) Product B dietary supplement tablets.
Calculations
(a) Calculation of free base standard concentrations.—In order to calculate the concentration of each biogenic amine in the standard solutions, the weight of each standard must be converted to the free base form using a molecular weight conversion. The weight of the free base is calculated using the following equation:
| (1) |
where w = mass of the standard, in mg; FB = molecular weight of the compound as a free base (Table 1); S = molecular weight of the salt form of the standard (Table 1); and P = purity of the standard.
Table 1.
Molecular weight conversion table
| Compounda | MW of free base |
MW of salt | FB/S ratio |
|---|---|---|---|
| Octopamine HCl | 153.18 | 189.64 | 0.80774 |
| Phenylephrine HCl | 167.21 | 203.67 | 0.82098 |
| Tyramine HCl | 137.18 | 173.65 | 0.78998 |
| Hordenine sulfate | 165.24 | 214.29 | 0.77110 |
Synephrine and N-methyltyramine standards are already in the free base form, therefore, no conversion is necessary (i.e., the FB/S = 1).
(b) Concentration of standards in stock standard solution.—The concentration (C) of each standard in the stock standard solution, in μg/mL, is calculated using the following equation:
| (2) |
where w = mass of the standard, calculated as the free base (Equation 1); 100 = dilution volume, in mL; and 1000 = conversion factor from mg to μg.
(c) Percent (w/w).—The percent of each biogenic amine in raw material and extract samples is calculated using the following equation:
| (3) |
where A = peak area of biogenic amine “i” in the sample chromatogram; b = y-intercept of calibration curve for biogenic amine “i”; m = slope of calibration curve for biogenic amine “i”; 100 = sample volume, in mL; W = mass of sample, in mg; D = dilution factor (if needed); and 1000 = conversion from μg to mg.
(d) Milligrams/capsule or tablet.—The milligrams of each biogenic amine/capsule or tablet in dietary supplements are calculated using the following equation:
| (4) |
where A = peak area of biogenic amine “i” in the sample chromatogram; b = y-intercept of calibration curve for biogenic amine “i”; m = slope of calibration curve for biogenic amine “i”; 100 = sample volume, in mL; W = weight of sample, in mg; DW = average dosage weight (capsule fill weight or tablet weight); and 1000 = conversion from μg to mg.
Validation Design
Linearity
The stock standard solution and each calibration dilution were each injected at the beginning of each chromatographic injection sequence, after every 20 sample injections, and at the end of each sequence. A 6-point standard curve was generated for each analyte, and the slope, y-intercept, correlation coefficient, and % RSD of the standard curve were calculated for each analyte on each day.
Accuracy
Botanical raw materials
Spike recovery studies have significant limitations when determining method accuracy for a botanical raw material. Negative controls that closely resemble the botanical material of interest may not exist; in this case, it was not possible to find a citrus species that did not contain any of the biogenic amines in measurable quantities. In addition, spiking of the analytes occurs only on the surface of the material, whereas the analytes in nature occur within the cellular matrix of the botanical. Therefore, incomplete extraction of the analytes from the botanical matrix may not be apparent using simple spike recovery studies.
Because of limitations in spike recovery results with botanical raw materials, the 2 botanical raw material samples used in the study were exhaustively extracted with a Dionex accelerated solvent extraction (ASE) instrument to obtain a reference value with which to compare the proposed sample extraction procedure. The conditions for the ASE were first optimized for solvent composition, extraction temperature, and number of extractions. Each raw material required different extraction conditions to achieve complete extraction of the biogenic amines, possibly because the NIST material was lyophilized while the Nutratech material was not.
Each material was weighed and transferred into 11 mL extraction cells containing 1.2 g diatomaceous earth. The cells were capped and the contents mixed well. The void volume of the cells was then filled with Ottawa sand (EMD Chemicals, Darmstadt, Germany). The NIST material was extracted twice with methanol using the conditions specified in Table 2, Column A, then extracted once with 0.1% H3PO4 in water using the conditions specified in Table 2, Column B. All 3 extraction solutions were combined in a single 60 mL amber collection vial. The contents of the collection vial were then quantitatively transferred into a 100 mL volumetric flask and diluted to volume with 20 mM borate buffer, pH 8.2. Five replicate samples were prepared in this manner.
Table 2.
ASE conditions
| A |
B |
|
|---|---|---|
| Solvent | Methanol | 0.1% H3PO4 in water |
| Temperature, °C | 90 | 110 |
| Heating time, min | 5 | 6 |
| Static time, min | 3 | 3 |
| Flush volume, % | 100 | 100 |
| Purge time, s | 30 | 30 |
The Nutratech material was extracted twice with 0.1% H3PO4 in water using the conditions specified in Table 2, Column B, then extracted once with methanol using the conditions specified in Table 2, Column A. All 3 extraction solutions were combined in a single 60 mL amber collection vial. The contents of the collection vial were then quantitatively transferred into a 100 mL volumetric flask and diluted to volume with 20 mM borate buffer, pH 8.2. Five replicate sample preparations were performed in this manner.
The average value and RSD of each biogenic amine from the 5 replicate sample preparations of each material were calculated, and results obtained using the sonication extraction technique were compared to these reference values.
Spike recovery of dietary supplement finished products
About 300 mg homogenized Product C capsule fill material was transferred into 10 separate 100 mL volumetric flasks. One (1.00) mL stock standard solution used for the calibration was pipetted into 3 of the flasks (low spike, 300 μg/g of each compound). Five (5.00) mL stock standard solution was pipetted into an additional 3 flasks (middle spike, 1500 μg/g of each compound). A stock spiking solution containing about 50 μg/mL of each compound was prepared, and 5.00 mL of this spiking solution was pipetted into a third set of 3 flasks (high spike, 16 700 μg/g of each compound). The 10th flask was left unspiked. Because of limited quantities of N-methyltyramine standard, accuracy for this compound was only determined up to about 6000 μg/g.
Repeatability
Five replicates of each of the 6 materials (2 raw material powders, 2 powdered extracts, and 2 dietary supplement finished products) were prepared on each of 4 days, for a total of 20 replicate preparations of each material. The within-day, between-day, and total repeatability were calculated. The HorRat value (21) for each material was also calculated.
Ruggedness
Analyses were performed on 2 different LC systems (Dionex Summit and Agilent 1100) by 2 different analysts. In addition, 2 different lots of C18 columns were used, and results obtained using a different brand of C18 column were also compared. The primary column was a Phenomenex Luna C18(2), 3.0 × 150 mm, 5 μm particle size. A Nacalai Cosmosil 5C18-MS-II, 4.6 × 150 mm, was also used; the mobile phase flow was adjusted to 2.0 mL/min for this column to account for the increased diameter.
Systematic changes in ion-pairing concentration, organic modifier concentration, mobile phase pH, and column temperature were also performed, and their effects on the separation and run time were observed (Table 3).
Table 3.
Ruggedness testing
| Parameter | Conditions |
|---|---|
| Ion-pairing concentration, mM | 5, 10, 20, 30 |
| Organic modifier concentration, % | 10, 20, 30 |
| Mobile phase pH | 4.0, 5.0, 6.0, 7.0, 8.0, 8.2 |
| Column temperature, °C | 25, 30, 35 |
| Ion-pairing agents | Hexanesulfonic acid, dodecylsulfonic acid |
Selectivity
Selectivity of the method was confirmed by photodiode array (PDA) detection, and by injecting the dietary supplement matrix blank.
Results and Discussion
Selectivity
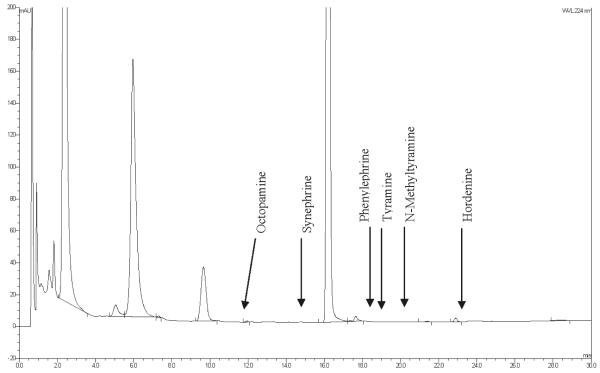
The selectivity of the method was demonstrated by injecting each of the reference standards to show resolution between all of the standards, and injecting the negative control dietary supplement to show no interfering peaks above the limit of quantification (LOQ) of the method. PDA detector analysis was used to ensure the peak purity of synephrine, octopamine, and N-methyltyramine in representative sample solutions. Because of the very low amounts of the other components sometimes found in the materials, confirmation of the identity of these analytes by UV spectra was not possible. The detection wavelength (224 nm) was selected based on PDA detector analysis of all the standards; all compounds except for phenylephrine exhibited UV absorption maxima between 222–226 nm. Phenylephrine’s UV absorption maximum was at 216 nm. All compounds absorb very poorly above 230 nm. Typical standard and sample chromatograms are presented in Figures 2–5. The negative control chromatogram is presented in Figure 6. Although not a constituent of bitter orange, caffeine is a major component in many bitter orange weight loss dietary supplement products. Caffeine elutes after synephrine, at about 15 min, and is the large off-scale peak present in Figures 5 and 6. It does not interfere with quantification of any of the analytes.
Figure 6.
Product C negative control chromatogram.
During the course of the validation, it was noted that peak identification and integration must be carefully evaluated to ensure accurate identification. Minor components in the samples, particularly in the finished product dietary supplements, could be mistakenly identified as one of the biogenic amines by the chromatography software; for that reason, comparison with standard retention times must be performed to prevent misidentification.
Linearity
A 6-point calibration curve covering 2 orders of magnitude in concentration range was generated for each day of analysis. Linear regression was used to calculate the slope and y-intercept of the standard curve for each analyte. The correlation coefficient and RSD of each standard curve for each day was determined. The data showed standard curves were linear from a concentration of about 1 μg/mL to about 100 μg/mL for each analyte. Table 4 summarizes the linearity data. Figure 7 presents a typical residual plot for synephrine, with residuals expressed as a percent. The residual plot does not show any trend; the largest residual is at the lowest concentration, which is near the LOQ for the method.
Table 4.
Linearity data
| Day 1 |
Day 2 |
Day 3 |
Day 4 |
|||||
|---|---|---|---|---|---|---|---|---|
| Compound | ra | RSD, % | r | RSD, % | r | RSD, % | r | RSD, % |
| Octopamine | 0.99988 | 1.6 | 0.99984 | 1.9 | 0.99986 | 1.7 | 0.99972 | 2.7 |
| Synephrine | 0.99996 | 0.95 | 0.99992 | 1.3 | 0.99997 | 0.83 | 0.99992 | 1.4 |
| Phenylephrine | 0.99998 | 0.56 | 0.99999 | 0.53 | 0.99998 | 0.62 | 0.99993 | 1.3 |
| Tyramine | 0.99993 | 1.2 | 0.99989 | 1.6 | 0.99985 | 1.8 | 0.99985 | 2.0 |
| N-methyltyramine | 0.99998 | 0.72 | 0.99997 | 0.82 | 0.99992 | 1.3 | 0.99992 | 1.5 |
| Hordenine | 0.99990 | 1.4 | 0.99999 | 0.54 | 0.99992 | 1.3 | 0.99995 | 1.1 |
r = Correlation coefficient.
Figure 7.
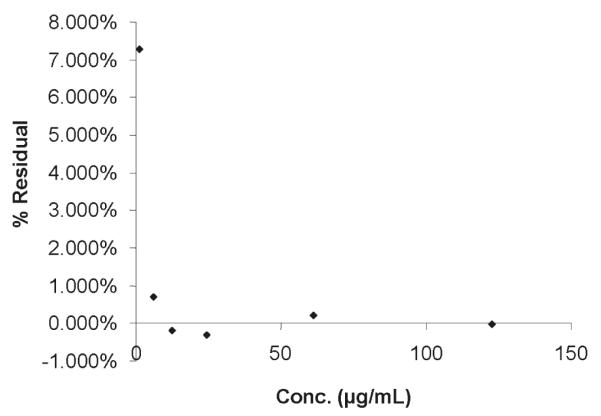
Synephrine linearity residual plot.
Accuracy
Botanical raw material
The average values of the 5 replicate determinations for each botanical raw material obtained using the Dionex ASE instrument for each biogenic amine were used as reference values. For the NIST material, octopamine, phenylephrine, tyramine, N-methyltyramine, and hordenine were below the LOQ of the method using ASE, as determined by the spike recovery studies; therefore, results for these compounds are not reliable for this material. The average synephrine result was 8610 μg/g using ASE, with a 1.5% RSD for the 5 replicate preparations. The average synephrine result for the NIST bitter orange raw material using the proposed sonication extraction procedure was 8290 μg/g, for a recovery of 96.3%. This recovery is within acceptable guidelines for this concentration of analyte in the matrix. Table 5 summarizes the accuracy results for the NIST bitter orange raw material.
Table 5.
NIST bitter orange fruit powder recovery
| Compound | ASE, μg/g | Sonication, μg/g | Recovery, % | RSDa, % |
|---|---|---|---|---|
| Octopamine | 158b | 148b | 93.6b | 9.25 |
| Synephrine | 8610 | 8270 | 96.0 | 1.30 |
| Phenylephrine | 193b | NDc | 0 | NAd |
| Tyramine | 75b | NDc | 0 | NAd |
| N-methyltyramine | 146b | NDc | 0 | NAd |
| Hordenine | 22b | NDc | 0 | NAd |
RSD = Relative standard deviation; estimated from 5 replicate sample preparations.
Result below the limit of quantification for the method.
ND = None detected.
NA = Not applicable.
For the Nutratech CA raw material, phenylephrine, tyramine, and hordenine were below the LOQ of the method using both ASE and the proposed extraction method. The average synephrine result was 27 000 μg/g using ASE, with a 4.1% RSD for the 5 replicate preparations. The average synephrine result for the Nutratech CA raw material using the proposed sonication extraction procedure was 26 100 μg/g, for a recovery of 96.7%. The average octopamine result was 554 μg/g using ASE, with a 3.7% RSD for the 5 replicate preparations. The average octopamine result for the Nutratech CA raw material using the proposed extraction method was 576 μg/g, for a recovery of 104%. The average N-methyltyramine result was 1200 μg/g using ASE, with a 4.3% RSD for the 5 replicate preparations. The average N-methyltyramine result for the Nutratech CA raw material using the proposed extraction method was 1320 μg/g, for a recovery of 110%. Table 6 summarizes the accuracy results for the Nutratech raw material.
Table 6.
Nutratech C. aurantium fruit powder recovery
| Compound | ASE, μg/g | Sonication, μg/g | Recovery, % | RSDa, % |
|---|---|---|---|---|
| Octopamine | 554 | 514 | 92.8 | 1.57 |
| Synephrine | 27000 | 26600 | 98.5 | 1.49 |
| Phenylephrine | 346b | 231b | 66.6 | 2.65 |
| Tyramine | 161b | 184b | 114 | 10.3 |
| N-methyltyramine | 1220 | 1253 | 103 | 2.39 |
| Hordenine | 104b | NDc | 0 | NAd |
RSD = Relative standard deviation; estimated from 5 replicate sample preparations.
Result below the limit of quantification for the method.
ND = None detected.
NA = Not applicable
Based upon these results, this method has acceptable recovery compared with an exhaustive extraction using the Dionex ASE instrument for synephrine, octopamine, and N-methyltyramine. The levels of phenylephrine, tyramine, and hordenine were too low to calculate recoveries, and minor interferences may have contributed to false positives when identifying these components in the raw materials (any false positives were below the LOQ). The estimated LOQ for synephrine, octopamine, tyramine, N-methyltyramine, and hordenine was about 300 μg/g in the raw material. The estimated LOQ for phenylephrine was about 600 μg/g in the raw material. Based upon these results, it can be concluded that CA does not contain phenylephrine at levels above 600 ppm in the dried fruit, and the compound identified by Penzak et al. (7) as phenylephrine in Seville orange was, most likely, p-synephrine.
Dietary supplements
Spike recovery studies were used to determine the recovery of the biogenic amines from a complex dietary supplement matrix. Product C was selected as a negative control (matrix blank), as it is labeled to contain a number of different botanical extracts commonly found in weight-loss supplements but does not contain bitter orange. Recoveries at the 300 μg/g level ranged from 90.7% for N-methyltyramine to 120% for phenylephrine. Recoveries at the 16 700 μg/g level (6000 μg/g for N-methyltyramine), ranged from 95.9% for tyramine to 99.1% for hordenine. All values were within acceptable ranges. Tables 7–9 summarize the accuracy results for the dietary supplement spike recovery study.
Table 7.
Recovery of biogenic amines from dietary supplement negative control (low level)
| Compound | Amount added, μg | Amount recovered, μg | Recovery, % | RSDa, % |
|---|---|---|---|---|
| Octopamine | 101.6 | 101.1 | 99.5 | 1.24 |
| Synephrine | 111.5 | 115.8 | 104 | 1.36 |
| Phenylephrine | 107.1 | 128.8 | 120 | 3.44 |
| Tyramine | 99.73 | 117.1 | 117 | 0.52 |
| N-methyltyramine | 84.94 | 77.0 | 90.7 | 1.12 |
| Hordenine | 89.98 | 96.15 | 107 | 4.95 |
RSD = Relative standard deviation; estimated from triplicate determinations.
Table 9.
Recovery of biogenic amines from dietary supplement negative control (high level)
| Compound | Amount added, μg | Amount recovered, μg | Recovery, % | RSDa, % |
|---|---|---|---|---|
| Octopamine | 3946 | 3903 | 98.9 | 0.554 |
| Synephrine | 5080 | 4991 | 98.3 | 0.439 |
| Phenylephrine | 4802 | 4664 | 97.1 | 0.349 |
| Tyramine | 4628 | 4438 | 95.9 | 0.298 |
| N-methyltyramine | 751.2 | 737.7 | 98.2 | 0.441 |
| Hordenine | 3737 | 3703 | 99.1 | 0.387 |
RSD = Relative standard deviation; estimated from triplicate determinations.
Repeatability
Only p-synephrine, octopamine, and N-methyltyramine were found to be above the LOQ in the samples. Chromatograms were examined carefully to ensure correct identification of minor components and reproducible integration. Within-day, between-day, and total standard deviations were calculated for these 3 compounds using single-factor analysis of variance (ANOVA) with a significance level (α-value) of 0.5 (95% confidence interval).
The method exhibited excellent repeatability for synephrine, the predominant analyte in each material. Repeatability RSDs ranged from 1.48 to 3.55%, with HorRat values ranging from 0.36 to 0.99. Table 10 summarizes the repeatability results for synephrine in each material. Results are the average of all 20 sample preparations.
Table 10.
Synephrine repeatability results
| Materiala | nb | Result, μg/g | SDc, μg/g | RSD, % | PRSDd, % | HorRat |
|---|---|---|---|---|---|---|
| A | 20 | 8290 | 123 | 1.48 | 4.10 | 0.36 |
| B | 20 | 26110 | 439 | 1.68 | 3.46 | 0.49 |
| C | 20 | 66580 | 1585 | 2.36 | 3.00 | 0.79 |
| D | 20 | 292300 | 6898 | 2.37 | 2.41 | 0.99 |
| E | 20 | 11980 | 432 | 3.55 | 3.88 | 0.91 |
| F | 20 | 4686 | 80.3 | 1.71 | 4.47 | 0.38 |
A = NIST bitter orange fruit powder, B = Nutratech C. aurantium dried fruit, C = NIST bitter orange extract 6% synephrine, D = Nutratech C. aurantium extract 30% synephrine, E = Product A capsules, F = Product B tablets.
n = Total number of samples tested.
SD = Standard deviation.
PRSD = Predicted relative standard deviation.
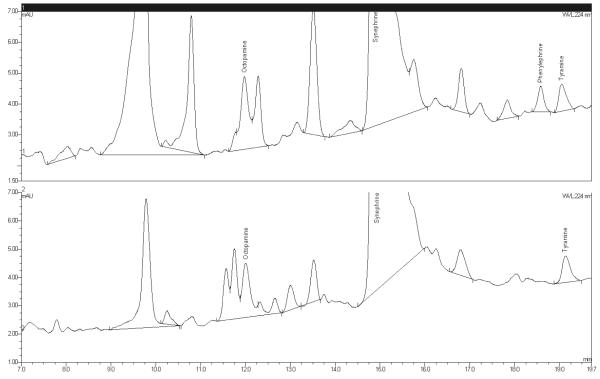
The method showed generally poor between-day repeatability for octopamine. Much of the variance can be attributed to the presence of minor unknown components that interfered to varying degrees on different days. Because the amount of octopamine found in the samples was often near the LOQ of the method (based on recovery studies), these minor interferences could significantly affect the relative peak areas of octopamine in the samples. Figure 8 presents expanded chromatograms showing the presence of these components. The small peak that appears on the tail of the peak synephrine accounts for only about 0.1% of the total peak area of synephrine. Table 11 summarizes the repeatability results for octopamine. Based upon these results, this method is not recommended for quantifying octopamine at the low levels naturally present in bitter orange raw materials and extracts. Considering the acceptable results in the spike recovery data, this method may be suitable for the determination of octopamine in finished product dosage forms that contain synthetic octopamine HCl; however, materials of this type were not included in the validation study.
Figure 8.
Expanded chromatograms showing octopamine interferences.
Table 11.
Octopamine repeatability results
| Materiala | nb | Result, μg/g | SDc, μg/g | RSD, % | PRSDd, % | HorRat |
|---|---|---|---|---|---|---|
| A | 20 | 268 | 307 | 100 | 6.87 | 15 |
| B | 20 | 542 | 116 | 21 | 6.18 | 3.5 |
| C | 20 | 1436 | 388 | 27 | 5.34 | 5.0 |
| D | 20 | 4887 | 1780 | 38 | 4.44 | 8.6 |
| E | 20 | 266 | 143 | 48 | 6.88 | 7.0 |
| F | 19 | 1139 | 1055 | 93 | 5.53 | 17 |
A = NIST bitter orange fruit powder, B = Nutratech C. aurantium dried fruit, C = NIST bitter orange extract 6% synephrine, D = Nutratech C. aurantium extract 30% synephrine, E = Product A capsules, F = Product B tablets.
n = Total number of samples tested.
SD = Standard deviation.
PRSD = Predicted relative standard deviation.
N-methyltyramine was found in all samples above the quantification limit, except for the NIST bitter orange fruit powder and dietary supplement Product A. The Nutratech CA powdered fruit material contained 1320 μg/g N-methyltryamine, with a HorRat of 0.68. The NIST bitter orange extract was found to contain 5460 μg/g N-methyltyramine, with a HorRat of 2.3. The Nutratech CA extract was found to contain 9330 μg/g N-methyltyramine, with a HorRat of 4.4. The Metabolift Slim dietary supplement was found to contain 1670 μg/g N-methyltyramine, with a HorRat of 1.7. Table 12 summarizes the repeatability results for N-methyltyramine determination.
Table 12.
N-methyltyramine repeatability results
| Materiala | nb | Result, μg/g | SDc, μg/g | RSD, % | PRSDd, % | HorRat |
|---|---|---|---|---|---|---|
| A | 20 | <300 | NA | NA | NA | NA |
| B | 20 | 1321 | 48.8 | 3.70 | 5.41 | 0.68 |
| C | 20 | 5464 | 575 | 10.2 | 4.37 | 2.3 |
| D | 20 | 9326 | 1960 | 19.5 | 4.03 | 4.8 |
| E | 20 | 1667 | 156 | 8.95 | 5.22 | 1.7 |
| F | 20 | <300 | NA | NA | NA | NA |
A = NIST bitter orange fruit powder, B = Nutratech C. aurantium dried fruit, C = NIST bitter orange extract 6% synephrine, D = Nutratech C. aurantium extract 30% synephrine, E = Product A capsules, F = Product B tablets.
n = Total number of samples tested.
SD = Standard deviation.
PRSD = Predicted relative standard deviation.
Phenylephrine, tyramine, and hordenine were not detected in any samples above the LOQ.
It is believed that the repeatability of the method could be improved for the minor components by reducing the range of the standard curve, as no samples in the study contained any of the minor components above 14 000 ppm. The broad range of the calibration curves (2 orders of magnitude in concentration) resulted in increased residuals at the lowest calibration point. Solid-phase extraction cleanup using strong cation-exchange cartridges, while possibly removing potential inferences, was observed to decrease recovery of the analytes in varying degrees, depending on the extent of substitution on the amine group. Use of a higher wavelength, such as 254 or 280 nm, would significantly increase the limit of detection (LOD) and LOQ values, because the molar absorptivities at these wavelengths were several orders of magnitude lower than at 224 nm.
Ruggedness
Variables affecting both extraction efficiency and chromatographic separation were investigated. Different extraction solvents (water; 20 mM borate buffer, pH 8.2; 0.1% H3PO4 in water; and methanol) were used to study the effect of pH and organic solvent composition on the extraction efficiency. It was determined that an acidic aqueous extraction solvent was required to ensure optimum extraction of the analytes. Using basic or neutral water as the primary extraction solvent decreased recoveries by up to 10%. In addition, it was determined that after extraction by acidic water, samples had to be diluted with basic diluent to prevent severe peak fronting or splitting of the octopamine peak.
Sample weights were intentionally varied during the repeatability study by ±10% of the target weight. No correlation between sample weight and extraction efficiency was determined for any of the materials.
Analyses were performed on 3 different LC systems from 2 different manufacturers (Dionex Summit and Agilent 1100). No differences in performance were observed between the 2 instruments made by different manufacturers.
Method validation was conducted with 2 different Phenomenex Luna C18(2) columns made from different batches of material. No difference in separation performance was observed between the 2 columns. Table 13 presents the chromatographic performance for each of the columns. In addition, a Nacalai Cosmosil 5C18-MS-II column, 4.6 × 150 mm, was also evaluated; the mobile phase flow was adjusted to 2.0 mL/min for this column to account for the increased column diameter. This column was not used, however, for accuracy/repeatability studies. The separation was shown to be repeatable on this column with comparable performance to the Phenomenex columns.
Table 13.
Column performance comparison
| Column Lot No. | Analyte | Resolution (USP)a | Asymmetry (USP) | Plates (USP) |
|---|---|---|---|---|
| 5291-64 | Octopamine | 12.34 | 1.25 | 31033 |
| Synephrine | 3.02 | 1.49 | 41787 | |
| Phenylephrine | 2.56 | 1.60 | 52598 | |
| Tyramine | 4.54 | 1.56 | 55680 | |
| N-methyltyramine | 9.13 | 1.76 | 52529 | |
| Hordenine | NAb | 1.73 | 53486 | |
| 5291-66 | Octopamine | 12.06 | 1.29 | 33231 |
| Synephrine | 3.43 | 1.50 | 45354 | |
| Phenylephrine | 2.12 | 1.48 | 68648 | |
| Tyramine | 4.85 | 1.60 | 66632 | |
| N-nethyltyramine | 9.06 | 1.61 | 73684 | |
| Hordenine | NA | 1.43 | 74813 |
USP = U.S. Pharmacopeia.
NA = Not applicable.
Systematic changes in ion-pairing concentration, organic modifier concentration, mobile phase pH, and column temperature were also performed, and their effects on the separation and run time observed. The most critical parameter that must be tightly controlled to ensure resolution of all 6 compounds was determined to be the mobile phase pH. Decreasing mobile phase pH reduces the resolution between phenylephrine and tyramine; increasing mobile phase pH decreases resolution between tyramine and N-methyltyramine. It is recommended that the pH of the mobile phase be maintained at 8.20 ± 0.05. Because the mobile phase pH is near the pKa values of some of the analytes, retention time drifting could be a concern during long autosampler run sequences. However, in practice, retention times drifted less than 0.2 min even for autosampler runs that were over 30 h long.
Changes in column temperature affected retention times but did not significantly affect selectivity. A temperature of 35 ± 2°C is recommended to ensure adequate retention of the analytes, while also ensuring the analytes are eluted before the end of the mobile phase gradient.
Conclusions
A method was developed and a single-laboratory validation study performed for the determination of p-synephrine in CA botanical raw materials, extracts, and dietary supplements. The method is capable of separating synephrine and 5 related biogenic amines: octopamine, phenylephrine, tyramine, N-methyltyramine, and hordenine. The method was shown to be accurate and repeatable for the determination of synephrine. Despite published reports, phenylephrine was not found in any of the CA materials used in the study. The other minor compounds were either not found in the materials or were present at low levels. Although spike recovery studies showed good accuracy for the determination of these compounds using the proposed method, repeatability studies showed high variance between days, due primarily to the presence of low levels of interfering compounds that may or may not be fully resolved.
Figure 3.
Bitter orange powdered fruit chromatograms: (A) NIST bitter orange fruit material and (B) C. aurantium powdered immature fruit material from Nutratech.
Figure 4.
Bitter orange extract chromatograms: (A) NIST bitter orange extract and (B) C. aurantium 30% synephrine extract from Nutratech.
Table 8.
Recovery of biogenic amines from dietary supplement negative control (mid level)
| Compound | Amount added, μg | Amount recovered, μg | Recovery, % | RSDa, % |
|---|---|---|---|---|
| Octopamine | 508.1 | 506.3 | 99.6 | 0.165 |
| Synephrine | 557.3 | 543.6 | 97.5 | 0.219 |
| Phenylephrine | 535.4 | 572.0 | 107 | 0.671 |
| Tyramine | 498.6 | 527.0 | 106 | 0.977 |
| N-methyltyramine | 424.7 | 436.2 | 103 | 0.673 |
| Hordenine | 449.9 | 457.3 | 102 | 0.258 |
RSD = Relative standard deviation; estimated from triplicate determinations.
Acknowledgements
This project was funded by a contract with the U.S. National Institutes of Health, Office of Dietary Supplements (Bethesda, MD).
Contributor Information
Mark C. Roman, ChromaDex, 13161 56th Ct, Suite 201, Clearwater, FL 33760
Joseph M. Betz, U.S. National Institutes of Health, Office of Dietary Supplements, 6100 Executive Blvd, Room 3B01, Bethesda, MD 20892
Jana Hildreth, Blaze Science Industries, 4547 W. 171st St, Lawndale, CA 90260.
References
- (1).Ou M. Chinese-English Manual of Commonly Used Prescriptions in Traditional Chinese Medicine. Joint Publishing Co.; Hong Kong: 1989. [Google Scholar]
- (2).Nagy S, Shaw PE, Veidhais MK. Citrus Science and Technology. Vol. 1. The AVI Publishing Co.; Bridgeport, CT: 1977. [Google Scholar]
- (3).He X, Lian L, Lin L, Bernart MW. J. Chromatogr. A. 1997;791:127–134. [Google Scholar]
- (4).Hashimoto K, Yasuda T, Ohsawa K. J. Chromatogr. 1992;623:386–389. [Google Scholar]
- (5).Kusu F, Li X, Takamura K. Chem. Pharm. Bull. 1992;40:3284–3286. [Google Scholar]
- (6).Pellati F, Benvenuti S, Melegari M, Firenzuoli F. J. Pharm Biomed. Anal. 2002;29:1113–1119. doi: 10.1016/s0731-7085(02)00153-x. [DOI] [PubMed] [Google Scholar]
- (7).Penzak SR, Jann MW, Cold JA, Hon YY, Desai HD, Gurley BJ. J. Clin. Pharmacol. 2001;41:1059–1063. doi: 10.1177/00912700122012652. [DOI] [PubMed] [Google Scholar]
- (8).Allison DB, Cutter G, Poehlman ET, Moore DR, Barnes S. Int. J. Obes. 2005;29:443–446. doi: 10.1038/sj.ijo.0802879. [DOI] [PubMed] [Google Scholar]
- (9).Haaz S, Fontaine KR, Cutter G, Limdi N, Perumean-Chaney S, Allison DB. Obes. Rev. 2006;7:79–88. doi: 10.1111/j.1467-789X.2006.00195.x. [DOI] [PubMed] [Google Scholar]
- (10).Avula B, Upparapalli SK, Khan IA. Chromatographia. 2005;62:151–157. [Google Scholar]
- (11).Wheaton TA, Stewart I. Phytochemistry. 1969;8:85–92. [Google Scholar]
- (12).Williams CM, Couch MW, Thonoor CM, Midgley JM. J. Pharm. Pharmacol. 1987;39:153–157. doi: 10.1111/j.2042-7158.1987.tb06240.x. [DOI] [PubMed] [Google Scholar]
- (13).Calapai G, Firenzuoli F, Saitta A, Squadrito F, Arlotta MR, Costantino G, Inferrera G. Fitoterapia. 1999;70:586–592. [Google Scholar]
- (14).Park JH, Keeley LL. Gen. Comp. Endocrinol. 1998;110:88–95. doi: 10.1006/gcen.1997.7053. [DOI] [PubMed] [Google Scholar]
- (15).Carpéné C, Galitzky J, Fontana E, Atgié C, Lafontan M, Berlan M. N. Schmied. Arch. Pharmacol. 1999;359:310–321. doi: 10.1007/pl00005357. [DOI] [PubMed] [Google Scholar]
- (16).Bui LT, Nguyen D, Ambrose PJ. Ann. Pharmacother. 2005;40:53–57. doi: 10.1345/aph.1G488. [DOI] [PubMed] [Google Scholar]
- (17).Nykamp DL, Fackih MN, Compton AL. Ann. Pharmacother. 2004;38:812–816. doi: 10.1345/aph.1D473. [DOI] [PubMed] [Google Scholar]
- (18).Jordan S, Murty M, Pilon K. Can. Med. Assoc. J. 2004;171:993–994. [PubMed] [Google Scholar]
- (19).Niemann RA, Gay ML. J. Agric. Food Chem. 2003;51:5630–5638. doi: 10.1021/jf0302052. [DOI] [PubMed] [Google Scholar]
- (20).Wheaton TA, Stewart I. Anal. Biochem. 1965;12:585–592. doi: 10.1016/0003-2697(65)90226-5. [DOI] [PubMed] [Google Scholar]
- (21).Horwitz W. Anal. Chem. 1982;54:67A–76A. [Google Scholar]


