Abstract
Evidence for the widespread occurrence of extraterrestrial halite, particularly on Mars, has led to speculations on the possibility of halophilic microbial forms of life; these ideas have been strengthened by reports of viable haloarchaea from sediments of geological age (millions of years). Raman spectroscopy, being a sensitive detection method for future astrobiological investigations onsite, has been used in the current study for the detection of nine different extremely halophilic archaeal strains which had been embedded in laboratory-made halite crystals in order to simulate evaporitic conditions. The cells accumulated preferentially in tiny fluid inclusions, in simulation of the precipitation of salt in natural brines. FT-Raman spectroscopy using laser excitation at 1064 nm and dispersive micro Raman spectroscopy at 514.5 nm were applied. The spectra showed prominent peaks at 1507, 1152 and 1002 cm−1 which are attributed to haloarchaeal C50 carotenoid compounds (mainly bacterioruberins). Their intensity varied from strain to strain at 1064-nm laser excitation. Other distinguishable features were peaks due to peptide bonds (amide I, amide III) and to nucleic acids. No evidence for fatty acids was detected, consistent with their general absence in all archaea.
These results contribute to a growing database on Raman spectra of terrestrial microorganisms from hypersaline environments and highlight the influence of the different macromolecular composition of diverse strains on these spectra.
Keywords: Raman spectroscopy, extremely halophilic archaea, halite, astrobiology, fluid inclusions, carotenoids, bacterioruberins, Martian subsurface
Introduction
ExoMars will be the first mission by the European Space Agency to carry a payload which is specifically designed to search for life on the subsurface of the planet Mars.[1,2] Although the final number and design of instruments have still to be decided, some of the key tasks will include the study of the physical environment, the capability to drill into the surface, retrieve and analyse samples and look for the evidence of biomarkers.
There is some indication that Mars was warmer and wetter in earlier periods of its history than it is today.[3–5] Since the current upper surface of Mars is exposed to irradiation and oxidation,[6] any life form, if present, might have retreated into protected regions of rocks and minerals,[7] because on the surface any biological substance would likely become destroyed. Therefore, the main purpose of sampling with the aid of a drill is to penetrate through the surface into deeper layers, below the assumed zone of damage to biomolecules.
Different detection methods were proposed for these type of missions, which would be applicable, besides the investigation on Mars, also to other extraterrestrial targets, including future return samples[8,9] – whose acquisition is being reconsidered[10,11] – e.g.: (1) extraction of putative biomolecules and subsequent immuno assays, whereby the approach capitalizes on the flexibility, sensitivity and specificity of antibody-antigen interactions;[12] (2) probing for morphological biosignatures due to bona fide microbial fossils as well as microbially influenced sedimentary structures;[13] or (3) Raman spectroscopy for the detection of both extinct and extant microbiota, since this technique is sensitive to organic and inorganic compounds[14] and able to unambiguously identify key spectral markers in a mixture of biological and geological components.[15–19] The latter method also has the advantage of being a non-intrusive in situ analysis method, requiring very little effort in preparing the samples (e.g. no chemical extractions are necessary), and compact instrumentation has already been developed.[18] The potential for the identification of microorganisms and biomolecules has been recently reviewed.[20–22]
On Earth, high concentrations of salt are not a deterrent for many types of microorganisms – on the contrary, extremely halophilic archaea (now called haloarchaea), bacteria and some unicellular algae thrive in saturated brines.[23] Their optimum growth occurs in media containing 2.5–5.2 m NaCl;[24] their natural environments are the Dead Sea, the Great Salt Lake, sabkhas and natural or artificial salterns.[23] Ancient salt deposits are another habitat and viable haloarchaea were isolated from salt sediments of Permian and Triassic age.[25–28] Haloarchaea were demonstrated to accumulate in the tiny fluid inclusions of halite[29,30] and they may have survived there for long periods. Therefore, the possible survival of haloarchaea over geological times,[31] combined with the detection of Martian halite, make the search for halophilic microorganisms on Mars plausible.
Martian environments regarded as promising locations for the search for life include paleolake craters and evaporitic deposits.[5,15,16] Elements from Martian soil and rocks that were determined with the alpha-particle X-ray spectrometer included Na, Mg, Cl and Br.[32] Evidence for halite was found in the shergottite, nakhlite, and chassigny (SNC) meteorites,[33] which are of Martian origin.[32,34] Saturated salt solutions, which would possess greatly depressed freezing points,[35,36] could be also envisaged on Mars; they may not be present as large pools, but rather could occur in tiny pore spaces between mineral grains.[36] Very recently, large chloride deposits were found on Mars by analysing data from the Mars Odyssey Thermal Emission Imaging System (THEMIS).[37]
UV radiation exposure is one of the most important stresses encountered by halophilic microorganisms[5] in their natural environments and therefore they are thought to have developed carotenoids as protectant molecules. In a recent experiment Halococcus dombrowskii H4 DSM 14522T was exposed to ultraviolet (UV) doses over a wavelength range between 200 and 400 nm, simulating Martian UV flux.[38] Halite-embedded cells showed no loss of viability following exposure up to about 21 kJ/m2 and the estimated dose of 37% survival (D37) was ≥400 kJ/m2. However, exposure of cells to UV flux while in liquid culture reduced D37 by two orders of magnitude (up to about 1 kJ/m2). Similar results were obtained with Halobacterium salinarum NRC-1 and Haloarcula japonica. The absorption of light by colour centres resulting from defects in the crystal structure of halite was likely contributing to these results. Under natural conditions, haloarchaeal cells become embedded in salt upon evaporation; therefore, dispersal of potential microscopic life within small crystals, perhaps in dust, on the surface of Mars would resist damage by UV radiation.
In contrast to bacteria, archaea lack several characteristic biomolecules such as fatty acids, murein and lipopolysaccharide (Ref. [39] for a recent review and Ref. [40] as online source of information), but possess some other unique compounds, e.g. large amounts of carotenoids in the case of haloarchaea, the principal ones being C50 straight-chain α-bacterioruberin and derivatives (e.g. mono-anhydrobacterioruberin and bis-anhydrobacterioruberin).[41]
Methods for the identification of microorganisms in naturally occurring halites will likely be important for astrobiological studies during future Mars missions, including return samples. Since viable haloarchaea were isolated from terrestrian rock salt which is believed to be about 250 million years old, they can be considered long-term survivors[42,43] and constitute a plausible analogue to potential halophilic life on Mars. In the present study, we simulated the embedding of various strains of haloarchaea into halite upon evaporation of hypersaline solutions and examined the samples by FT-Raman spectroscopy using laser excitation at 1064 nm and dispersive micro Raman spectroscopy at 514.5 nm.[14]
As suggested by several authors,[44,45] a Raman spectral database of terrestrial microorganisms should be established for comparisons with potential future extraterrestrial microorganisms; yet, differences in strains and growth conditions need to be further explored, as they can lead to differences in gene expression and consequently, differences in cellular biomolecules.
Experimental
Haloarchaeal strains, cultivation and embedding in halite
The haloarchaeal strains used in this study were (T denotes type strain): H. dombrowskii DSM14522T, Halococcus morrhuae DSM1307T, H. salinarum strain NRC–1 ATCC700922, H. salinarum DSM670, H. salinarum DSM3754T, Halobacterium noricense DSM15987T, H. japonica DSM 6131T, Halorubrum saccharovorum DSM1137, Halorubrum sp. strain Naxos II. They all possess strong pink or red pigmentation.
Halobacterium strains were cultivated in medium ATCC 2185 (Ref. 28 for recipe), while all other strains were grown in medium M2 (Ref. [46]). The cultures were grown in Erlenmeyer flasks at 37 °C in a rotary shaking incubator (Innova 4080, New Brunswick) in normal daylight. Following growth to late logarithmic growth phase or early stationary phase, as indicated by an optical density of cultures of about 1.0 at 600 nm, haloarchaeal cells were harvested by centrifugation at 5000 rpm for 10 min using a Beckman centrifuge. The resulting pellets were washed three times in sterile 4 m NaCl solution, then resuspended in 50 μl of the same solution and embedded in halite by drying the cell suspensions overnight on a glass microscope slide, or on a quartz dish. Dried samples were stored in sterile plastic petri dishes at room temperature in the dark.
Optical microscopy of halite samples was performed with a stereo microscope (Micros, Austria) and a digital camera (Nikon Coolpix). Fluorescence microscopy was carried out following staining with fluorescent dyes from the BacLight LIVE/DEAD kit (Molecular Probes, Eugene, Oregon).[28,47,48] Electron microscopy of haloarchaea was done at the University of Minnesota Characterization Facility by Chris Frethem.[27,49]
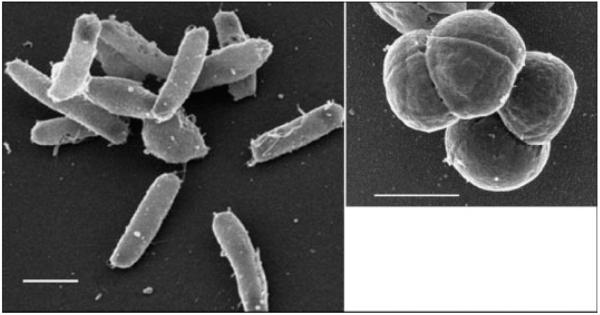
Two representative morphologies of haloarchaeal strains used in this study are shown in Fig. 1: H. salinarum NRC-1 (left panel), which grows as a single rod-shaped cell (with dimensions of about 0.6 μm × 3 μm), and H. dombrowskii (right panel), which grows as diplococcus and forms aggregates of 4–8 cells (the individual cells having a diameter of about 0.8 μm). Figure 2 shows examples of halite crystals with embedded haloarchaea (H. dombrowskii) on a quartz disk used as substrate for the Raman spectroscopic measurements. The haloarchaeal cells predominantly accumulated in small fluid inclusions, as shown in Fig. 3 for cells of H. salinarum strain NRC-1 stained with the BacLight LIVE/DEAD fluorescent dye kit[48] prior to embedding them in halite; the epifluorescence microscopy image was taken 3 days after the embedding of the cells.
Figure 1.
Scanning electron microscopy of Halobacterium salinarum strain NRC-1 (left panel) and Halococcus dombrowskii (right panel). Bars: 1 μm.
Figure 2.
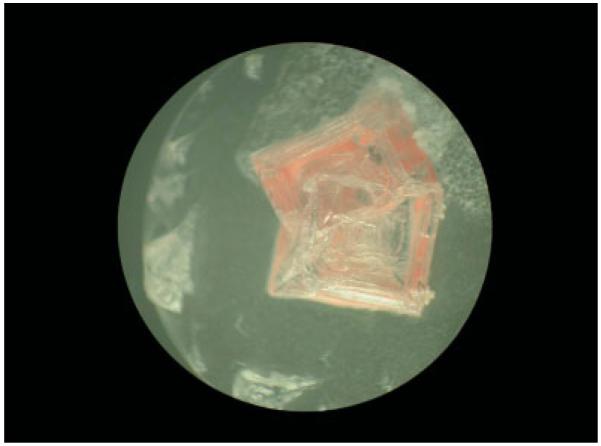
Halite crystals containing embedded haloarchaeal cells (Halococcus dombrowskii) on a quartz disk following drying of a cell suspension in 4M NaCl.
Figure 3.
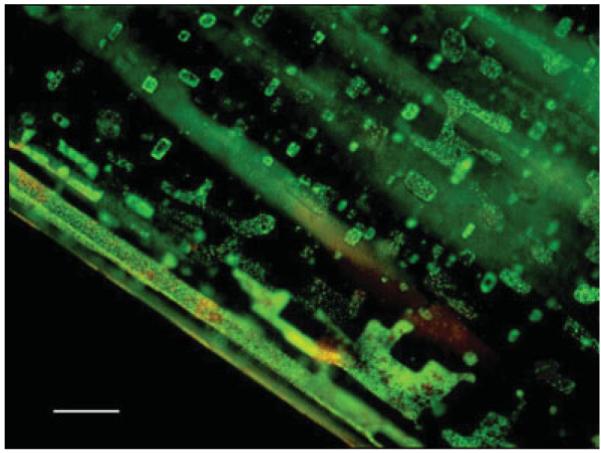
Localization by epifluorescence microscopy of haloarchaea in fluid inclusions embedded in halite, obtained by staining cells of Halobacterium salinarum strain NRC-1 with the BacLight LIVE/DEAD kit[48] prior to embedding. Bar: 25 μm.
Raman spectroscopy
The samples were examined with an excitation wavelength of 1064 nm by FT-Raman spectroscopy in the near infrared (NIR) spectral region and with laser excitation at 514.5 nm by dispersive micro Raman spectroscopy in the visible spectral region.
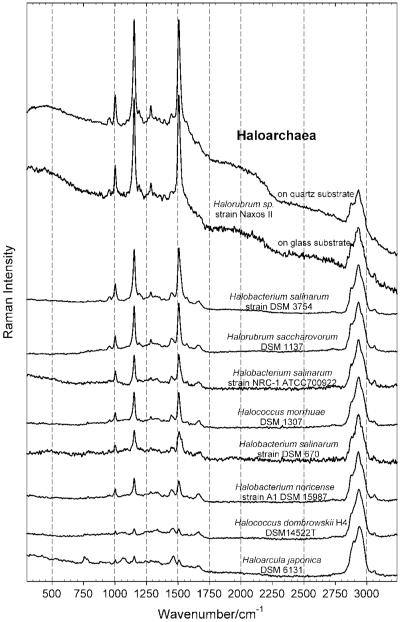
In the first case a Bruker IFS 66 Fourier transform infrared (FT-IR) spectrometer equipped with a Bruker FRA106 Raman module and Opus 5.5 acquisition software was used. The spectra shown in Figs. 4 and 5 were recorded in the spectral range from 90 cm−1 to 3500 cm−1 by acquiring 2000 scans with a spectral resolution (full width half maximum (fwhm) of the apparatus function) of 4 cm−1. The size of the laser spot on the sample was approximately 100 μm and the laser power on the sample about 100 mW (equivalent to an irradiance of roughly 1.3 kW cm−2).
Figure 4.
FT-Raman spectra of haloarchaeal strains in the region of 300 cm−1 to 3250 cm−1, obtained with an excitation wavelength of 1064 nm, and normalized relative to the height of the peak around 2900 cm−1, attributed to the asymmetric and symmetric CH3 and CH2 stretching vibrations.
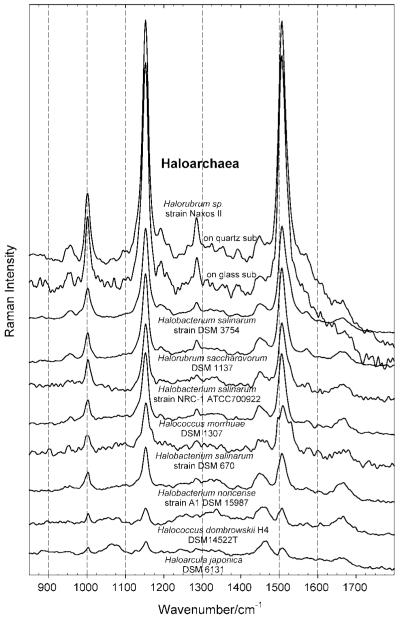
Figure 5.
FT-Raman spectra of haloarchaeal strains in the region of 850 cm−1 to 1800 cm−1, taken with an excitation wavelength of 1064 nm, and normalized relative to the height of the peak at around 1450–1460 cm−1, attributed to the CH2 scissors vibration and the asymmetric CH3 deformation.
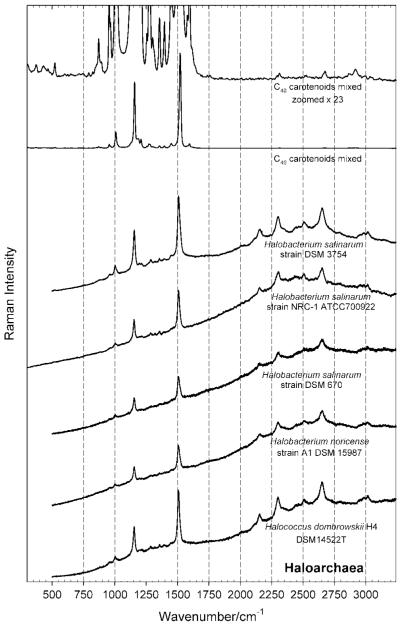
In the second case a confocal microscope BX40 (Olympus Corp., Japan) coupled to a Dilor XY Raman spectrometer (Horiba Jobin Yvon, Longjumeau, France) operated in the subtractive mode was used, the spectrometer running with the Labspec 3.0 acquisition software. The spectra shown in Fig. 6 were collected in the spectral range from 500 cm−1 to 3700 cm−1 with a spectral resolution of 5cm−1 (200-μm slits). The size of the laser spot due to the 10× microscope objective (NA = 0.25) used was approximately 2.5 μm and the laser power on the sample was about 3 mW (equivalent to an irradiance of around 61 kW cm−2).
Figure 6.
Resonance Raman spectra of haloarchaeal strains in the region of 500 cm−1 to 3250 cm−1, taken with an excitation wavelength of 514.5 nm, and normalized relative to the overall height of the spectrum. Note the intensity of overtone and combination bands. For comparison, the FT-Raman spectrum of mixed C40 carotenoids from carrot is shown, the spectrum on the top being blown up by a factor ×23, in order to show the presence of weak overtone and combination bands even with non-resonant excitation.
In the case of the FT-Raman measurements, the Raman spectra of the halite samples included a background signal due to the quartz disk or glass microscopic slide substrate, which was subsequently subtracted in order to obtain the spectra shown in Figs. 4 and 5. The reproducibility of the measurements from two samples containing the same strain (Halorubrum sp. Naxos II) is shown in the upper part of Figs. 4 and 5, where the first spectrum from the top has the quartz disk background subtracted and the second spectrum from the top has the glass slide background subtracted.
The halite itself (cubic space group 225 Fm3m ) does not give rise to any Raman peak,[50] as the A1g mode results to be Raman inactive for this space group.[51]
The Raman spectra of the halite samples obtained through the dispersive micro Raman measurements show a background contribution due to fluorescence of the samples, which for clarity has been kept in Fig. 6 without any baseline correction in order to show original, unmanipulated spectra.
For identification of peaks, published spectra and/or assignments[20,22,44,52,53] as well as the tables and charts published in Ref. [54] were used.
Results
The FT-Raman spectra of nine haloarchaeal strains, collected with an excitation wavelength of 1064 nm, are shown in Fig. 4 in the spectral range from 300 to 3250 cm−1 and in Fig. 5 in the spectral range between 850 and 1800 cm−1. By normalizing all the spectra, in Fig. 4 relative to the intensity of the peaks of the CH2 and CH3 stretch around 2900 cm−1 and in Fig. 5 relative to the intensity of the CH2 scissors vibration and the asymmetric CH3 deformation at around 1450–1460 cm−1, these two figures clearly demonstrate the change in carotenoid content of the halophilic Archaea investigated, being the lowest for H. japonica DSM6131T and the highest for Halorubrum sp.strain Naxos II.
The comparison of Fig. 6 with Fig. 4 clearly displays the difference in the spectra which one encounters when exciting resonantly[14,53,55] (Fig. 6) and nonresonantly (Fig. 4).[52]
In the non-resonant case, apart from the prominent carotenoid peaks due to the stretching modes of conjugated C=C and C–C bonds in the central chain, at 1507 cm−1 and 1152 cm−1, respectively, and the peak at 1002 cm−1 being attributed to the in-plane rocking mode of CH3 groups attached to the polyene chain, one obtains the signature from other cell components too,[52] as nicely summarized, e.g. in Figs. 1B and 2B and in Table 1 of Ref. [20].
It is well known that any prokaryote (bacteria or archaea) consists mainly of protein (55% of its dry weight).[56] In addition, prokaryotes contain approximately 23% nucleic acids, 9–10% lipids, 3% polysaccharides and smaller amounts of vitamins, metabolites and other compounds, which contribute to further peaks.
Peaks between 2800 and 3100 cm−1, which belong to the CH2 and CH3 stretch and to the (C=C–H)aromatic stretch, can therefore be mainly attributed to the presence of proteins[20] (which are also signalled by the presence of the amide I band at around 1665 cm−1, and in principle by the amide III band at around 1230–1295 cm−1, here barely recognizable[52]), and to a much lesser extent to the expected presence of characteristic core lipids of archaea (C20 glycerol diphytanyl diether, or archaeol[57]). The presence of the CH2 and CH3 stretch from proteins (and some lipids) automatically leads to the presence of the already mentioned peak due to the asymmetric CH3 deformation and/or the CH2 scissors vibration at around 1450–1460 cm−1, which is also clearly recognizable. Note that the heights of the CH2 and CH3 peaks were used for the normalization of the spectra shown in Figs. 4 and 5.
In the resonant case shown in Fig. 6, discrimination between carotenoids and other cellular constituents was not possible, since the spectral features associated with the stretching modes of conjugated C=C and C–C bonds in the polyene chain of the carotenoids and the in-plane rocking mode of CH3 groups attached to the polyene chain get greatly enhanced, leading additionally to the appearance of characteristic overtones and combinations bands mainly in the spectral region between 2150 cm−1 and 2650 cm−1.[55,62] Note therefore the comparatively low intensity of the peaks of the CH2 and CH3 stretch between 2800 and 3100 cm−1.
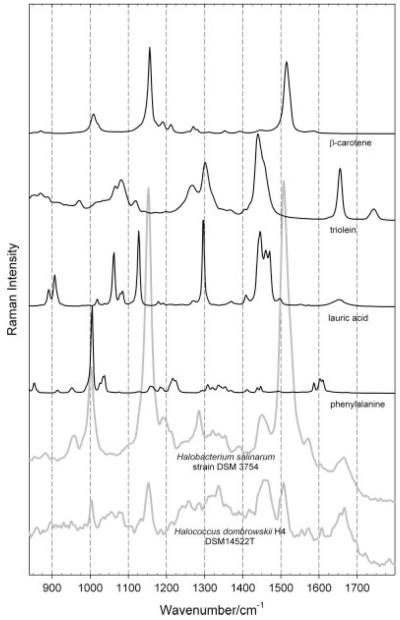
In Fig. 7, the comparison of the spectrum of phenylalanine[22] (an amino acid having a prominent peak at 1004 cm−1 – compare again Figs. 1B, 2B, and Table 1 of Ref. [20] – and weaker peaks at 852 and 1602 cm−1) with the spectrum obtained from the sample with H. dombrowskii H4 DSM14522T embedded in halite demonstrates the detectability of this amino acid if its contribution to the overall spectrum is not overwhelmed by the presence of strong carotenoid peaks, as e.g. in the case shown in Fig. 7 of the H. salinarum strain DSM 3754.
Figure 7.
Comparison of the FT-Raman spectra of haloarchaeal strains Halobacterium salinarum strain DSM 3754 and Halococcus dombrowskii H4 DSM14522T in the region of 850 cm−1 to 1800 cm−1 (obtained with a laser excitation wavelength of 1064 nm and normalized to the height of the peak at around 1450–1460 cm−1, attributed to the CH2 scissors vibration and the asymmetric CH3 deformation) with the spectra of phenylalanine (an aminoacid), lauric acid (a saturated linearfatty acid), triolein (an unsaturated fat) and β-carotene taken from the database available through Ref. [22].
In this same figure, the comparison of the FT-Raman spectra of the above-mentioned haloarchaeal strains with those reported – see Ref. [22] – for a saturated linear fatty acid (here, e.g. lauric acid), and with an unsaturated fat (here, e.g. triolein) reveals, within the signal-to-noise ratio obtainable, no prominent peaks typical of these fatty acids (or of lipids).
Discussion
Prokaryotic microorganisms consist of two phylogenetic lines, archaea (or archaebacteria) and bacteria (or eubacteria), which possess fundamental differences regarding several biomolecules; most important in archaea is the lack of membrane fatty acids, the lack of the bacterial cell wall polymer murein and of bacterial liposaccharide, and the presence of isopranyl derivatives (isoprenoids).[39,40,58] These important biomolecular differences are occasionally overlooked,[52] which may be not too surprising, given the still valid nomenclature of archaeal genera which contain often the epithet ‘bacteria’.
Raman spectra of biological samples are complex and are still greatly underused as not all information which can be present[22] can also be readily interpreted. Nevertheless, owing to the relative ease of acquisition of spectra, their reproducibility, together with the possibility of investigating water-containing samples, Raman spectroscopy has become a subject of increasing interest in many areas of biosciences,[14,21] notably in the identification of microorganisms in environmental and other samples.[59,60] Depending on the goal of the research work, one may prefer to rely on the information provided by the whole Raman spectrum, as delivered with non-resonant excitation of all the constituents of the sample under study, or one is interested in particular features of the Raman spectrum delivered by resonant excitation of well-selected constituents of the sample.[18] Connected with each choice is a selection of advantages and disadvantages. In the case of non-resonant excitation in the NIR, the advantage is the avoidance of a disturbing fluorescence background, which can spoil the Raman signal in the case of strong fluorescence possibly appearing with resonant or near-resonant excitation in the visible (compare Fig. 4 with Fig. 6). On the other hand, one can gain in sensitivity when moving from the NIR to the visible due to the intensity of the Raman signal increasing with the 4th power of the wavenumber used for excitation,[14] furthermore considerably enhancing the observed signal when reaching the conditions for resonance Raman scattering.
The results obtained in this study contribute to the database on Raman spectra of haloarchaea, which was suggested by Ref. [44]. Spectra from nine different strains of haloarchaea, representing four different genera, were obtained, clearly showing systematic differences in the intensity of the carotenoids peaks when the spectra are normalized against the protein (and lipids) peaks. The feasibility of using Raman spectroscopy with haloarchaea while the cells are embedded in the fluid inclusions of halite has been confirmed. Such crystals, on the inhospitable surface of Mars, could provide sufficient shielding from UV radiation that might allow the microorganisms within them to remain viable.[38]
The non-resonant Raman spectra (Figs. 4 and 5) and the resonant Raman spectra (Fig. 6) of the haloarchaeal strains investigated in this study are dominated by characteristic carotenoid bands at 1507 cm−1, 1152 cm−1 and 1002 cm−1;[52,53] according to Ref. [53], they can be assigned to bacterioruberin, a C50 carotenoid with 13 conjugated double bonds.[41,61] These bands are situated at smaller wavenumbers than the corresponding bands in the C40 carotenoids (containing 9–11 conjugated double bonds in the main chain),[62,63] the C40 carotene mix in Fig. 6 having peaks at 1520 cm−1, 1157 cm−1 and 1008 cm−1[63] and the β-carotene in Fig. 7 peaks at 1515 cm−1, 1157 cm−1 and 1008 cm−1.[22,63]
The reason for this shift is well known, that is, the wavenumber position, e.g. of the C=C peak in a polyene chain being correlated with the number N of C=C bonds in this polyconjugated main chain[64] (in other words with its length); thus the C=C peak position shifts from about 1585 cm−1 for carotenoids with N = 4 (e.g. the C20 carotenoid retinal) further down to 1515–1520 cm−1 with N = 9 (e.g. the C40 carotenoid α-carotene, β-carotene and lutein) and N = 11 (e.g. the C40 carotenoid lycopene, with the peaks at 1510 cm−1, 1157 cm−1 and 1006 cm−1[63]), and further down to about 1500 cm−1 for carotenoids with N = 13 (e.g. in the case of the C50 carotenoid bacterioruberin).[52,53] The same behaviour holds for the other two characteristic carotenoid bands, although the shift is less pronounced. Small variations of the position for a given N are due to type and orientation of the terminal groups at the end of the polyene chain.[62,63]
We did not attempt to extract and separate all possible carotenoids from our haloarchaeal samples for individual Raman spectroscopic observation, as it does not serve the purpose of developing a procedure to be used with extraterrestrial samples during planetary explorations (similar considerations being expressed already in Ref. [53]). Furthermore, in haloarchaea the structures of only some of the most important C50 and C40 ones have been identified in recent years.[41] Nevertheless, besides the characteristic peaks attributable to C50 carotenoids of haloarchaea, the slight asymmetry of these peaks towards higher wavenumbers might indicate the presence of C40 carotenoids in small amounts, lycopene and β-carotene being probably the most abundant.
Apart from the fact that, as Figs. 4 and 5 show, there are significant differences in the concentration of carotenoids in different haloarchaeal species,[65] variations in the intensity of the pigment bands across the size of colonies of haloarchaea can occur due to cell motility and cell concentration;[52] additionally, the carotenoid content of some haloarchaea has been found to be related also to their growth conditions.[66,67] As stated in the experimental section, we performed our Raman spectroscopic measurements after growth to late logarithmic phase or early stationary phase.
Additional considerations about biomarkers for the detection of haloarchaea[53,61] need to be further elucidated; for example the well-known membrane protein bacteriorhodopsin has been suggested by Ref. [53] as a second biomarker for haloarchaea in hypersaline environments. Bacteriorhodopsin (which is probably the simplest proton pump known[68]) contains retinal, a C20 chromophore with four conjugated C=C bonds in the main chain; Fig. 6 of Ref. [53] shows the differences in the resonance Raman spectra of isolated bacteriorhodopsin (purchased as a commercial preparation, the C=C peak situated at 1536 cm−1) and of bacterioruberin (from cells of H. salinarum). More details on resonance Raman spectra of bacteriorhodopsin can also be found in Ref. [69]. Interestingly, all the carotenoid peaks shown in Figs. 4–6 of the present study are quite consistent with the resonance Raman spectrum of bacterioruberin shown in Fig. 6 of Ref. [53], giving no significant evidence for peaks attributable to the presence of bacteriorhodopsin. Indeed, bacteriorhodopsin was produced by H. salinarum NRC-1 and Halorubrum sp. strain NaxosII, under the growth conditions used here, with about 1–2% of total membrane proteins, as we prepared it from haloarchaeal purple membranes, containing bacteriorhodopsin,[70] as described in Ref. [71]. Polyacrylamide gel electrophoresis was performed according to Laemmli,[72] and showed a protein band of molecular mass of 26 000 Da. Yet, any characteristic bacteriorhodopsin peaks were likely obscured by the overwhelming presence of the characteristic carotenoids peaks. Additionally, bacteriorhodopsin is not produced by all haloarchaea; its gene was found to be absent from some genera such as Halococcus, Haloferax and others;[23,65] in addition, its expression can vary significantly, depending on environmental conditions.[73] The spectra in Figs. 4–6 imply therefore that, in contrast to the proposal by Ref. [53], bacteriorhodopsin cannot be considered an ideal marker for the detection of haloarchaea.
All organisms, from the simplest bacteria to humans, contain fatty acids in their membranes, except archaea.[39] The absence of the respective signals for fatty acids in putative extraterrestrial samples would therefore be of great biological significance. The presence of fatty acids in Raman spectra would be shown by characteristic peaks in the spectral region from 1000 to 1200 cm−1 and from 2800 to 3100 cm−1, apart from characteristic peaks at around 1300 cm−1 and 1450 cm−1 (compare the FT-Raman spectra of fatty acids and of unsaturated fats in Ref. [22] with the FT-Raman spectrum of a lipid shown in Fig 1B of Ref. [20]). The conclusion which can be deduced from Fig. 7 is therefore in agreement with known low amount of lipids in the samples studied, and with the known absence of fatty acids in all archaea.
Conclusions
Previous studies during several space missions to Mars and ground experiments with meteorites of Martian origin showed the presence of water and of halite, respectively, which suggests the existence of Martian environments with a plausible potential for the occurrence of haloarchaea. Nonetheless, the success of further planetary missions requires intensive ground studies in order to assess the feasibility of the experiments on Mars.
Raman spectroscopy can be applied for the identification of halophilic microorganisms and/or of their biomolecules in environmental samples which contain solid salts and water.[18,74,75] We have shown the detection of nine different extremely halophilic archaeal strains which had been embedded in laboratory-made halite crystals in order to simulate evaporitic conditions. The cells accumulated preferentially in tiny fluid inclusions, similarly as during the precipitation of salt in natural brines. Compared to the vintage Raman instruments used in this study, with a modern single-stage dispersive Raman instrument with holographic notch filter, a few cells should be sufficient for obtaining reasonably good signals out of the fluid inclusions, the laser spot size of the microscope objective with 10× magnification being in the range 2.5–5.2 μm, depending on the wavelength used for excitation. If more detailed information about the assignment of peaks from different strains and under different growth conditions becomes increasingly available, Raman spectroscopic techniques promise to be very useful for future life detection experiments in the subsurface of Mars or with return samples.
Acknowledgments
The study was supported by FWF (Austrian Science Fund), project P18256. We thank our colleagues Pierre Madl and Claudia Gruber, both at the University of Salzburg, for their help with some measurements and expert technical assistance, respectively.
References
- [1].Vago J, Gardini B, Kminek G, Baglioni P, Gianfiglio G, Santovincenzo A, Bayón S, van Winnendael M. ESA Bull. 2006;126:17. http://www.esa.int/esapub/bulletin/bulletin126/bul126c_vago.pdf. [Google Scholar]
- [2].Vago JL, Kminek G. In: Complete Course in Astrobiology. Horneck G, Rettberg P, editors. Wiley VCH Verlag; Weinheim: 2007. p. 321. [Google Scholar]
- [3].Carr M. Nature. 1987;326:30. [Google Scholar]
- [4].Pollack JB, Kasting JF, Richardson SM, Poliakoff K. Icarus. 1987;71:203. doi: 10.1016/0019-1035(87)90147-3. [DOI] [PubMed] [Google Scholar]
- [5].Edwards HGM, Moody CD, Newton EM, Jorge Villar SE, Russel MJ. Icarus. 2005;175:372. [Google Scholar]
- [6].Clark BC. J. Geophys. Res. Planets. 1999;103:28543. [Google Scholar]
- [7].Mancinelli RL. Adv. Space Res. 2003;31:103. doi: 10.1016/s0273-1177(02)00663-4. [DOI] [PubMed] [Google Scholar]
- [8].O’Neil WJ, Cazaux C. Acta Astronaut. 2000;47:453. doi: 10.1016/s0094-5765(00)00085-0. [DOI] [PubMed] [Google Scholar]
- [9].Rummel JD. Adv. Space Res. 2000;26:1893. doi: 10.1016/s0273-1177(00)00157-5. [DOI] [PubMed] [Google Scholar]
- [10].Stern A. Nature. 2007;448:978. doi: 10.1038/448978a. [DOI] [PubMed] [Google Scholar]
- [11].Whitehead J. Nature. 2007;449:972. doi: 10.1038/449972c. [DOI] [PubMed] [Google Scholar]
- [12].Schweitzer MH, Wittmeyer J, Avci R, Pincus S. Astrobiology. 2005;5:30. doi: 10.1089/ast.2005.5.30. [DOI] [PubMed] [Google Scholar]
- [13].Cady SL, Farmer JD, Grotzinger JP, Schopf JW, Steele A. Astrobiology. 2003;3:351. doi: 10.1089/153110703769016442. [DOI] [PubMed] [Google Scholar]
- [14](a).Chalmers JM, Griffiths PR, editors. Handbook of Vibrational Spectroscopy. vols 1–5. John Wiley & Sons Ltd; New York: 2002. [Google Scholar]; (b) Musso M, Oehme KL. Raman spectroscopy. In: Lackner M, editor. Lasers in Chemistry: Probing and Influencing Matter. Wiley-VCH; Weinheim: 2008. p. 531. [Google Scholar]
- [15].Ellery A, Wynn-Williams D. Astrobiology. 2003;3:565. doi: 10.1089/153110703322610654. [DOI] [PubMed] [Google Scholar]
- [16].Ellery A, Wynn-Williams D, Parnell J, Edwards HGM, Dickensheets D. J. Raman Spectrosc. 2004;35:441. [Google Scholar]
- [17].Edwards HGM, Mohsin MA, Sadooni FN, Hasan NFN, Munshi T. Anal. Bioanal. Chem. 2006;385:46. doi: 10.1007/s00216-006-0396-3. [DOI] [PubMed] [Google Scholar]
- [18].Jorge Villar SE, Edwards HGM. Anal. Bioanal. Chem. 2006;384:100. doi: 10.1007/s00216-005-0029-2. [DOI] [PubMed] [Google Scholar]
- [19].Edwards HGM, Hargreaves MD, Scowen IJ. In: Proceedings of the XXIst International Conference on Raman Spectroscopy. Withnall R, Chowdhry BZ, editors. IM Publications; Chichester: 2008. p. 91. [Google Scholar]
- [20].Maquelin K, Kirschner C, Choo-Smith LP, van den Braak N, Endtz H. Ph., Naumann D, Puppels GJ. J. Microbiol. Methods. 2002;51:255. doi: 10.1016/s0167-7012(02)00127-6. [DOI] [PubMed] [Google Scholar]
- [21].Petry R, Schmitt M, Popp J. ChemPhysChem. 2003;4:14. doi: 10.1002/cphc.200390004. [DOI] [PubMed] [Google Scholar]
- [22].De Gelder J, De Gussem K, Vandenabeele P, Moens L. J. Raman Spectrosc. 2007;38:1133. [Google Scholar]
- [23].Javor BJ. Hypersaline Environments: Microbiology and Biogeochemistry. Springer Verlag; Berlin, Heidelberg, New York: 1989. [Google Scholar]
- [24].Kushner DJ, Kamekura M. In: Halophilic Bacteria. Rodriguez-Valera F, editor. vol I. CRC Press Inc.; Boca Raton: 1988. p. 109. [Google Scholar]
- [25].Denner EBM, McGenity TJ, Busse H-J, Wanner G, Grant WD, Stan-Lotter H. Int. J. Syst. Bacteriol. 1994;44:774. [Google Scholar]
- [26].Stan-Lotter H, McGenity TJ, Legat A, Denner EBM, Glaser K, Stetter KO, Wanner G. Microbiology. 1999;145:3565. doi: 10.1099/00221287-145-12-3565. [DOI] [PubMed] [Google Scholar]
- [27].Stan-Lotter H, Pfaffenhuemer M, Legat A, Busse H-J, Radax C, Gruber C. Int. J. Syst. Evol. Microbiol. 2002;52:1807. doi: 10.1099/00207713-52-5-1807. [DOI] [PubMed] [Google Scholar]
- [28].Gruber C, Legat A, Pfaffenhuemer M, Radax C, Weidler G, Busse H-J, Stan-Lotter H. Extremophiles. 2004;8:431. doi: 10.1007/s00792-004-0403-6. [DOI] [PubMed] [Google Scholar]
- [29].Fendrihan S, Stan-Lotter H. In: Mars and Planetary Science and Technology, selected papers from EMC 04. Teodorescu HN, Griebel HS, editors. Performantica Press; Iasi, Romania: 2004. p. 9. [Google Scholar]
- [30].Fendrihan S, Legat A, Pfaffenhuemer M, Gruber C, Weidler G, Gerbl F, Stan-Lotter H. Rev. Environ. Sci. Biotechnol. 2006;5:1569. doi: 10.1007/s11157-006-0007-y. [DOI] [PMC free article] [PubMed] [Google Scholar]
- [31].Stan-Lotter H, Radax C, McGenity TJ, Legat A, Pfaffenhuemer M, Wieland H, Gruber C, Denner EBM. In: Halophilic Microorganisms. Ventosa A, editor. Springer Verlag; Berlin, New York: 2004. p. 89. [Google Scholar]
- [32].Rieder R, Gellert R, Anderson RC, Bruckner J, Clark BC, Dreibus G, Economou T, Klingelhöfer G, Lugmair GW, Ming DW, Squyres SW, d’Uston C, Wanke H, Yen A, Zipfel J. Science. 2004;306:1746. doi: 10.1126/science.1104358. [DOI] [PubMed] [Google Scholar]
- [33].Gooding JL. Icarus. 1992;99:28. [Google Scholar]
- [34].Treiman AH, Gleason JD, Bogard DD. Space Sci. 2000;48:1213. [Google Scholar]
- [35].Lide DR, editor. CRC Handbook of Chemistry and Physics. 85th edn CRC Press; Boca Raton: 2004. p. 8. [Google Scholar]
- [36].Landis GA. Astrobiology. 2001;1:161. doi: 10.1089/153110701753198927. [DOI] [PubMed] [Google Scholar]
- [37].Osterloo MM, Hamilton VE, Bandfield JL, Glotch TD, Baldridge AM, Christensen PR, Tornabene LL, Anderson FS. Science. 2008;319:1651. doi: 10.1126/science.1150690. [DOI] [PubMed] [Google Scholar]
- [38].Fendrihan S, Bérces A, Lammer H, Musso M, Rontó G, Polacsek TK, Holzinger A, Kolb C, Stan-Lotter H. Astrobiology. 2009;9:104. doi: 10.1089/ast.2007.0234. [DOI] [PMC free article] [PubMed] [Google Scholar]
- [39].Kletzin A. In: Archaea. Molecular and cellular biology. Cavicchiolo R, editor. ASM press; Washington DC: 2007. p. 14. [Google Scholar]
- [40].Todar K. Todar’s Online Textbook of Bacteriology. Last accessed: 3rd June 2009 . http://www.text bookofbacteriology.net/index.html.
- [41].Oren A. In: The Prokaryotes. 3rd edn Dworkin M, Falkow S, Rosenberg E, Schleifer K-H, Stackebrandr E, editors. Springer Verlag; Berlin, New York: 2006. p. 113. [Google Scholar]
- [42].Grant WD, Gemmell RT, McGenity TJ. Extremophiles. 1998;2:279. doi: 10.1007/s007920050070. [DOI] [PubMed] [Google Scholar]
- [43].McGenity TJ, Gemmell RT, Grant WD, Stan-Lotter H. Environ. Microbiol. 2000;2:243. doi: 10.1046/j.1462-2920.2000.00105.x. [DOI] [PubMed] [Google Scholar]
- [44].Marshall CP, Carter EA, Leuko S, Javaux EJ. Vib. Spectrosc. 2006;41:182. [Google Scholar]
- [45].Javaux EJ. Res. Microbiol. 2006;157:37. doi: 10.1016/j.resmic.2005.07.008. [DOI] [PubMed] [Google Scholar]
- [46].Stan-Lotter H, Radax C, Gruber C, Legat A, Pfaffenhuemer M, Wieland H, Leuko S, Weidler G, Kömle N, Kargl G. Int. J. Astrobiology. 2003;1:271. [Google Scholar]
- [47].Leuko S, Legat A, Fendrihan S, Stan-Lotter H. Appl. Environ. Microbiol. 2004;70:6884. doi: 10.1128/AEM.70.11.6884-6886.2004. [DOI] [PMC free article] [PubMed] [Google Scholar]
- [48].Stan-Lotter H, Leuko S, Legat A, Fendrihan S. In: Extremophiles. Oren A, Rainey F, editors. vol 35. Elsevier; Oxford: 2006. p. 569. (Methods in Microbiology). [Google Scholar]
- [49].C. Frethem Characterization Facility, Institute of Technology, University of Minnesota Last accessed: 4th June 2009 . http://www.charfac.umn.edu/staff/frethem.html.
- [50].Downs RT. The RRUFF Project: an integrated study of the chemistry, crystallography, Raman and infrared spectroscopy of minerals. Program and Abstracts of the 19th General Meeting of the International Mineralogical Association in Kobe; Japan. 2006. p. O03. http://rruff.geo.arizona.edu/rruff/ [Google Scholar]
- [51].Kroumova E, Aroyo MI, Perez-Mato JM, Kirov A, Capillas C, Ivantchev S, Wondratschek H. Bilbao Crystallographic Server. Phase Transitions. 2003;76:155. [Google Scholar]
- [52].Goodwin JR, Hafner LM, Fredericks PM. J. Raman Spectrosc. 2006;37:932. [Google Scholar]
- [53].Marshall CP, Leuko S, Coyle CM, Walter MR, Burns BP, Neilan BA. Astrobiology. 2007;7:631. doi: 10.1089/ast.2006.0097. [DOI] [PubMed] [Google Scholar]
- [54](a).Lin-Vien D, Colthup NB, Fateley WB, Grasselli JB. The Handbook of Infrared and Raman Characteristic Frequencies of Organic Molecules. Academic Press; San Diego CA: 1991. [Google Scholar]; (b) Socrates G. Infrared and Raman Characteristic Group Frequencies. John Wiley & Sons Inc.; New York: 2004. [Google Scholar]
- [55].Okamoto H, Sekimoto Y, Tasumi M. Spectrochim. Acta, Part A. 1994;50:1467. [Google Scholar]
- [56].Madigau MT, Martinko JM. Brock Biology of Microorganisms. 11th edn Pearson Prentice Hall; Upper Saddle River: 2006. p. 42. [Google Scholar]
- [57].Kates M. Experientia. 1993;49:1027. doi: 10.1007/BF01929909. [DOI] [PubMed] [Google Scholar]
- [58].Woese CR, Kandler O, Wheelis ML. Proc. Natl. Acad. Sci. U.S.A. 1990;87:4576. doi: 10.1073/pnas.87.12.4576. [DOI] [PMC free article] [PubMed] [Google Scholar]
- [59].Naumann D, Keller S, Helm D, Schultz C, Schrader B. J. Mol. Struct. 1995;347:399. [Google Scholar]
- [60].Rösch P, Harz M, Peschke KD, Ronneberger O, Burkhardt H, Schüle A, Schmauz G, Lankers M, Hofer S, Thiele H, Motzkus HW, Popp J. Anal. Chem. 2006;78:2163. doi: 10.1021/ac0514974. [DOI] [PubMed] [Google Scholar]
- [61].Pfander HP. Pure Appl. Chem. 1994;66:2369. [Google Scholar]
- [62].Withnall R, Chowdhry BZ, Silver J, Edwards HGM, de Oliveira LFC. Spectrochim. Acta, Part A. 2003;59:2207. doi: 10.1016/s1386-1425(03)00064-7. [DOI] [PubMed] [Google Scholar]
- [63].Schulz H, Baranska M, Baranski R. Biopolymers. 2005;77:212. doi: 10.1002/bip.20215. [DOI] [PubMed] [Google Scholar]
- [64].Schaffer HE, Chance RR, Silbey RJ, Knoll K, Schrock RR. J. Chem. Phys. 1991;94:4161. [Google Scholar]
- [65].Oren A. Halophilic microorganisms and their environments. Kluwer Academic Publishers; Dordrecht: 2002. [Google Scholar]
- [66].Gochnauer MB, Kushwaha SC, Kates M, Kushner DJ. Arch. Mikrobiol. 1972;84:339. [Google Scholar]
- [67].Kushwaha SC, Kates M. Can. J. Microbiol. 1979;25:1288. doi: 10.1139/m79-203. [DOI] [PubMed] [Google Scholar]
- [68].Lanyi JK. Biochim. Biophys. Acta. 2006;1757:1012. doi: 10.1016/j.bbabio.2005.11.003. [DOI] [PubMed] [Google Scholar]
- [69].Aton B, Doukas AG, Callender RH, Becher B, Ebrey TG. Biochemistry. 1977;16:2995. doi: 10.1021/bi00632a029. [DOI] [PubMed] [Google Scholar]
- [70].Oesterhelt D, Stoeckenius W. Nat New Biol. 1971;233:149. doi: 10.1038/newbio233149a0. [DOI] [PubMed] [Google Scholar]
- [71].Oesterhelt D. In: Archaea, A Laboratory Manual. Halophiles. DasSarma S, Fleischmann EM, editors. Cold Spring Harbor Laboratoty Press; New York: 1995. p. 55. [Google Scholar]
- [72].Laemmli UK. Nature. 1970;227:680. doi: 10.1038/227680a0. [DOI] [PubMed] [Google Scholar]
- [73].Sharma AK, Walsh DA, Bapteste E, Rodriguez-Valera F, Doolittle WF, Papke RT. BMC Evol. Biol. 2007;7:79. doi: 10.1186/1471-2148-7-79. [DOI] [PMC free article] [PubMed] [Google Scholar]
- [74].Edwards HGM, Jorge Villar SE, Pullan D, Hargraves MD, Hofmann BA, Westall F. J. Raman Spectrosc. 2007;38:1352. [Google Scholar]
- [75].Allwood AC, Walter MR, Marshall CP. Vib. Spectrosc. 2006;41:190. [Google Scholar]


