

Abstract
Gating in the NMDA receptor is initiated in the extracellular ligand-binding domain (LBD) and is ultimately propagated via three linkers—S1-M1, M3-S2, and S2-M4—to the ion channel. M3-S2 directly couples LBD movements into channel gating, but the functional and structural contributions of S1-M1 and S2-M4 to the overall gating process are unknown. A scan of substituted cysteines in and around the NMDA receptor S1-M1 and S2-M4 with a bulky cysteine-reactive reagent identified numerous positions that showed potentiation of glutamate-activated as well as leak currents. As indexed by MK801 (dizocilpine hydrogen maleate), an open channel blocker, this potentiation was attributable to an increase in open probability, an interpretation confirmed for a subset of positions with single-channel recordings. The magnitude of this gating effect, acting through S1-M1 or S2-M4, was dependent on the intrinsic gating properties of the NMDA receptors, being more effective in the inherently low open probability GluN2C- than the higher open probability GluN2A-subunit-containing receptors. For the majority of these potentiation positions, we propose that alteration of gating arises from steric destabilization of contact interfaces where close apposition of the contacting partners is necessary for efficient channel closure. Our results therefore indicate that the NMDA receptor S1-M1 and S2-M4 linkers are dynamic during gating and can modulate the overall energetics of this process. Furthermore, the results conceptualize a mechanistic, as well as a possible structural, framework for pharmacologically targeting the linkers through noncompetitive and subunit-specific modes of action.
Introduction
NMDA receptors (NMDARs), along with AMPA and kainate receptors, are ion channels gated by glutamate, the major excitatory neurotransmitter in the mammalian CNS. Glutamate-mediated signaling is essential for basic neuron-to-neuron signaling and higher order nervous system processes including learning, memory, and pain perception (Cull-Candy and Leszkiewicz, 2004; Südhof and Malenka, 2008). When aberrant, glutamate-mediated signaling, particularly involving the NMDAR, can trigger and/or complicate numerous acute (e.g., stroke and epilepsy) and chronic (e.g., Alzheimer's and Parkinson's) disease states, as well as psychiatric conditions (e.g., schizophrenia) (Krystal et al., 2003; Waxman and Lynch, 2005).
A hallmark of NMDAR function is gating—the coupling of ligand binding/unbinding to ion channel opening/closing. The core structural components of this process are the extracellular ligand-binding domain (LBD) (S1 and S2) and the channel-forming transmembrane domain (M1–M4) (see Fig. 1) (Mayer, 2005; Oswald et al., 2007; Sobolevsky et al., 2009). Three peptide linkers—S1-M1, M3-S2, and S2-M4—couple the ligand-binding and transmembrane domains (see Fig. 1). M3-S2, by connecting to the pore-lining and major transmembrane gating element M3, is central to gating (Jones et al., 2002; Sobolevsky et al., 2002; Chang and Kuo, 2008). However, the peripheral S1-M1 and S2-M4, through their interactions with M3-S2 and other proximal structures, may modulate the gating process (Krupp et al., 1998; Villarroel et al., 1998; Yelshansky et al., 2004; Schmid et al., 2007). As such, these linkers represent unexplored drug targets in which receptor activity can be regulated in a noncompetitive manner (Balannik et al., 2005), separate from the mostly failed approaches of competitive and allosteric modulators and pore blockers (Lipton, 2006; Kalia et al., 2008).
Figure 1.

The linkers S1-M1, M3-S2, and S2-M4 connect the extracellullar LBD to the transmembrane segments in a glutamate receptor subunit. A, Schematic representation of the functional core of an ionotropic glutamate receptor (iGluR) subunit. The extracellular LBD, shown in cyan, is composed of lobes S1 (shown in orange) (N-terminal to M1) and S2 (shown in magenta) (between M3 and M4). The hydrophobic segments M1, M3, and M4, as well as the M2 pore loop, are shown as gray cylinders. The thick black bars indicate regions in and around the linkers S1-M1, M3-S2, and S2-M4, in which cysteines were substituted. B, Ribbon representation of a single GluR subunit (GluA2cryst, subunit A; PDB ID 3KG2), viewed from the side and oriented with the extracellular solution above. The LBD, the linkers, and the transmembrane segments are shown with colors as in A. C, Sequence of the regions encompassing the three linkers in the GluN1 and GluN2C subunits. The proximal parts of the presumed hydrophobic segments M1, M3, and M4 (Schmid et al., 2007) are highlighted in gray. The boxed regions around these hydrophobic segments show the proximal α-helical extent of the transmembrane segments as revealed by GluA2cryst (Sobolevsky et al., 2009). GluN1 is assumed to take the A/C conformation, whereas GluN2C, the B/D conformation. The proximal parts of S1 and S2 are highlighted in orange and magenta, respectively. Positions substituted with cysteines and tested for PTrEA reactivity are indicated (see Materials and Methods). Certain positions, specifically those without an adjacent “C,” were not tested because MTS reagents did not persistently alter their current amplitudes (Beck et al., 1999). Numbering is for the mature protein.
A functional NMDAR has four subunits, typically two glycine-binding GluN1s and two glutamate-binding GluN2s. GluN2 has four isoforms (A–D), each imparting distinct biophysical properties to the intact receptor and having diverse spatiotemporal distributions within the CNS (Cull-Candy and Leszkiewicz, 2004; Paoletti and Neyton, 2007). A recent homotetrameric AMPA receptor (AMPAR) structure [Protein Data Bank (PDB) ID 3KG2] revealed the general arrangement and conformations of the LBD-TM linkers. Notably, the linkers were shown to mediate the symmetry mismatch between the extracellular (twofold) and transmembrane (fourfold) domains by taking on two different conformations. In the NMDAR, the two conformations are apparently subunit specific (Sobolevsky et al., 2009). Nevertheless, there are limitations in relating specific linker positions in this AMPAR structure to their NMDAR counterparts because of variability in their lengths, amino acid composition, and low resolution of certain linkers in the structure (supplemental Fig. 1, available at www.jneurosci.org as supplemental material). In addition, a single structural snapshot does not identify functionally important elements of gating.
Taking advantage of substituted cysteines, we identify specific positions encompassing the NMDAR S1-M1 and S2-M4 that can modulate gating. This modulation is subunit specific, being dependent on the inherent gating properties as determined by the expressed GluN2 isoform (GluN2C or GluN2A). We propose that most of these positions are located at sites of transient gating-dependent interactions whose stabilization or destabilization can shift overall gating energetics toward the channel-open or -closed states, respectively.
Materials and Methods
Materials
Methanethiosulfonate (MTS) reagents, 3-(triethylammonium)propyl methanethiosulfonate bromide (PTrEA), [2-(trimethylammonium) ethyl]methanethiosulfonate bromide (MTSET), and 2-aminoethyl methanethiosulfonate hydrobromide (MTSEA), were purchased from Toronto Research Chemicals. The GluN1 glycine site antagonist, 5,7-dichlorokynurenic acid (DCKA), was purchased from Tocris Bioscience. The GluN2 glutamate site antagonist, dl-2-amino-phosphonopentanoic acid (APV), and the NMDA receptor channel blocker, dizocilpine hydrogen maleate (MK801), were purchased from Sigma-Aldrich.
Mutagenesis and expression
Cysteine substitutions in the GluN1 (K526-L533 in S1-M1 and S782-A888 in S2-M4) and GluN2C (R518-P525 in S1-M1 and N781-S789 in S2-M4) subunits were generated using PCR-based methods. Various cysteine-substituted GluN1 and GluN2C subunits were made previously: GluN1 positions D534-L544 (S1-M1), A635-R641 (M3-S2), and T789-A796 (S2-M4) (Beck et al., 1999); GluN2C positions P642-R645 (M3-S2) (Watanabe et al., 2002); and GluN2C positions S526-W537 (S1-M1), A630-V641 (M3-S2), and K790-G798 (S2-M4) (Sobolevsky et al., 2007). Mutations were initially made in clones present in a pSp64T-derived vector. Subsequently, a fragment encompassing the mutation was subcloned back into the wild-type template. All constructs were sequenced over the entire length of the replaced fragment. cRNA was transcribed for each expression construct using SP6 RNA polymerase (Ambion). The cRNA was examined electrophoretically on a denaturing agarose gel. Dilutions of RNA (0.01–0.1 μg/μl) were prepared to achieve optimal expression. Wild-type and mutant GluN1 and GluN2C subunits were coexpressed in Xenopus laevis oocytes. Oocytes were prepared, injected, and maintained as previously described (Sobolevsky et al., 2002). Recordings were made 2–5 d after injections.
In GluN2A, an endogenous cysteine (C399) reacts with MTS reagents resulting in ∼30% inhibition of current amplitudes. Therefore, all of our studies involving GluN2A were done using a GluN2A construct in which this cysteine was mutated to an alanine (C399A) (Choi et al., 2001), referred to here as GluN2A′.
Whole-cell current recordings and data analysis
Whole-cell currents of Xenopus oocytes were recorded at room temperature (20°C) using two microelectrode voltage clamp (TEVC) (DAGAN TEV-200A; Dagan) with Cell Works software (NPI Electronic). Microelectrodes were filled with 3 m KCl and had resistances of 1–4 MΩ. To maximize solution exchange rates, we used a narrow flow-through recording chamber with a small volume of ∼70 μl. When recording GluN1-GluN2C, the external solution consisted of the following (in mm): 115 NaCl, 2.5 KCl, 0.18 CaCl2, and 5 HEPES, pH 7.2, NaOH, unless otherwise noted. When recording GluN1-GluN2A′, BaCl2 was substituted for CaCl2 (to prevent Ca2+-dependent desensitization) and 100 μm EDTA (to minimize Zn2+-mediated modification) was added to the external solution. All reagents, including glutamate (200 μm), glycine (20 μm), APV (100 μm), DCKA (10 μm), and MTS reagents, were applied with the bath solution.
Data analysis was done using Igor Pro (Wavemetrics) and Microsoft Excel. For analysis and illustration, leak currents were subtracted from total currents. Results are presented as mean ± SEM (n ≥ 4). An ANOVA or Student's t test was used to define statistical differences. The Dunnet test was used for multiple comparisons. Significance was assumed to be p < 0.05.
Experimental protocols
NMDA receptor cysteine-substituted mutant channels were probed from the extracellular side with MTS reagents. MTS reagent-containing solutions were prepared, stored, and applied as previously described (Sobolevsky et al., 2002).
Steady-state reactions.
Steady-state reactions were quantified at a holding potential of −60 mV (see Fig. 2A–D). Baseline glutamate-activated current amplitudes (Ipre) were established by three to five 15 s applications of glutamate and glycine. All agonist or any other reagent applications were separated by 30 to 120 s washes in glutamate-free solution. PTrEA (1 mm) was applied for 60 s either in the presence of agonists or in their absence (but in the presence of the competitive antagonists APV and DCKA). After the PTrEA exposure, current amplitudes (Ipost) were determined again using three to five agonist applications. MTSET (1 mm) or MTSEA (1 mm) was applied only in the presence of agonists. The change in glutamate-activated current amplitude, expressed as a percentage (percentage change), was calculated as follows: = (1 − Ipost/Ipre) × 100. In certain instances, we corrected for observed current rundown by fitting a single exponential function to a minimum of three pre-MTS reagent glutamate-activated current amplitudes.
Figure 2.

Steady-state recording protocols to assay accessibility of substituted cysteines to PTrEA. Examples of whole-cell currents recorded from Xenopus oocytes expressing GluN1(P529C)-GluN2C (A), GluN1(E643C)-GluN2C (B), GluN1-GluN2C(S789C) (C), or GluN1(K526C)-GluN2C (D). Currents were elicited by glycine (20 μm) and glutamate (200 μm) (thin lines labeled with “Glu”) at a holding potential of −60 mV. A–C, PTrEA (1 mm) (thick lines) was applied for 60 s in the continuous presence of agonists. D, PTrEA was applied for 60 s in the absence of agonists, but in the presence of the competitive antagonists DCKA (10 μm) and APV (100 μm) (open box). Ipre and Ipost (C) refer to current amplitudes measured before and after application of PTrEA, respectively. PTrEA produced either no effects on glutamate-activated current amplitudes (A), current inhibition (B), or potentiation (C, D). For certain mutants, leak current was also significantly changed after PTrEA application (C).
MK801 inhibition.
MK801 is an irreversible (on the timescale of tens of minutes) open channel blocker at hyperpolarized potentials (Huettner and Bean, 1988), and correspondingly its rate/extent of block has been used previously to index Po (Huettner and Bean, 1988; Jahr, 1992; Rosenmund et al., 1995; Chen et al., 1999). We quantified the rate of MK801 inhibition of open channels using the protocol shown in Figure 6, A and B. A continuous MK801 application in the presence of agonists was started after glutamate-activated currents had reached steady-state (typically 15–30 s) or after PTrEA had potentiated glutamate-activated currents to steady-state levels (typically 45–75 s). Through an initial trial-and-error process for each cysteine-substituted receptor, we adjusted the concentration of MK801 to reach maximal block within 4–10 min: 300 nm for GluN2C(A630C), 200 nm for GluN1 (P787C), 150 nm for GluN2C(E635C), 25 nm for GluN2C(S533C), and 50 nm for the remaining cysteine-substituted receptors. Resulting changes in current amplitude were fitted with a single-exponential function. The reciprocal of the time constant (τ) of this fit multiplied by the concentration of MK801 defined the apparent second-order rate constant for block: k = 1/(τ[MK801]). We used the rate of MK801 whole-cell current inhibition to index relative Po, not an absolute Po, which could be complicated since, in addition to open channel block, MK801 might also interact with the gating machinery (Dilmore and Johnson, 1998). Moreover, for GluN1-GluN2C, (+)MK801 (the stereoisomer we use) does not have the paradoxical pH dependence of increasing the affinity of channel block despite lowering Po that (−)MK801 exhibits (Dravid et al., 2007).
Figure 6.

MK801 current inhibition as an index of Po. A, MK801 inhibition of glutamate-activated currents of wild-type GluN1-GluN2C. After glutamate-activated currents (Glu; thin line) had reached steady state, 50 nm MK801 (unfilled bar) was applied in the presence of agonists until steady-state inhibition was attained. B, MK801 inhibition of glutamate-activated current of GluN1(K526C)-GluN2C without (left) or after (right) PTrEA application (solid bar). When PTrEA was used, MK801 application was initiated once PTrEA-induced potentiation had reached steady state. Inset, The MK801-mediated decays of normalized currents without and after PTrEA (post-PTrEA) were fitted with a single-exponential function (dashed overlays) to determine the time constant τ of inhibition. The arrowhead indicates onset of MK801 inhibition. C, D, Left, Summary of rate constants of MK801 inhibition without (k, unfilled circles) and after (kpost, filled circles) PTrEA for GluN1 (C) and GluN2C (D) potentiation positions. The rate of MK801 inhibition (k) of wild-type GluN1-GluN2C is shown in C. Potentiation positions in M3/M3-S2 are not included in this analysis (see text and supplemental Fig. 2, available at www.jneurosci.org as supplemental material). The asterisks denote positions where the cysteine substitution itself significantly altered the rate of MK801 inhibition compared with wild-type GluN1-GluN2C. NT denotes positions not tested because of small current amplitudes [GluN1(S789C)] or incomplete reaction with PTrEA [GluN2C(I793C)]. In some instances, error bars are smaller than the symbols. C, D, Right, The ratio kpost/k for GluN1 (C) and GluN2C (D) potentiation positions. The dotted line indicates kpost/k = 1. The filled bars indicate positions where the rate of MK801 inhibition after PTrEA was significantly different from that without PTrEA (p < 0.05). E, Correlation between kpost/k and percentage potentiation of whole-cell glutamate-activated current with three linear regressions shown: GluN1 (unfilled squares) and GluN2C (filled squares) positions pooled together (GluN1 + GluN2C) and each subunit considered separately. The R2 value for each respective fit is shown.
Reaction rates.
Reaction rates in the presence of glutamate and glycine (k+) and in their absence but in the presence of APV and DCKA (k−) were determined using “pulsive” protocols (see Fig. 9A,B), as described in detail by Sobolevsky et al. (2002). Changes in current amplitude were fitted with a single exponential. The reciprocal of the time constant (τ) of this fit multiplied by the concentration of the MTS reagent defined the apparent second-order rate constant for chemical modification k+ or k− = 1/(τ [C]).
Figure 9.

PTrEA modification rates for potentiation positions. A, Pulsive protocol to assay PTrEA (black bars) modification rates of GluN1-GluN2C(S788C) in the presence (left) or absence (right) of agonists (thin line). Left, Twenty-five micromolar PTrEA was applied in the continuous presence of agonists in four 15 s pulses for a cumulative 60 s exposure. Right, Two hundred micromolar PTrEA was applied in the absence of agonist, but in the continuous presence antagonists DCKA and APV (open box), in six 15 s pulses for a cumulative 90 s exposure. The dashed lines denote single-exponential fits of current amplitudes as a function of the cumulative time of PTrEA exposure that defines the rate constants of chemical modification in the presence (k+) or absence (k−) of agonists. B, C, Left, Mean values of k+ (filled circles) and k− (open circles) (±2SEM) for GluN1 (B) and GluN2C (C) potentiation positions. In some instances, error bars are smaller than the symbols. B, C, Right, k+/k− for GluN1 (B) and GluN2C (C) potentiation positions. The filled bars indicate positions where PTrEA modification rates in the presence and absence of agonists were significantly different (p < 0.05). The dotted line indicates k+/k− = 1.
Single-channel recordings and analysis
Before recording, oocytes were bathed in a hypertonic solution consisting of the following (in mm): 200 K-aspartate, 20 KCl, 5 EGTA, and 10 HEPES, pH 7.4, KOH, for 5–15 min, and then manually devitellinized. Oocytes were then placed in the recording chamber under the continuous flow of a bathing solution (in mm: 115 NaCl, 2.5 KCl, 0.50 CaCl2, 1 MgCl2, and 5 HEPES, pH 7.2, NaOH). Currents in outside-out patches, isolated from these oocytes, were recorded at room temperature (20–23°C). The recording external solution, which was applied using a single barrel application pipette, was the same as the bathing solution but without added MgCl2; to this solution, we added 0.5 mm glycine and 1 mm glutamate, pH 7.2, NaOH, with or without PTrEA (1 mm). The internal pipette solution contained the following (in mm): 10 KCl, 90 K-gluconate, 2 MgATP, 5 phosphocreatine, 1 BAPTA, and 10 HEPES, pH 7.4, KOH.
Microscopic currents were recorded using an Axopatch 200B amplifier (Molecular Devices) with PatchMaster software (HEKA Elektronik) and were initially filtered at 10 kHz using a four pole low-pass Bessel filter and digitized at 50 kHz. All recordings were made at −80 mV. Pipettes were pulled from thick-walled borosilicate glass, coated with Sylgard (Dow Corning), and fire polished immediately before use. Pipette resistances were 5–25 MΩ when filled with the pipette solution and measured in the bathing solution. The pipette holder was cleaned daily with 70% ethanol and stored in Drierite overnight. The level of the batch solution was kept as low as possible. A typical experiment consisted of at least three continuous control pre-PTrEA 30 s applications of agonists, followed by a 1 min exposure to agonists plus PTrEA (1 mm), and then back to continuous agonist application until the patch became unstable. Although patches certainly contained multiple channels (the exact number was unknown but presumably was between 1 and 8), GluN1-GluN2C receptors have a very low Po (0.01) (Dravid et al., 2008), making double openings extremely rare (<2% of the time). If double openings were more prominent in the baseline recording, we terminated the experiment.
Currents were exported from PatchMaster to Igor Pro for initial processing including subtraction of mean baseline current, resampling, and additional filtering. Records were then exported from Igor Pro to QuB (www.qub.buffalo.edu) for idealization. Idealized records were then exported back to Igor Pro and/or ChannelLab (Synaptosoft) for additional analysis.
Records were idealized using QuB. Currents were resampled at 25 kHz and digitally refiltered at 5 kHz to a final frequency of ≈4.5 kHz. Idealization was done, with an imposed “dead time” of 40 μs (resolution of 80 μs), using the SKM method (Qin, 2004) with a model that had two open classes and one closed class (Stern et al., 1992; Dravid et al., 2008), all interconnected. The amplitude and SD for the single closed state (baseline) was defined using the “grab” function in QuB. We initially also used the “grab” function to estimate amplitudes of the two open classes for wild-type and mutant receptors. The current amplitudes were qualitatively comparable. Nevertheless, to reduce variability because of the specific starting values “grabed,” we set the current amplitudes of the two open classes to −3.2 and −1.8 pA, based on previously published values for single-channel conductance sublevels for recombinant GluN1-GluN2C receptors expressed in oocytes (Stern et al., 1992). The initial SDs of these open classes were set to that for baseline. We then allowed the mean current levels and SDs to be reestimated during idealization.
Current amplitudes for the two conductance levels (lower and higher) were derived from all-point histograms (QuB). Mean lifetimes were derived from single-exponential fits to dwell time histograms of the identified conductance levels. Two exponentials were fit to dwell time histograms of composite open times (ChannelLab). Patch Po was determined from the total open time (low plus high conductance) divided by the total time of the recording. We did not correct for missed events, which would be approximately equivalent for both before and after PTrEA.
Results
To identify key positions in the NMDAR linkers that can influence gating, we took advantage of substituted cysteines in and around the GluN1 and GluN2C linkers (Fig. 1C). We screened these substituted cysteines, one at a time, with the cysteine-reactive reagent PTrEA, anticipating that, given its positive valence and large size, it might in certain instances affect gating movements of the linkers.
Accessibility scan of the GluN1 and GluN2C linkers
The protocol used to determine the effect of PTrEA on whole-cell glycine- and glutamate-activated (referred to as glutamate-activated) current amplitudes for cysteine-substituted NMDARs is illustrated in Figure 2. We compared current amplitudes before (Ipre) and after (Ipost) exposure to extracellular PTrEA (1 mm, thick lines) applied in the continuous presence of agonists (Fig. 2A–C). We also determined PTrEA accessibility in the absence of agonist, but in the presence of the competitive antagonists DCKA (at the GluN1 site) and APV (at the GluN2 site) to minimize channel opening (Fig. 2D). Since NMDARs composed of GluN1 and GluN2C subunits do not undergo any apparent desensitization (Krupp et al., 1996), we assume that, during PTrEA application, the cysteine-substituted GluN1-GluN2C receptors exist primarily in the open and closed states (in the presence of agonists) or in the closed state (in the absence of agonists but presence of antagonists). Similar exposures of wild-type GluN1-GluN2C receptors to PTrEA produced no significant changes in current amplitudes indicating that possible modifications of endogenous cysteines do not affect receptor function.
In terms of whole-cell glutamate-activated currents, three distinct outcomes were observed after PTrEA exposure to cysteine-substituted GluN1-GluN2C receptors: no significant change (Fig. 2A), inhibition (Fig. 2B), or potentiation (Fig. 2C,D). Figures 3–5 summarize the mean percentage change (percentage change) in glutamate-activated current amplitudes of wild-type and mutant GluN1-GluN2C receptors containing substituted cysteines in and around S1-M1 (Fig. 3), M3-S2 (Fig. 4), or S2-M4 (Fig. 5) with PTrEA applied either in the presence (PTrEA+, left) or absence (PTrEA−, right) of agonists. The unfilled bars indicate cysteine-substituted positions where PTrEA application did not significantly change glutamate-activated current amplitudes. The filled bars showing either current inhibition (+ percentage change) or potentiation (− percentage change) indicate positions where percentage change was significantly different from that observed in wild-type GluN1-GluN2C. GluN1(S535C) and GluN2C(L529C) (Fig. 3A,B), denoted by the symbol X, showed no detectable glutamate-activated currents. Current amplitudes in GluN2C(L791C) (denoted by asterisk in Fig. 5B) never reached steady state (up to 4 min agonist application) (data not shown), but they were clearly altered in response to PTrEA. PTrEA-induced current potentiation for GluN2C(I793C) (denoted by double asterisks in Fig. 5B) never reached steady state (up to 5 min and 4 mm PTrEA application was attempted) (data not shown). Figures 3C, 4C, and 5C show a summary of the effects of PTrEA, when applied in the presence of agonists, on the positions tested (adjacent circle): no effect, open circle; inhibition, black circle; and potentiation, red circle. Positions where leak currents (i.e., currents in the absence of agonists) were significantly altered after PTrEA [Fig. 2C, GluN2C(S789C); supplemental Table 1, available at www.jneurosci.org as supplemental material] are highlighted in green.
Figure 3.

Effects of PTrEA on substituted cysteines in and around the GluN1 and GluN2C S1-M1 linkers. A, B, Mean percentage change (±2SEM) in glutamate-activated current amplitudes measured before (Ipre) and after (Ipost) exposure of wild-type and cysteine-substituted GluN1 (A) or GluN2C (B) subunits to PTrEA in the continuous presence (PTrEA+, left) or absence (PTrEA−, right) of agonists. The left and right pointing bars indicate inhibition and potentiation, respectively. For positions with percentage change = −100, potentiation was stronger than 100%. The filled bars indicate that the value of percentage change is statistically different from that of wild-type GluN1-GluN2C (p < 0.05). C, Summary of discrete effects of PTrEA, applied in the presence of agonists, on substituted cysteines in and around the GluN1 and GluN2C S1-M1 linkers. The adjacent circles indicate that positions were tested for reactivity with PTrEA: unfilled circles, no effect on glutamate-activated current; black circles, current inhibition; red circles, current potentiation. X, No detectable glutamate-activated current; green highlight, significant PTrEA-induced change in leak current.
Figure 4.

Effects of PTrEA on substituted cysteines in and around the GluN1 and GluN2C M3-S2 linkers. Same as Figure 3, but for M3-S2.
Figure 5.
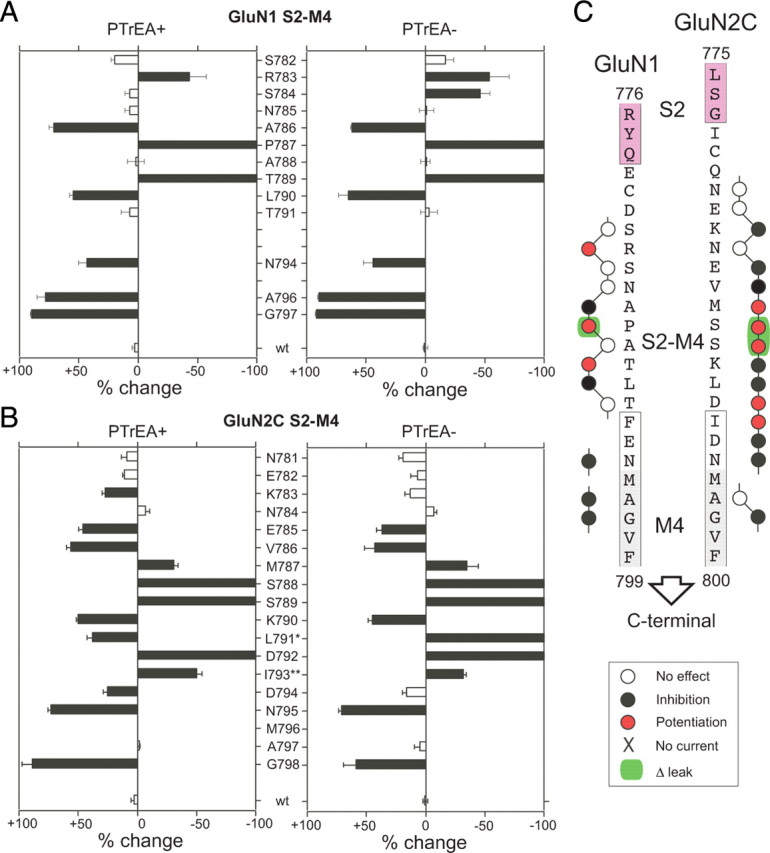
Effects of PTrEA on substituted cysteines in and around the GluN1 and GluN2C S2-M4 linkers. Same as Figure 3, but for S2-M4.
Interpretation of PTrEA-induced effects on cysteine-substituted positions
Because of their extracellular location, the GluN1-GluN2C linkers are widely accessible, with most cysteine-substituted receptors undergoing significant PTrEA-induced changes in glutamate-activated current amplitude (inhibition or potentiation, 68 of 87 positions tested). Additionally, some of the seemingly inaccessible positions (i.e., the white positions [Fig. 4A,B, GluN1(P642C) and GluN2C (I633C), both in M3-S2]) might be accessible, but reaction with PTrEA did not affect glutamate-activated current amplitudes (silent reaction). Overall, the linkers showed limited differences in reactivity when PTrEA was applied either in the presence or absence of agonists. This lack of discrete state dependence probably reflects the extracellular location of the linkers, with no physical barriers (i.e., activation gate, membrane lipids, etc.) preventing global access, but it does not preclude the possibility of local state-dependent restrictions on accessibility below the limits of resolution of the steady-state protocol.
Of the positions that do undergo significant PTrEA-induced changes in glutamate-activated current amplitudes, notable are those that show potentiation after PTrEA (Figs. 3C, 4C, 5C, red positions). Previously, it was proposed, albeit untested, that potentiation after modification by MTS reagents reflects a gating effect with the overall energetics shifted toward channel opening (Yuan et al., 2005; Sobolevsky et al., 2007). Consistent with this idea, 8 of the 18 potentiation positions showed significant PTrEA-induced increases in leak current (supplemental Table 1, available at www.jneurosci.org as supplemental material), suggesting constitutive channel opening after PTrEA (note only 9 total positions showed significant PTrEA-induced increases in leak currents). Surprisingly, the potentiation positions are prominent in S1-M1 and S2-M4—regions typically not associated with channel gating.
To address the possible role of the linkers in gating, we considered the basis for PTrEA-induced changes in current amplitudes by focusing mainly on potentiation positions. Macroscopic whole-cell currents (Iwc) are defined by the equation, Iwc = NγPo, where N is the number of surface receptors, γ is the single-channel conductance, and Po is the open probability of the channel. Within the seconds-to-minutes timescale of PTrEA reaction and consequent modification of current amplitudes, it is unlikely that N changes. Hence, a change in whole-cell current after reaction to PTrEA (or any other MTS reagent) is the net effect of changes in γ (a conductance effect) and Po (a gating effect), ΔIwc = Δγ + ΔPo.
The rate of channel block by MK801 becomes faster in receptors showing PTrEA-induced current potentiation
Initially, to test whether an increase in Po underlies PTrEA-induced current potentiation, we measured rates of whole-cell current inhibition by the mostly irreversible NMDA receptor open channel blocker MK801 (Huettner and Bean, 1988). Since access to the MK801 blocking site in the pore depends on channel opening, the rate of MK801 block in wild-type and cysteine-substituted/PTrEA-treated receptors should be proportional to Po, assuming that the interaction of MK801 with its blocking site is not greatly perturbed (see Materials and Methods) (supplemental Fig. 2, available at www.jneurosci.org as supplemental material).
Figure 6A illustrates MK801-mediated inhibition of glutamate-activated whole-cell current in wild-type GluN1-GluN2C. NMDAR Po is highly dependent on the GluN2 subtype (Chen et al., 1999; Gielen et al., 2009), with GluN2C-containing receptors (Po ∼ 0.01) (Dravid et al., 2008) having a ∼40-fold lower Po than GluN2A-containing receptors (Po ∼ 0.36–0.50) (Erreger et al., 2004; Gielen et al., 2009). Accordingly, the rate of MK801 current inhibition (see Materials and Methods), as determined by the fit of a single-exponential function to the time course of MK801 inhibition of glutamate-activated current (Fig. 6C, dashed overlay), was dramatically slower for GluN1-GluN2C (k = 2.68 × 10⁵ ± 7000 M−1s−1; n = 8) than for GluN1-GluN2A′ (k = 7.44 × 10⁶ ± 1,300,000 M−1s−1; n = 13) (see below) (Gielen et al., 2009).
We compared the rate of MK801 current inhibition for all GluN1 and GluN2C potentiation positions without (open circle) and after (filled circles) PTrEA (Fig. 6B–D). We did not undertake these and subsequent experiments for two S2-M4 potentiation positions: GluN1(T789C) (Fig. 5A), because its pre-PTrEA current amplitude was small (Ipre < 30 nA), making it difficult to obtain a reliable measure of the rate of MK801 inhibition; and GluN2C(I793C), because PTrEA-induced current potentiation did not reach steady state (Fig. 5B, double asterisks). Additionally, all three M3/M3-S2 potentiation positions, GluN1(A635C), GluN2C(A630C), and GluN2C(E635C), showed significantly reduced steady-state MK801 inhibition either before and/or after PTrEA application, along with additional inconsistencies, including a notable rebound of current at the end of the MK801 application (supplemental Fig. 2, available at www.jneurosci.org as supplemental material). Because these deviations suggest that MK801 block itself was disrupted (Yuan et al., 2005; Chang and Kuo, 2008), we did not analyze these M3/M3-S2 potentiation positions further.
For certain positions in S1-M1 and S2-M4, the cysteine substitution itself significantly altered the rate of MK801 inhibition from that of wild type (k ≈ 2.68 × 10⁵): GluN1(P787) at S2-M4 (k = 2.72 × 10⁴ ± 2000; n = 6), GluN2C(S533C) at S1-M1 (6.26 × 10⁵ ± 85,000; n = 7), and GluN2C(D792C) at S2-M4 (4.95 × 10⁵ ± 85,000; n = 5) (Fig. 6C,D, denoted by asterisks). After PTrEA, all tested GluN1 and GluN2C potentiation positions showed a significant increase in the rate of MK801 inhibition (Fig. 6C,D), suggesting that their open probability (Po) was increased. Surprisingly, the relationship between the increase in Po and the corresponding potentiation of current amplitudes showed a poor correlation (R2 = 0.37) when the GluN1 and GluN2C potentiation positions were pooled together (Fig. 6E, GluN1 + GluN2C). However, when the GluN1 and GluN2C potentiation positions were considered separately, the resulting correlation drastically improved, with R2 values of ∼0.8 for either GluN1 or GluN2C (Fig. 6E). We do not fully understand this difference between the subunits but it may be a manifestation of subunit-specific contributions to channel gating (Banke and Traynelis, 2003; Blanke and VanDongen, 2008). Nevertheless, the key point here is that the strong correlation within a subunit strongly supports the idea that potentiation is being driven mainly by an increase in Po. The use of MK801 to index a relative Po is further supported by results with PTrEA-induced inhibition positions (supplemental Fig. 3, available at www.jneurosci.org as supplemental material).
Single-channel activity in a patch increases after PTrEA exposure to receptors containing potentiation positions
Although the MK801 results support the idea that potentiation reflects an increase in Po, there could be some unanticipated systematic effect of PTrEA on the rate of MK801 block. To further verify that PTrEA-induced potentiation is driven by an increase in Po, we measured single-channel activity from outside-out patches isolated from Xenopus oocytes for wild-type receptors and a subset of potentiation positions before and after PTrEA (Fig. 7). We selected one potentiation position in GluN1 S1-M1 (S531), one in GluN2C S1-M1 (V523), and one in GluN2C S2-M4 (S788). Patches certainly contained multiple receptors and we refer to the total time the patch spent in an open state (lower plus higher conductances) as the “patch Po” (see Materials and Methods). For wild-type receptors, the two conductance levels were comparable in amplitude with those reported previously in oocyte patches (Stern et al., 1992), although the mean lifetimes, especially for the higher conductance level, were somewhat longer (supplemental Table 2, available at www.jneurosci.org as supplemental material). As with macroscopic experiments, PTrEA had no notable effects on single-channel currents of wild-type receptors, although there was a slight but insignificant trend toward a reduced patch Po (Po,post/Po = 0.72 ± 0.04; n = 3) (Fig. 7B, right). The three receptors with cysteine-substituted potentiation positions before PTrEA were indistinguishable from wild-type receptors (supplemental Table 2, available at www.jneurosci.org as supplemental material). In contrast, after PTrEA, all three potentiation positions showed a significant increase in patch activity [Po,post/Po, GluN1 (S531C), 3.64 ± 0.67; GluN2C(V523C), 2.13 ± 0.23; GluN2C(S788C), 3.02 ± 0.46; n = 3 for each] (Fig. 7A,B, right). For GluN2C(V523C) and GluN2C(S788C), PTrEA did not affect the amplitude of either the lower- or higher-conductance levels (Fig. 7B, left). For GluN1(S531C), however, along with an increase in Po, PTrEA also significantly reduced the amplitude of the higher conductance (γpost/y, 0.91 ± 0.02) (Fig. 7B). Analysis of open-time distributions before and after PTrEA showed no significant alterations (Fig. 7C), suggesting that the increase in Po was attributable to a decrease in closed time rather than an increase in open time. Overall, in agreement with the MK801 results, the single-channel recordings indicate that PTrEA induces a strong increase in open probability, consistent with the idea that current potentiation arises mainly if not exclusively (at least for the three tested positions) from a gating effect of increasing channel Po.
Figure 7.
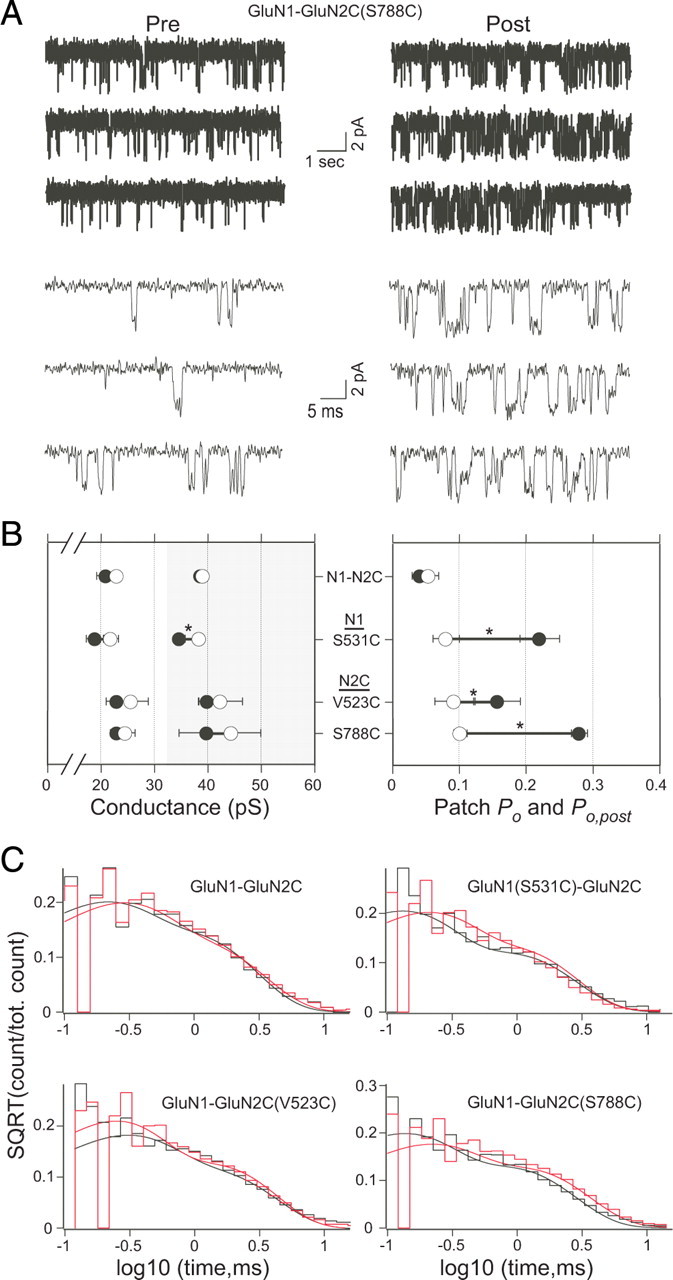
The effect of PTrEA on single-channel currents. A, An example outside-out patch from an oocyte injected with GluN1-GluN2C(S788C) showing glutamate-activated single-channel activity before (pre) and after (post) PTrEA. For display, currents were digitally refiltered at 5 kHz (top) or at 2 kHz (bottom) after being collected at 10 kHz. Holding potential was −80 mV. B, Mean values of conductance (left panel) and patch Po (right panel) before (open circles) and after (filled circles) PTrEA (n = 3 for each receptor) (see also supplemental Table 2, available at www.jneurosci.org as supplemental material). In the conductance graph, the light and shaded parts show the arbitrary ranges for the lower- and higher-conductance levels, respectively. The asterisks denote statistical significance (p < 0.05) in the post/pre ratio from that of the wild-type GluN1-GluN2C. C, Composite open time histograms before (black) and after (red) PTrEA. The data were fit with two exponential components (for values, see supplemental Table 2, available at www.jneurosci.org as supplemental material).
GluN1 potentiation positions show reduced PTrEA-induced current potentiation when coexpressed with GluN2A′
Wild-type GluN1-GluN2C receptors have a low Po (∼0.01) (Dravid et al., 2008). As judged by MK801 inhibition kinetics, all GluN1-GluN2C cysteine-substituted potentiation positions yield receptors with Po in a similarly low range (Fig. 6C,D). After their reaction with PTrEA, all of these potentiation positions showed significant increases in relative Po (Figs. 6C,D, 7). In contrast, wild-type GluN1-GluN2A inherently has a high Po (∼0.36–0.50) (Erreger et al., 2004), making additional increases in Po limited (it can increase a maximum of approximately twofold to threefold to reach Po = 1). If whole-cell current potentiation is a gating effect arising from an increased Po, we reasoned that GluN1 potentiation positions, identified based on coexpression with GluN2C, would show an attenuated degree of PTrEA-induced current potentiation when coexpressed with GluN2A′ (a mutant GluN2A subunit where an endogenous cysteine was mutated to alanine) (see Materials and Methods). Figure 8A–C shows the effect of PTrEA on whole-cell currents for the same GluN1-potentation positions coexpressed with either GluN2C (Fig. 8A,B, left panels) or GluN2A′ (Fig. 8A,B, right panels). As expected, PTrEA-induced potentiation for all GluN1 potentiation positions (Fig. 8C) was significantly reduced when coexpressed with GluN2A′ [Fig. 8A, GluN1(R783C)-GluN2A′] and in some instances was reversed to current inhibition [Fig. 8B, GluN1(S531C)-GluN2A′].
Figure 8.

Steady-state reaction of PTrEA to GluN1 potentiation positions coexpressed with GluN2C or GluN2A′. A, B, Example recordings showing effects of PTrEA on glutamate-activated current amplitudes for the same GluN1 potentiation positions coexpressed with either GluN2C (left) or GluN2A′ (right). The protocol used is identical with that in Figure 2 (see Materials and Methods). For GluN1-GluN2A′ NMDARs, we replaced Ca2+ with Ba2+ and added EDTA to the external solution to limit Ca2+-dependent desensitization and Zn2+-mediated modulation, respectively. We recorded a limited number of identical cysteine-substituted GluN1 positions, coexpressed with GluN2C in the Ba2+- and EDTA-containing solution, and found no significant influence of the differing solutions on PTrEA-induced effects (data not shown). C, Mean percentage change (±2SEM) of glutamate-activated current amplitudes after PTrEA for the GluN1 potentiation positions coexpressed with either GluN2C (black bars) or GluN2A′ (gray bars). The asterisk denotes percentage change not significantly different from the respective control wild-type GluN1-GluN2C or GluN1-GluN2A′ receptors. D, Rate of MK801 current inhibition for GluN1(S531C)-GluN2A′. MK801 (50 nm; unfilled bars) was applied in the continuous presence of agonists (thin black line; Glu) either without (left) or after (middle) PTrEA. The protocols and conditions are the same as in Figure 6B. Single-exponential fits to MK801-mediated decay of normalized currents are shown at right. E, Rate constants k (without PTrEA; unfilled circles) and kpost (after PTrEA; filled circles) of MK801 current inhibition for the two GluN1 positions that showed significant PTrEA-induced current inhibition when coexpressed with GluN2A′ (from C), as well as for GluN1-GluN2A′.
Two GluN1 cysteine-substituted positions, S531C and D534C, showed PTrEA-induced current inhibition when coexpressed with GluN2A′ (Fig. 8B,C). Interestingly, GluN1(S531C), when coexpressed with GluN2C, underwent dual PTrEA-induced effects of increase in Po and decrease in γ (Fig. 7B). We reasoned that this inhibition of GluN1(cys)-GluN2A′ receptors was attributable to a reduction in γ, an effect masked in GluN2C-containing receptors because of their greater increase in Po driving net whole-cell current potentiation. To test this, we measured the rates of MK801-mediated inhibition of currents in GluN1 (S531C)-GluN2A′ and GluN1(D534C)-GluN2A′ without (open circles) and after (filled gray circles) reaction to PTrEA (Fig. 8D,E). As a reference, we also measured the rate of MK801 current inhibition for GluN1-GluN2A′ (Fig. 8E). After PTrEA, the rate of MK801 current inhibition for GluN1 S531C and D534C, coexpressed with GluN2A′, was not significantly altered (kpost/k values = 0.98 ± 0.2 and 1.63 ± 0.4, respectively), in contrast to what occurred when they were coexpressed with GluN2C (Fig. 6C). Thus, the absence of any observable PTrEA-induced changes in Po, as judged from MK801 inhibition kinetics, suggests that a reduction in γ underlies whole-cell current inhibition for these two GluN1 positions coexpressed with GluN2A′.
Overall, these results are consistent with PTrEA-induced current potentiation reflecting mainly a gating effect—an increase in Po. Intriguingly, they also suggest that such modulation of NMDAR gating, mediated by the linkers, is dependent on the intrinsic Po of the receptor, as determined by the expressed GluN2 isoform (GluN2C vs GluN2A). Finally, these results highlight that PTrEA-induced changes in whole-cell currents are the weighted sum of changes in gating (Po) and conductance (γ).
PTrEA accessibility to the potentiation positions is typically reduced in the channel-closed state
PTrEA-induced potentiation of currents in GluN1-GluN2C cysteine-substituted receptors is driven by an apparent gating effect, but what is its structural basis? Many alternatives could be envisioned including that PTrEA in some way increases the rigidity of a specific linker, increasing the efficacy of coupling the conformational change in the LBD to channel opening. Another possibility, the “closed-state contact” hypothesis, is that potentiation positions are located at points of contact with other structural elements—possibly other linkers, proximal parts of the LBD, transmembrane segments, and/or membrane lipids (Sobolevsky et al., 2007). The bulky PTrEA side chain in such a contact interface would therefore sterically (and/or perhaps electrostatically) limit close (although not necessarily tight) apposition of the contacting partners. If this contact interface is part of an energetically stable closed state, then the energetics of activation gating would be shifted toward channel opening after PTrEA, resulting in an increased Po and current potentiation.
If the closed-state contact hypothesis is correct, positions at such interfaces should show restricted accessibility in the closed compared with the open state. None of the potentiation positions in and around S1-M1 (Fig. 3) and S2-M4 (Fig. 5) showed discrete binary state dependence to PTrEA, but these steady-state reactivity experiments (Figs. 2–5) have low resolution for determining state-dependent accessibility. We therefore measured modification rates for PTrEA applied in the presence of agonists, when the channels are open and closed (Fig. 9A, left), or in their absence, when the channels are presumably closed (Fig. 9A, right). For these experiments, we focused on positions that showed >100% steady-state potentiation because of the complications of measuring reaction rates for less robust current potentiation. For six of eight tested positions (S531C and P787C in GluN1 and R518C, V523C, S788C, and S789C in GluN2C), modification rates for PTrEA were significantly slower in the absence of agonist (k−, unfilled circles) than in their presence (k+, filled circles) (Fig. 9B,C, left), with k+/k− ratios ranging from ∼3 to ∼130 (Fig. 9B,C, right). The reduced accessibility in the absence of agonists for these potentiation positions support the notion that they are at contact interfaces in the closed state. For the two other positions, modification rates for PTrEA were either not significantly different [Fig. 9B, GluN1(K526C)] or actually faster [Fig. 9C, GluN2C(E530C)] in the absence than the presence of agonists, suggesting that other mechanisms in addition to the closed-state contact may underlie PTrEA-induced changes in gating.
Degree of whole-cell current potentiation is dependent on the size of the reactive reagent
An additional prediction of the closed-state contact hypothesis is that reagents less bulky than PTrEA would have reduced steric effects and would produce less dramatic increases in Po and correspondingly would elicit attenuated degrees of current potentiation. We therefore compared the effects of three differently sized (but same valence and general structure) MTS reagents—PTrEA, MTSET, and MTSEA, from large to small, respectively (Fig. 10A)—on currents for GluN1 and GluN2C potentiation positions. Because this assay is less dependent on initial (pre-MTS) current amplitudes, we were able to test all S1-M1 and S2-M4 potentiation positions. In general, with smaller-sized reagents (i.e., MTSET and MTSEA), the main phenotypes were either an incremental reduction in potentiation [Fig. 10B, GluN2C(S789C) in S2-M4] or a reversal to net inhibition [Fig. 10C, GluN1(S531C) in S1-M1]. Such size-dependent PTrEA/MTSET/MTSEA patterns occurred for 9 of 13 potentiation positions tested (Fig. 10D,E, positions S531C, D534C, R783C, and P787C in GluN1, and R518C, V523C, S533C, S788C, and S789C in GluN2C) and are consistent with the idea that these potentiation positions are located at closed-state-dependent contact interfaces. Notably, all six potentiation positions showing reduced PTrEA accessibility in the closed state (Fig. 9) also showed size dependence consistent with the closed-state contact hypothesis (Fig. 10).
Figure 10.

Steady-state reaction of potentiation positions with variably sized MTS reagents. A, Chemical structures of the three differently sized MTS reagents tested: PTrEA (black), MTSET (blue), and MTSEA (brown). The diameters of each side group (Lu et al., 1999) are shown. All reagents have the same valence (+1) and general structure. B, C, Glutamate-activated currents for cysteine-substituted GluN1-GluN2C receptors before (Ipre) and after (Ipost) reaction with MTS reagents: PTrEA, black; MTSET, blue; MTSEA, brown. The protocol used was identical with that shown in Figure 2. For comparison of MTS-induced changes in current amplitude, current amplitudes (Ipre) before MTS reagent application were normalized. D, E, Mean percentage change (±2SEM) in current amplitude after steady-state exposure of GluN1 (D) or GluN2C (E) potentiation positions to PTrEA (black), MTSET (blue), or MTSEA (brown) in the continuous presence of agonists. The filled bars indicate that the value of percentage change is statistically different from that of wild-type GluN1-GluN2C channels (p < 0.05). The symbols to the right of bars indicate statistically significant differences (p < 0.05) between the variably sized reagents.
Of the remaining four positions, GluN2C(E530C) in S1-M1 showed strong but not significantly different degrees of current potentiation for all three reagents (Fig. 10E), suggesting that charge rather than steric effects may underlie current potentiation. Positions K526C in GluN1 (Fig. 10D) and M787C in GluN2C (Fig. 10E) did not show any size-dependent PTrEA/MTSET/MTSEA pattern. Additionally, position D792C in GluN2C did show a size-dependent pattern, although it was opposite to our prediction with the degree of current potentiation increasing with larger reagents (Fig. 10E). Based on the homologous position in GluA2, it is likely that the membrane environment is confounding MTS accessibility in an unknown manner.
Discussion
Gating in ionotropic glutamate receptors (GluRs) involves the transduction of structural changes in the LBD initiated by ligand binding/unbinding into physical movements of the ion channel culminating in dilation/constriction of the central pore (Sun et al., 2002; Erreger et al., 2004; Mayer, 2006; Hansen et al., 2007). The transduction machinery between the ligand-binding and transmembrane domains is composed of the linkers S1-M1, M3-S2, and S2-M4. Although M3-S2 is central to the transduction process, our experiments indicate that S1-M1 and S2-M4 can also affect or modulate gating. Furthermore, we identify specific positions in and around S1-M1 and S2-M4 that are important to the energetics of this process and are apparently located at key contact interfaces in the channel-closed state.
PTrEA reaction at potentiation positions in and around S1-M1 and S2-M4 shifts gating equilibrium toward the open state
Of the 87 positions encompassing the GluN1 and GluN2 linkers tested, 18 of them underwent persistent PTrEA-induced potentiation of whole-cell currents (Figs. 2–5), with 15 of these potentiation positions located in the S1-M1 and S2-M4 linkers. All of the S1-M1 and S2-M4 potentiation positions showed a significantly faster rate of block by the open channel blocker MK-801 after PTrEA than before it (Fig. 6), suggesting that current potentiation is attributable to an increase in Po. Confirming this, three potentiation positions [GluN1(S531C), GluN2C(V523C), GluN2C (S788C)] tested with single-channel recordings all showed a significant increase in Po after PTrEA (Fig. 7). Thus, PTrEA-induced potentiation of whole-cell currents arises mainly if not exclusively—assuming MK801 is a valid (relative) index of Po—from a gating effect of an increase in the time the receptor spends in the open state, indicating that the dynamics of the S1-M1 and S2-M4 linkers are important components of the NMDAR gating process.
An increase in Po could arise in one of two ways: either by destabilization of the closed state or stabilization of the open state. Analysis of single-channel recordings of receptors containing potentiation positions showed that, after PTrEA, they had an increased Po (Fig. 7A,B) with no significant changes in open time durations (Fig. 7C). Thus, at least for these positions, the increase in Po most likely arises from a destabilization of the closed state. Additionally, PTrEA-induced potentiation positions were often associated with significant increases in leak currents (supplemental Table 1, available at www.jneurosci.org as supplemental material). Although we did not explore in detail these changes in leak currents, they most likely reflect constitutively open PTrEA-reacted NMDARs (Yuan et al., 2005; Schmid et al., 2007; Sobolevsky et al., 2007), presumably because of a destabilized closed state. However, for those potentiation positions not directly tested with single-channel recordings, we cannot rule out that increases in Po arise from stabilization of the open state.
Structural basis underlying PTrEA-induced increases in Po
The structural basis underlying PTrEA-induced increases in Po is certainly not the same for all potentiation positions, but identifying these mechanisms will help define elementary gating steps after ligand binding but preceding ion channel opening. One structural mechanism we considered is that certain potentiation positions are located at dynamic contact interfaces in the closed state and that the introduction of a bulky side chain at these positions sterically disrupts the stability of this state, thus shifting gating equilibrium toward the open state (the closed-state contact hypothesis).
Consistent with this hypothesis, we found that most tested potentiation positions showed a reduced degree of access in the closed compared with the open state (Fig. 9). Additionally, the degree of potentiation for 9 of the 13 positions was reduced with decreasing MTS reagent size (Fig. 10), suggesting that steric constraints are important to the gating effect (for a summary of all potentiation positions, see supplemental Table 3, available at www.jneurosci.org as supplemental material). Notable for these experiments is that positions tested for both state and size dependence showed consistent patterns: either they showed dependencies in both parameters [e.g., GluN1(S531C)] or they showed dependencies in neither parameter [e.g., GluN1(K526C)]. Thus, based on two independent experimental approaches, a subset of the potentiation positions (Fig. 11, red arrowheads) appear to be located at contact interfaces in the channel-closed state. These contact interfaces could be important to receptor function because of specific and local interactions (e.g., electrostatics) between the contacting partners in the closed state or they may be part of the transient state-dependent positioning of the overall linkers/transmembrane segments during gating.
Figure 11.

Summary of linker positions affecting gating. Summary of discrete effects of PTrEA, applied in the presence of agonists, on substituted cysteines in and around the GluN1 and GluN2C linkers. The adjacent circles indicate that positions were tested for reactivity with PTrEA: unfilled circles, no effect on glutamate-activated current; black circles, current inhibition; red circles, current potentiation. X, No detectable glutamate-activated current; green highlight, significant PTrEA-induced change in leak current (from Figs. 3C, 4C, 5C). Also highlighted here are the nine potentiation positions proposed to be at transient contact interface in the closed state (red arrowheads).
Although there is uncertainty in relating specific positions in the NMDAR linkers to those in the AMPAR structure (supplemental Fig. 1, available at www.jneurosci.org as supplemental material), there are some intriguing “hot spots” of potentiation positions. One notable hot spot comprises the adjacent serines in GluN2C S2-M4, S788 and S789 (Fig. 11). In the closed-state AMPAR structure (PDB ID 3KG2), the analogous positions T784 and S785 are located within 4 Å of the extracellular end of the highly conserved SYTANLAAF motif in M3/M3-S2 of an adjacent subunit. This motif contains the “Lurcher” position, substitution of which in NMDARs has strong effects on gating (Jones et al., 2002; Yuan et al., 2005), and the activation gate of the channel (Chang and Kuo, 2008; Sobolevsky et al., 2009). However, reflecting the potential complexity in identifying interactions in the linkers, these S2-M4 positions are also proximal (<8 Å) to M3/M3-S2 in the same subunit and M1/S1-M1 in an adjacent subunit. Thus, even with an available structure, identifying gating-dependent contacting partners will be challenging. Nevertheless, identifying them and defining their relative dynamics during gating will be essential in elaborating mechanisms coupling LBD conformational changes to ion channel opening/closing.
Certain positions showed discrete state-dependent accessibility (i.e., apparently accessible in the open but not in the closed state) to PTrEA, suggesting that they are at dynamic contact interfaces, yet PTrEA did not induce current potentiation [Fig. 3B, GluN2C(P531C)]. One possibility is that modification at these positions produced a stronger conductance effect (decrease in γ) outweighing any gating effect (increase in Po), thus resulting in net inhibition. Alternatively (or in addition to), the contact interface at these positions may make only minor contributions to the overall energetics of the closed state. This latter alternative is intriguing since it suggests that potentiation positions are specifically identifying linker elements (or structures) that are critical to gating.
PTrEA-induced gating effects are specific to the GluN2 subunit and dependent on the intrinsic Po of the NMDAR
GluN1 potentiation positions, defined by coexpression with GluN2C, showed reduced degrees of PTrEA-induced current potentiation when coexpressed with GluN2A′ (Fig. 8). NMDAR Po is GluN2 subunit specific (Chen et al., 1999; Gielen et al., 2009; Yuan et al., 2009). GluN2A-containing NMDARs have a relatively high intrinsic Po (0.36–0.50) (Erreger et al., 2004), whereas for GluN2C-containing NMDARs it is much lower (∼0.01) (Dravid et al., 2008). Hence, for GluN2A-containing receptors, the energetics of channel gating are already shifted more toward the open state than for GluN2C-containing receptors, limiting the potential for additional increases. In contrast, for GluN2C-containing receptors, where channel opening is intrinsically disfavored, there exists greater energetic “room” to increase Po. Thus, the inherent biophysical gating properties of NMDARs dictate the directionality and extent of linker-mediated modulation of gating.
Novel sites and mechanism of modulating NMDAR function
NMDARs are implicated in diverse neurological and psychiatric diseases (Kalia et al., 2008). However, since they are ubiquitous in the CNS and subserve numerous physiological functions, selective targeting of dysfunctional NMDARs is essential for any clinically useful drug. Indeed, competitive antagonists at either the GluN1 glycine-binding site or the GluN2 glutamate-binding site have been abandoned in clinical trials (Kalia et al., 2008) mainly because of their indiscriminate actions on all NMDARs. In contrast, allosteric modulators at the N-terminal domain, such as the GluN2B-specific ifenprodil, show promise in subunit-specific targeting, although their clinical utility is yet unknown (Paoletti and Neyton, 2007). At the ion channel, several classes of pore blockers are used for limited purposes (e.g., ketamine for anesthesia and memantine for moderate-to-severe Alzheimer's disease) (Lipton, 2006).
Here, we identify the NMDAR linker region as a novel pharmacologic target wherein drug action, in a noncompetitive mechanism, could modulate gating. The linkers are extracellularly exposed, as evidenced from their wide accessibility to PTrEA (Figs. 3–5). More specifically, targeting of S1-M1 and S2-M4, which are remote from the central axis of the pore and do not directly control channel gating (unlike M3-S2), may offer more subtle means of modulating NMDAR function, potentially lessening side effects. Finally, since the proposed mechanism of drug action at the linkers regulates gating energetics, any modulation of receptor activity is dictated by the inherent gating properties of the NMDAR, which themselves are highly dependent on the specific GluN2 subunit. This concept can be used to attain subunit specificity in drug action and exploit the spatiotemporal localization of the different GluN2 subunits in the CNS. Hence, NMDAR activity can be strongly potentiated for GluN1-GluN2C, whereas it can be strongly inhibited for GluN1-GluN2A. Intriguingly, memantine and amantadine, two drugs currently in clinical use and known to function as pore blockers, might also have gating effects by interacting with the linkers as secondary sites of action (Blanpied et al., 2005; Chen and Lipton, 2005; Kotermanski et al., 2009).
Footnotes
This work was supported by National Institutes of Health–National Institute of Mental Health Grant R01 MH066892 (L.P.W.), an American Heart Association Predoctoral Fellowship (I.T.), and Howard Hughes Medical Institute Grant 52005887 and Undergraduate Research and Creative Activities fellowships (P.B.). We thank Martin Prieto and Catherine Salussolia for helpful discussions and/or comments on this manuscript.
References
- Balannik V, Menniti FS, Paternain AV, Lerma J, Stern-Bach Y. Molecular mechanism of AMPA receptor noncompetitive antagonism. Neuron. 2005;48:279–288. doi: 10.1016/j.neuron.2005.09.024. [DOI] [PubMed] [Google Scholar]
- Banke TG, Traynelis SF. Activation of NR1/NR2B NMDA receptors. Nat Neurosci. 2003;6:144–152. doi: 10.1038/nn1000. [DOI] [PubMed] [Google Scholar]
- Beck C, Wollmuth LP, Seeburg PH, Sakmann B, Kuner T. NMDAR channel segments forming the extracellular vestibule inferred from the accessibility of substituted cysteines. Neuron. 1999;22:559–570. doi: 10.1016/s0896-6273(00)80710-2. [DOI] [PubMed] [Google Scholar]
- Blanke ML, VanDongen AM. The NR1 M3 domain mediates allosteric coupling in the N-methyl-d-aspartate receptor. Mol Pharmacol. 2008;74:454–465. doi: 10.1124/mol.107.044115. [DOI] [PubMed] [Google Scholar]
- Blanpied TA, Clarke RJ, Johnson JW. Amantadine inhibits NMDA receptors by accelerating channel closure during channel block. J Neurosci. 2005;25:3312–3322. doi: 10.1523/JNEUROSCI.4262-04.2005. [DOI] [PMC free article] [PubMed] [Google Scholar]
- Chang HR, Kuo CC. The activation gate and gating mechanism of the NMDA receptor. J Neurosci. 2008;28:1546–1556. doi: 10.1523/JNEUROSCI.3485-07.2008. [DOI] [PMC free article] [PubMed] [Google Scholar]
- Chen HS, Lipton SA. Pharmacological implications of two distinct mechanisms of interaction of memantine with N-methyl-d-aspartate-gated channels. J Pharmacol Exp Ther. 2005;314:961–971. doi: 10.1124/jpet.105.085142. [DOI] [PubMed] [Google Scholar]
- Chen N, Luo T, Raymond LA. Subtype-dependence of NMDA receptor channel open probability. J Neurosci. 1999;19:6844–6854. doi: 10.1523/JNEUROSCI.19-16-06844.1999. [DOI] [PMC free article] [PubMed] [Google Scholar]
- Choi Y, Chen HV, Lipton SA. Three pairs of cysteine residues mediate both redox and Zn2+ modulation of the NMDA receptor. J Neurosci. 2001;21:392–400. doi: 10.1523/JNEUROSCI.21-02-00392.2001. [DOI] [PMC free article] [PubMed] [Google Scholar]
- Cull-Candy SG, Leszkiewicz DN. Role of distinct NMDA receptor subtypes at central synapses. Sci STKE. 2004;2004:re16. doi: 10.1126/stke.2552004re16. [DOI] [PubMed] [Google Scholar]
- Dilmore JG, Johnson JW. Open channel block and alteration of N-methyl-d-aspartic acid receptor gating by an analog of phencyclidine. Biophys J. 1998;75:1801–1816. doi: 10.1016/S0006-3495(98)77622-2. [DOI] [PMC free article] [PubMed] [Google Scholar]
- Dravid SM, Erreger K, Yuan H, Nicholson K, Le P, Lyuboslavsky P, Almonte A, Murray E, Mosely C, Barber J, French A, Balster R, Murray TF, Traynelis SF. Subunit-specific mechanisms and proton sensitivity of NMDA receptor channel block. J Physiol. 2007;581:107–128. doi: 10.1113/jphysiol.2006.124958. [DOI] [PMC free article] [PubMed] [Google Scholar]
- Dravid SM, Prakash A, Traynelis SF. Activation of recombinant NR1/NR2C NMDA receptors. J Physiol. 2008;586:4425–4439. doi: 10.1113/jphysiol.2008.158634. [DOI] [PMC free article] [PubMed] [Google Scholar]
- Erreger K, Chen PE, Wyllie DJ, Traynelis SF. Glutamate receptor gating. Crit Rev Neurobiol. 2004;16:187–224. doi: 10.1615/critrevneurobiol.v16.i3.10. [DOI] [PubMed] [Google Scholar]
- Gielen M, Siegler Retchless B, Mony L, Johnson JW, Paoletti P. Mechanism of differential control of NMDA receptor activity by NR2 subunits. Nature. 2009;459:703–707. doi: 10.1038/nature07993. [DOI] [PMC free article] [PubMed] [Google Scholar]
- Hansen KB, Yuan H, Traynelis SF. Structural aspects of AMPA receptor activation, desensitization and deactivation. Curr Opin Neurobiol. 2007;17:281–288. doi: 10.1016/j.conb.2007.03.014. [DOI] [PubMed] [Google Scholar]
- Huettner JE, Bean BP. Block of N-methyl-d-aspartate-activated current by the anticonvulsant MK-801: selective binding to open channels. Proc Natl Acad Sci U S A. 1988;85:1307–1311. doi: 10.1073/pnas.85.4.1307. [DOI] [PMC free article] [PubMed] [Google Scholar]
- Jahr CE. High probability opening of NMDA receptor channels by l-glutamate. Science. 1992;255:470–472. doi: 10.1126/science.1346477. [DOI] [PubMed] [Google Scholar]
- Jones KS, VanDongen HM, VanDongen AM. The NMDA receptor M3 segment is a conserved transduction element coupling ligand binding to channel opening. J Neurosci. 2002;22:2044–2053. doi: 10.1523/JNEUROSCI.22-06-02044.2002. [DOI] [PMC free article] [PubMed] [Google Scholar]
- Kalia LV, Kalia SK, Salter MW. NMDA receptors in clinical neurology: excitatory times ahead. Lancet Neurol. 2008;7:742–755. doi: 10.1016/S1474-4422(08)70165-0. [DOI] [PMC free article] [PubMed] [Google Scholar]
- Kotermanski SE, Wood JT, Johnson JW. Memantine binding to a superficial site on NMDA receptors contributes to partial trapping. J Physiol. 2009;587:4589–4604. doi: 10.1113/jphysiol.2009.176297. [DOI] [PMC free article] [PubMed] [Google Scholar]
- Krupp JJ, Vissel B, Heinemann SF, Westbrook GL. Calcium-dependent inactivation of recombinant N-methyl-d-aspartate receptors is NR2 subunit specific. Mol Pharmacol. 1996;50:1680–1688. [PubMed] [Google Scholar]
- Krupp JJ, Vissel B, Heinemann SF, Westbrook GL. N-terminal domains in the NR2 subunit control desensitization of NMDA receptors. Neuron. 1998;20:317–327. doi: 10.1016/s0896-6273(00)80459-6. [DOI] [PubMed] [Google Scholar]
- Krystal JH, D'Souza DC, Mathalon D, Perry E, Belger A, Hoffman R. NMDA receptor antagonist effects, cortical glutamatergic function, and schizophrenia: toward a paradigm shift in medication development. Psychopharmacology (Berl) 2003;169:215–233. doi: 10.1007/s00213-003-1582-z. [DOI] [PubMed] [Google Scholar]
- Lipton SA. Paradigm shift in neuroprotection by NMDA receptor blockade: memantine and beyond. Nat Rev Drug Discov. 2006;5:160–170. doi: 10.1038/nrd1958. [DOI] [PubMed] [Google Scholar]
- Lu T, Nguyen B, Zhang X, Yang J. Architecture of a K+ channel inner pore revealed by stoichiometric covalent modification. Neuron. 1999;22:571–580. doi: 10.1016/s0896-6273(00)80711-4. [DOI] [PubMed] [Google Scholar]
- Mayer ML. Glutamate receptor ion channels. Curr Opin Neurobiol. 2005;15:282–288. doi: 10.1016/j.conb.2005.05.004. [DOI] [PubMed] [Google Scholar]
- Mayer ML. Glutamate receptors at atomic resolution. Nature. 2006;440:456–462. doi: 10.1038/nature04709. [DOI] [PubMed] [Google Scholar]
- Oswald RE, Ahmed A, Fenwick MK, Loh AP. Structure of glutamate receptors. Curr Drug Targets. 2007;8:573–582. doi: 10.2174/138945007780618526. [DOI] [PubMed] [Google Scholar]
- Paoletti P, Neyton J. NMDA receptor subunits: function and pharmacology. Curr Opin Pharmacol. 2007;7:39–47. doi: 10.1016/j.coph.2006.08.011. [DOI] [PubMed] [Google Scholar]
- Qin F. Restoration of single-channel currents using the segmental k-means method based on hidden Markov modeling. Biophys J. 2004;86:1488–1501. doi: 10.1016/S0006-3495(04)74217-4. [DOI] [PMC free article] [PubMed] [Google Scholar]
- Rosenmund C, Feltz A, Westbrook GL. Synaptic NMDA receptor channels have a low open probability. J Neurosci. 1995;15:2788–2795. doi: 10.1523/JNEUROSCI.15-04-02788.1995. [DOI] [PMC free article] [PubMed] [Google Scholar]
- Schmid SM, Körber C, Herrmann S, Werner M, Hollmann M. A domain linking the AMPA receptor agonist binding site to the ion pore controls gating and causes lurcher properties when mutated. J Neurosci. 2007;27:12230–12241. doi: 10.1523/JNEUROSCI.3175-07.2007. [DOI] [PMC free article] [PubMed] [Google Scholar]
- Sobolevsky AI, Beck C, Wollmuth LP. Molecular rearrangements of the extracellular vestibule in NMDAR channels during gating. Neuron. 2002;33:75–85. doi: 10.1016/s0896-6273(01)00560-8. [DOI] [PubMed] [Google Scholar]
- Sobolevsky AI, Prodromou ML, Yelshansky MV, Wollmuth LP. Subunit-specific contribution of pore-forming domains to NMDA receptor channel structure and gating. J Gen Physiol. 2007;129:509–525. doi: 10.1085/jgp.200609718. [DOI] [PMC free article] [PubMed] [Google Scholar]
- Sobolevsky AI, Rosconi MP, Gouaux E. X-ray structure, symmetry and mechanism of an AMPA-subtype glutamate receptor. Nature. 2009;462:745–756. doi: 10.1038/nature08624. [DOI] [PMC free article] [PubMed] [Google Scholar]
- Stern P, Béhé P, Schoepfer R, Colquhoun D. Single-channel conductances of NMDA receptors expressed from cloned cDNAs: comparison with native receptors. Proc Biol Sci. 1992;250:271–277. doi: 10.1098/rspb.1992.0159. [DOI] [PubMed] [Google Scholar]
- Südhof TC, Malenka RC. Understanding synapses: past, present, and future. Neuron. 2008;60:469–476. doi: 10.1016/j.neuron.2008.10.011. [DOI] [PMC free article] [PubMed] [Google Scholar]
- Sun Y, Olson R, Horning M, Armstrong N, Mayer M, Gouaux E. Mechanism of glutamate receptor desensitization. Nature. 2002;417:245–253. doi: 10.1038/417245a. [DOI] [PubMed] [Google Scholar]
- Villarroel A, Regalado MP, Lerma J. Glycine-independent NMDA receptor desensitization: localization of structural determinants. Neuron. 1998;20:329–339. doi: 10.1016/s0896-6273(00)80460-2. [DOI] [PubMed] [Google Scholar]
- Watanabe J, Beck C, Kuner T, Premkumar LS, Wollmuth LP. DRPEER: a motif in the extracellular vestibule conferring high Ca2+ flux rates in NMDA receptor channels. J Neurosci. 2002;22:10209–10216. doi: 10.1523/JNEUROSCI.22-23-10209.2002. [DOI] [PMC free article] [PubMed] [Google Scholar]
- Waxman EA, Lynch DR. N-Methyl-d-aspartate receptor subtypes: multiple roles in excitotoxicity and neurological disease. Neuroscientist. 2005;11:37–49. doi: 10.1177/1073858404269012. [DOI] [PubMed] [Google Scholar]
- Yelshansky MV, Sobolevsky AI, Jatzke C, Wollmuth LP. Block of AMPA receptor desensitization by a point mutation outside the ligand-binding domain. J Neurosci. 2004;24:4728–4736. doi: 10.1523/JNEUROSCI.0757-04.2004. [DOI] [PMC free article] [PubMed] [Google Scholar]
- Yuan H, Erreger K, Dravid SM, Traynelis SF. Conserved structural and functional control of N-methyl-d-aspartate receptor gating by transmembrane domain M3. J Biol Chem. 2005;280:29708–29716. doi: 10.1074/jbc.M414215200. [DOI] [PubMed] [Google Scholar]
- Yuan H, Hansen KB, Vance KM, Ogden KK, Traynelis SF. Control of NMDA receptor function by the NR2 subunit amino-terminal domain. J Neurosci. 2009;29:12045–12058. doi: 10.1523/JNEUROSCI.1365-09.2009. [DOI] [PMC free article] [PubMed] [Google Scholar]