Abstract
Microbubble mediated disruption of the blood brain barrier (BBB) for targeted drug delivery using focused ultrasound shows great potential as a therapy for a wide range of brain disorders. This technique is currently at the pre-clinical stage and important work is being conducted in animal models. Measurements of standing waves in ex vivo rat skulls were conducted using an optical hydrophone and a geometry dependence was identified. Standing waves could not be eliminated through the use of swept frequencies, which have been suggested to eliminate standing waves. Definitive standing wave patterns were detected in over 25% of animals used in a single study. Standing waves were successfully eliminated using a wideband composite sharply focused transducer and a reduced duty cycle. The modified pulse parameters were used in vivo to disrupt the BBB in a rat indicating that, unlike some other bioeffects, BBB disruption is not dependant on standing wave conditions. Due to the high variability of standing waves and the inability to correctly estimate in situ pressures given standing wave conditions, attempts to minimize standing waves should be made in all future work in this field to ensure that results are clinically translatable.
Introduction
Transcranial ultrasound therapy has the potential to non-invasively treat a wide range of brain disorders. Promising work has been published on ablation of brain tissue [Clement et al.,2000; Pernot et al., 2007; Martin et al., 2009; McDannold et al., 2010] using high intensity focused ultrasound, and on low pressure procedures, such as the disruption of the blood-brain barrier (BBB) for the targeted delivery of therapeutics [Hynynen et al., 2001; McDannold et al., 2006; Kinoshita et al, 2006; Choi et al. 2007; Treat et. al., 2007; Bing et al. 2009].
Low frequencies are favorable in transcranial ultrasound, as at low frequencies the attenuation and aberration of the sound by the skull bone is reduced when compared with higher frequencies, allowing for a sharp in situ focus. However, low frequencies can also give rise to standing waves in the brain, since the attenuation in brain tissue is lower and reflections at the brain/skull interface are high. Azuma et al. [2005] observed standing wave formation inside the skull at an insonation frequency of 500 kHz using Schlieren imaging, while at 2 MHz no standing waves were detected.
Recently, a group has proposed a technique using non-focused ultrasound at very low frequency (28 kHz) to disrupt the blood-brain barrier [Liu et al., 2010]. Although this study reported a low incidence of hemorrhage, clinical experience has shown that the use of non-focused ultrasound in the brain can have serious complications. The TRUMBI study [Daffertshofer et al., 2005], which used 300 kHz planar ultrasound transducers to treat stroke, was prematurely stopped when 5 patients who received ultrasound treatment developed symptomatic hemorrhages possibly related to the treatment, of which one instance of symptomatic hemorrhage resulted in patient death. Standing waves were later identified as a possible cause of the secondary hemorrhage reported in a simulation study based on the TRUMBI clinical study parameters [Baron et al, 2009]. The same simulation study found that a focused 2 MHz transducer reduced the standing wave effects to a negligible level, and no secondary effects resulting from the ultrasound treatment were seen in the CLOTBUST stroke trial [Alexandrov et al., 2004], from which the simulation parameters were taken. Although a major issue in the human brain, standing wave formation is especially prevalent in pre-clinical animal models, where the distance traveled by the sound between the top and bottom of the skull is short, on the order of a few wavelengths when clinically relevant frequencies are used.
Standing waves not only increase the peak pressures delivered, but can create regions of high pressure outside of the focus, causing undesired heating and damage [Connor and Hynynen, 2004; Tang and Clement, 2009]. Additionally, cavitation events may occur more readily in the presence of standing wave fields than in travelling wave fields [Kerr et al., 1989], as bubbles driven below resonance migrate towards standing wave antinodes [Eller, 1968]. While standing waves are favorable in some ultrasound applications [Kinoshita and Hynynen, 2007], results of procedures dependent on bubble activity, such as BBB disruption, may be biased if standing waves are not taken into consideration. In order to produce clinically translatable treatment parameters, the effects of standing waves must be examined and minimized.
Several methods have been suggested to suppress standing waves in transcranial therapy. Hemispherical or large aperture arrays [Sun and Hynynen 1999, Clement et al, 2000; Pernot et al., 2007; Tanter et al, 2007; Song and Hynynen, 2009] distribute the sound over a larger aperture and create a tight focus. With a large number of elements spread over such a large area, geometrical effects of the skull reduce the potential for standing waves and the power from the individual elements is small enough that if standing waves occur, their effects will be greatly reduced. However, in small-animal preclinical models, such large aperture arrays are unnecessary for aberration correction, given the thickness of the skull bone, and geometrically difficult to implement given the anatomy of the test animals.
Transmit signal modulation techniques have been shown to reduce the effects of standing waves. Sweep frequencies have been used to reduce standing wave formation in vibro-acoustography [Mitri, 2005] and in radiation force measurements [Erpelding et al, 2006]. Recently, a similar technique using random phase modulation of the ultrasound signal has been suggested to break the symmetry of the ultrasound and inhibit standing wave formation [Tang and Clement, 2009].
In this study, standing waves are identified in an animal study and are reproduced in an ex vivo skull. Methods of eliminating standing waves are examined, and a purely travelling wave field is used to disrupt the BBB in rats. The results of this study and their implications for previous and future work in this field, including future clinical applications, are discussed.
Materials and Methods
Generation of Ultrasound
Four different transducers, summarized in table 1, were used for the experiments: Transducer 1 was in-house constructed with a diameter and radius of curvature of 5 cm and fundamental frequency of 268 kHz. The transducer was driven at its fundamental frequency and 3rd, 5th, 7th and 9th harmonics (841 kHz, 1.409 MHz, 1.972 MHz, 2.53 MHz) using external matching circuits. Transducer 2 was in-house constructed with a diameter and radius of curvature of 5 cm and fundamental frequency of 548 kHz. Transducer 3 was also in-house constructed with a diameter of 10 cm, radius of curvature of 8 cm and fundamental frequency of 0.558 kHz. Transducer 4 was a wideband composite transducer, with 8 element sectors (10 cm aperture, FN=0.8, Imasonic, Inc., Voray-sur-L’Ognon, France), and was driven as a single element spherically focused transducer at 1.503 MHz. In the in vitro experiments, the transducers were driven using a Tektronix AFG3012 function generator (Tektronix, TX, USA) and an A-150 RF power amplifier (E&I, Rochester, NY, USA). The transducers used in the in vivo experiments were driven using two different setups, that described by Chopra et al.(2009), and a second setup consisting of a AFG3102 Tektronic function generator providing an external trigger to an Agilent 33220A (Agilent, Santa Clara, CA, USA) function generator and a NP2519 (NP Technology, Newbury Park, CA, USA) RF power amplifier. This second setup allowed the modified waveforms described in the following section to be generated. Acoustic emissions were monitored for all sonications at 1.503 MHz using the integrated hydrophone in the centre of the transducer (centre frequency 0.75 MHz), and captured using a LeCroy WavePro 715Zi oscilloscope (LeCroy, Chestnut Ridge, NY, USA). The acoustic emissions capture time, limited by the memory of the oscilloscope, was the first 30 seconds of each sonication. This was deemed sufficient to capture activity resulting from the bolus peak.
Table 1.
Transducer Characteristics
| Transducer | Frequency (MHz) |
Aperture (cm) | F-number | Fabrication |
|---|---|---|---|---|
| 1 | 0.268 | 5 | 1 | in-house |
| 2 | 0.548 | 5 | 1 | in-house |
| 3 | 0.558 | 10 | 0.8 | in-house |
| 4 | 1.503 | 10 | 0.8 | Imasonic* |
Imasonic Inc, Voray-sur-L’Orgnon, France
Ex Vivo Standing Wave Measurements
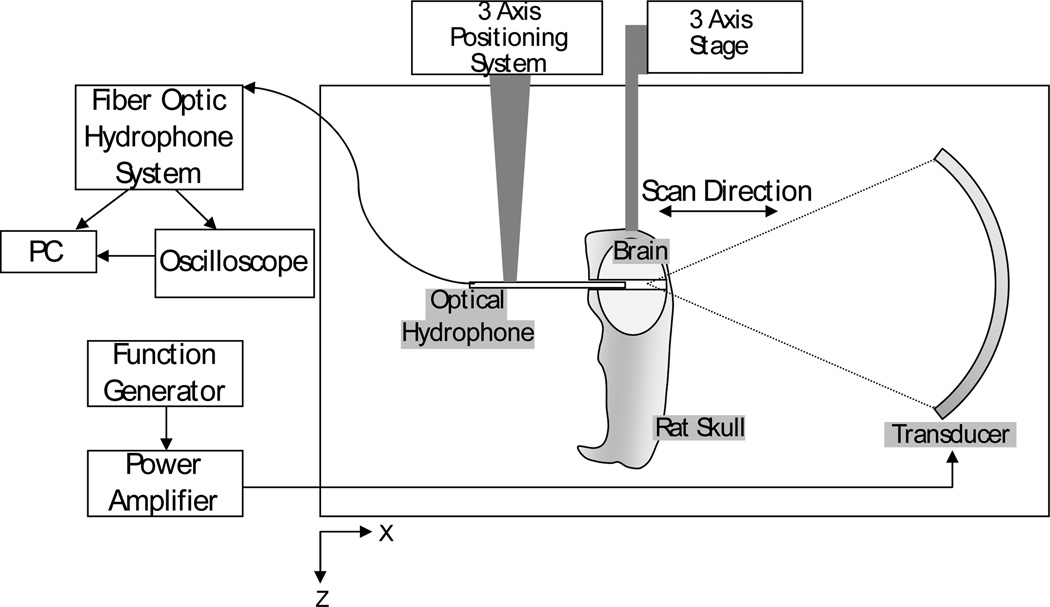
Two ex-vivo rat skulls, complete except for the lower mandible, with intact brains were fixed in 10% buffered formalin. A 1 mm diameter hole was drilled through the skull base and brain, stopping at the interior wall of the top of the skull. The skulls were degassed in a vacuum chamber to remove any trapped air. The skulls were mounted in a fixture within a large tank on a three axis stage, as illustrated in figure 1. The drilled hole was flushed with degassed water to ensure that no trapped bubbles remained. The walls and bottom of the tank were lined with rubber padding to minimize reflections. A 10 µm tapered fiber-optic hydrophone (Precision Acoustics Ltd., Dorset, UK) was mounted on a three axis positioning system. Silicon rubber was applied to the hydrophone mount to prevent reflections. All hydrophone signals were captured by the optical hydrophone system (Precision Acoustics Ltd., Dorset, UK) and were transferred to PC using a GPIB interface and LABVIEW software (National Instruments, TX, USA). Analysis of the data was performed in MATLAB (Mathworks, MA, USA).
Figure 1.
Experimental setup for detection of standing waves in the brain using an optical hydrophone
Using a linear scan, the focus of the transducer was located and for each frequency of transducer 1 the axial pressure at the focus was recorded. A skull was then placed between the transducer and the hydrophone, and the raster scans were repeated, scanning from 10 mm post-focal to 5 mm pre-focal along the acoustic axis of the transducer, and using the hydrophone to measure the pressures in the brain. The position of the hydrophone line scan with respect to the transducer remained the same before and after insertion of the skull. The effects of using swept frequencies were examined for transducers 1 and 4 by capturing scans for swept frequencies with 100 kHz, 200 kHz and 300 kHz bandwidths at centre frequencies of 841 kHz and 1.503 MHz. The frequency sweeps occurred over a period of 1 ms, corresponding to average time rates of change of 100 – 300 MHz/s. The sweep period was limited by the Tektronix AFG3012 function generator used.
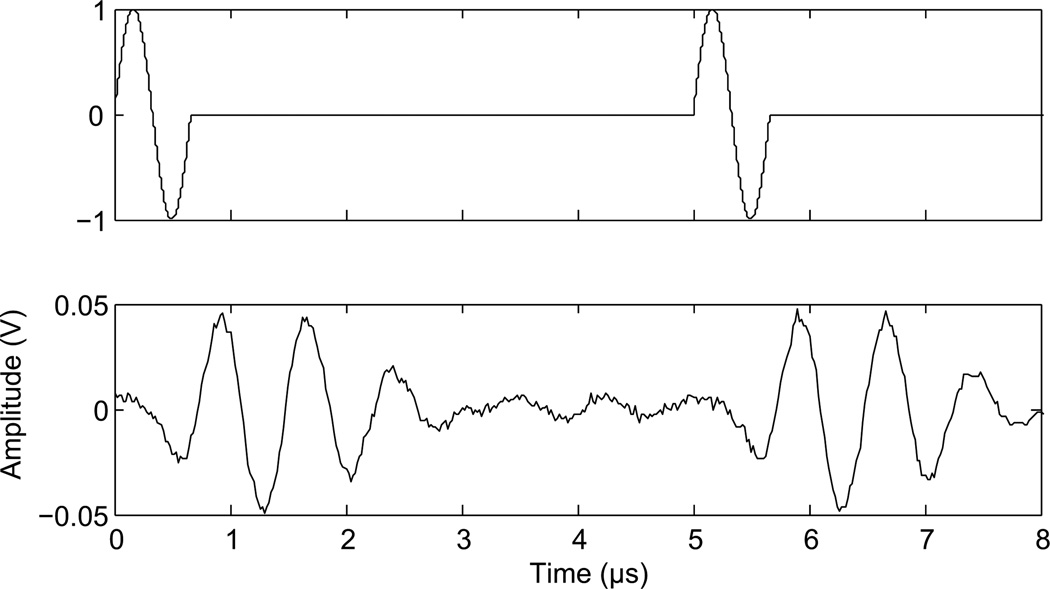
To examine the effects of duty cycle transducer 1 and 4 were used. Scans were captured during continuous wave sonications before insertion of the skull, after insertion of the skull, and during similar sonications with a 50% duty cycle. A hydrophone was used to determine the necessary delay between pulses to achieve the correct duty cycle. The narrowband therapy transducer (transducer 1) rang for over 40 µs following a single pulse at 268 kHz, and so a delay of 80 µs between pulses was used for this transducer at 268 kHz, while a delay of 40 µs was used at 841 kHz. Transducer 1 was driven at 268 kHz and then at 841 kHz. In the selected setting for the wideband composite transducer (transducer 4), a single pulse rang for approximately 2.5 µs, and was followed by a 2.5 µs delay. Therefore, single cycle pulses were applied every 5 µs during delivered bursts with this transducer (Fig. 2). Two function generators were used to produce the modified waveform. The first function generator provided a square wave pulse-train as an external trigger to the second generator. The second generator was set to output a single 1.503 MHz sinusoid cycle on each trigger. The delay between cycles and the number of cycles in a delivered burst was controlled by adjusting the square wave pulse-train.
Figure 2.
Modified waveform. Function generator output (top) and transducer output at 1.503 MHz (bottom).
To examine the effects of skull geometry on standing wave formation, holes were drilled at several locations in the skull, and measurements were acquired at these locations and at different angles of incidence of the ultrasound on the skull. Transducer 2 was used to sonicate the brain at a frequency of 548 kHz. This frequency was chosen as it was similar to that used in in vivo work conducted in this laboratory.
In Vivo Experiments: Animals
Fifty-eight rats (Wistar, 187 g – 603 g) were anesthetized with a mixture of xylazine (10 mg/kg) and ketamine (40–50 mg/kg), and their heads were depilated to remove the hair from the ultrasound path. Animals were placed supine on the positioning system described by Chopra et al. [2009] with their heads coupled to the water bath using a degassed water bag. The animals were sacrificed two hours after ultrasound treatment, and their brains and skullcaps were fixed in 10% buffered formalin.
Sonications
Transducers 3 and 4 were used in the in vivo work. Definity ultrasound contrast agent (0.02 ml/kg, Lantheus Medical Imaging, MA, USA) was injected via a tail vein catheter simultaneously with the start of all sonications and a minimum of 5 minutes was allowed between sonications to allow for the Definity to clear from the system. Applied power was constant during individual sonications, but varied from sonication to sonication. Estimated in situ peak negative pressures were calculated using a mean through-skull transmission of 49.5% at 1.503 MHz and assuming transmission through 5 mm of brain with attenuation of 5 Np m−1 MHz−1 in brain tissue [Hynynen et al., 2001]. The mean through-skull transmission was based on 40 measurements taken in different locations through 6 rat skullcaps using the fiber optic hydrophone. The through-skull transmission at 558 kHz was assumed to be 73% based on previous measurements taken in this lab at 4 locations in a single skullcap from a Wistar rat.
Two types of burst sonications were used in the studies. The first type used continuous wave (CW) excitation delivered in 10 ms bursts at a repetition rate of 1 Hz. The other type of burst sonication also used 10 ms bursts at a 1 Hz repetition frequency. With this pulse type, the 10 ms bursts consisted of the closely timed modified pulse described above and shown in figure 2. For clarity this pulse type will be referred to in the following as Short-Burst (SB) excitation.
The division of the animals and sonication parameters are outlined in Table 2.
Table 2.
Animal distribution and sonication parameters
| Study | Transducer | Frequency (MHz) |
No. animals |
Weight (g) | Sonication type* |
|---|---|---|---|---|---|
|
standing wave prevalence |
3 | 0.558 | 47 | 187–603 | CW |
| disruption threshold | 4 | 1.503 | 5 | 450–537 | CW, SB |
|
enhancement comparison |
4 | 1.503 | 6 | 250–276 | CW, SB |
| Study | Burst length (ms) |
PRF (Hz) | Sonication duration (min) |
No. sonication locations |
In situ pressure (Mpa) |
|---|---|---|---|---|---|
|
standing wave prevalence |
10 | 1 | 5 | 4 | 0.20 – 0.45 |
|
disruption threshold |
10 | 1 | 2 | 8 | 0.36 – 0.83 |
|
enhancement comparison |
10, 50 | 1 | 2 | 8 | 0.58, 0.71 |
CW (Continuous Wave), SB (Short Burst), the modified pulse described above and shown in fig.2
Experiment1
Forty-seven rats received single-point sonications at 558 kHz in four locations in the brain.
Experiment 2
Five rats were used to compare the BBB disruption threshold using CW excitation and SB excitation at 1.503 MHz. In one half of the brain, 4 locations were sonicated using CW excitation and were mirrored in the other half of the brain using SB sonications of equivalent pressures. One 50% duty cycle location and its continuous wave counterpart were excluded from analysis due to operator error leaving a total of thirty-eight locations (19 CW, 19 SB) for analysis. To ensure that opening was detected on the T1W images, contrast agent was delivered both after the continuous wave sonications and then after the SB sonication.
Experiment 3
The final six rats were used to compare enhancement levels between the two pulse types after BBB opening. Eight locations in each rat were sonicated at 1.503 MHz, (four CW, four SB), at two estimated in situ pressures, 0.58 MPa and 0.71 MPa. 50% of the SB locations used 10 ms bursts and 50% used 50 ms bursts, to produce the same time-averaged power as a 10 ms CW burst. Sonication order and location were semi-randomized. A single bolus of contrast agent was delivered after all sonications were completed. Four locations (two CW, two burst) were excluded from analysis due to operator error. A total of forty-four locations were analyzed.
MR Imaging
Opening of the BBB was confirmed via contrast-enhanced (0.2 ml/kg Omniscan, GE Healthcare) T1-weighted images (FSE, TE = 10 ms, TR = 500 ms, ETL = 4, FOV = 6 cm × 6 cm, slice thickness = 1 mm, 128 × 128) obtained in a 1.5 T MRI (Signa 1.5 T, GE Healthcare, Milwaukee, WI, USA). T2W images were captured from all animals and examined for indications of edema (FSE, TE =61.7 ms, TR =2000 ms). For the sonications at 558 kHz, axial and sagittal contrast-enhanced T1W images were inspected for standing waves. Banded opening of the BBB, seen as banded enhancement on the T1 images, with the half-wavelength spacing characteristic of standing waves [Dyson,1982] was considered to be a positive indicator of standing waves.
Analysis
Analysis was performed in Matlab, and enhancement at individual locations was measured over an averaged 3 by 3 pixel region of interest relative to the background enhancement. A two-tailed paired t-test was used to compare the enhancement means from the two burst types.
Insertion losses due to the skull were measured for the six skulls used to compare enhancement levels using the fiber optic hydrophone. Measurements were taken at the eight sonications locations in each skull, using the midline sutures and eye sockets as location references. Attenuation measurements were performed blind to the enhancement values. The acquired insertion losses were applied to produce corrected in situ pressure estimates for each individual sonication location.
Histology was performed on the final eleven brains, serially sectioning every 5 µm and performing hematoxylin and eosin staining every 300 µm.
Results
Ex Vivo Standing Wave Analysis
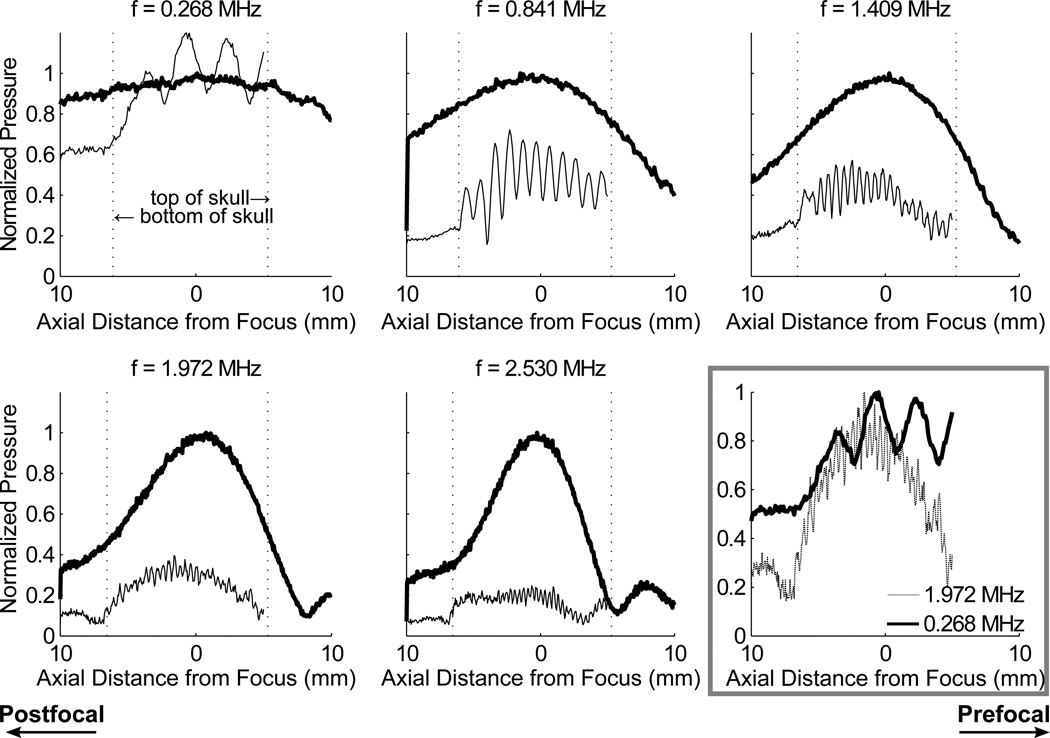
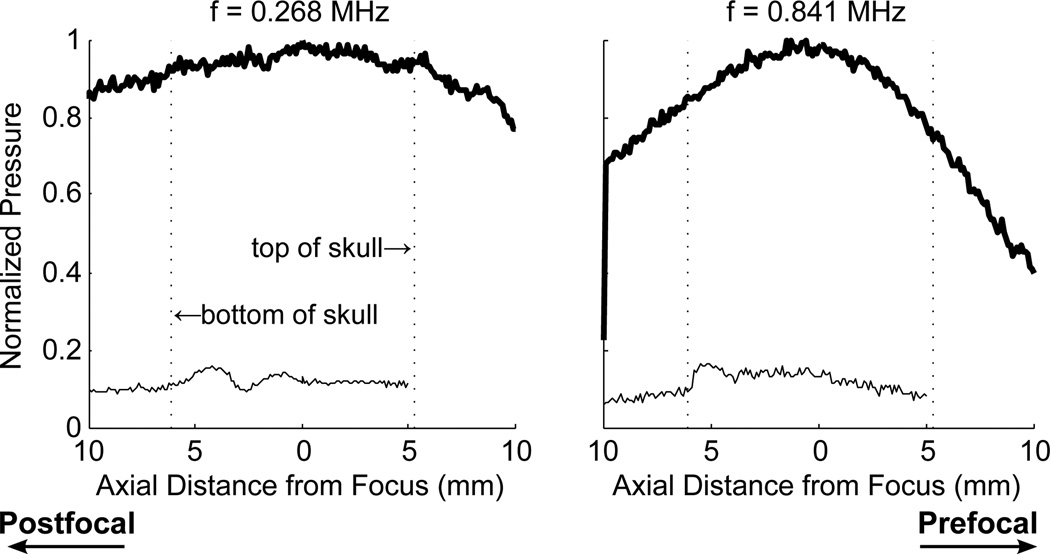
Scans with the optical hydrophone revealed standing wave effects in the skull cavity. Figure 3 illustrates the reduction of standing wave effects with increasing frequency. At the lowest frequency, 268 kHz, the standing wave contribution to the signal was sufficient to overcome the insertion losses associated with the skull, and the peak pressure in situ was higher than that measured before insertion of the skull. As the frequency was increased the wave spacing was reduced, producing a more even pressure profile through the focus. The ratios of the maximum and minimum of each standing wave, averaged over the profile in the skull cavity for each of the five frequencies, were 1.46 ± 0.19, 1.88 ± 0.46, 1.49 ± 0.18, 1.32 ± 0.15, 1.45 ± 0.25. Figure 3 also shows the normalized standing wave profiles at 0.268 and 1.972 MHz plotted against each other. While the mean standing wave amplitude decreased from 0.841 to 1.409 MHz, the plot of 0.268 and 1.972 MHz show comparable oscillation levels.
Figure 3.
Standing waves in the brain measured at insonation frequencies of 0.268, 0.841, 1.409, 1.972 and 2.530 MHz. The profile through the focus is measured before (thick line) and after insertion of the skull sample (thin line) and the data is normalized to the maximum pressure before skull insertion. Bottom right shows the standing waves profiles at 268 kHz and 1.972 MHz normalized to maximum amplitude
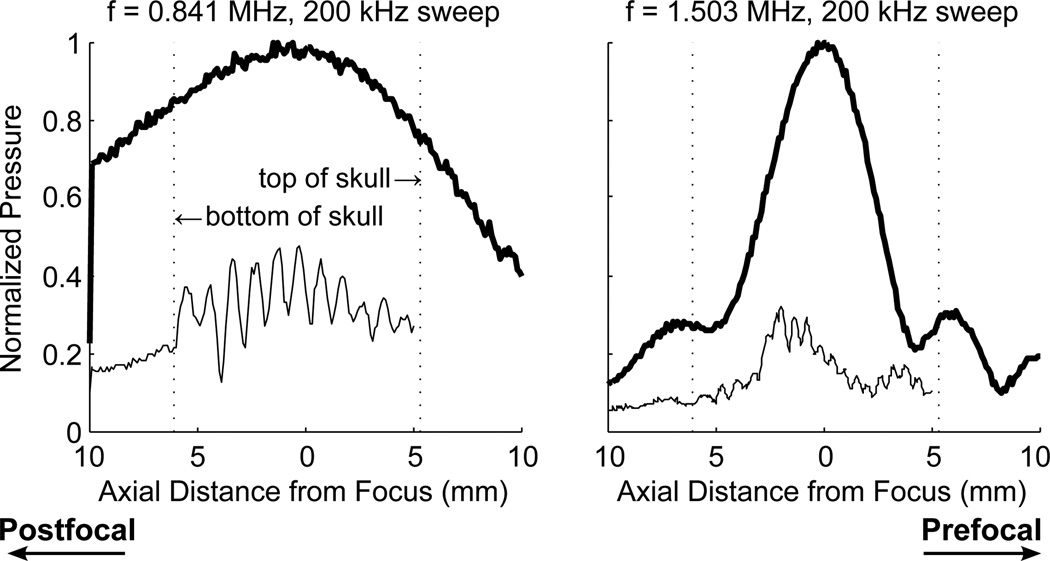
Figure 4 shows the profiles for swept frequencies centered about 841 kHz and 1.503 MHz. The use of swept frequencies had little impact on the standing waves at 841 kHz. The distance between the top and bottom of the skull was approximately 1 cm, and therefore there are an insufficient number of cycles in the skull for the swept frequencies to have an effect at 841 kHz. At 1.503 MHz, the standing waves still could not be completely removed using swept frequencies with the time rates of change used.
Figure 4.
Profile through the focus at swept frequencies with a centre frequency of 841 kHz and bandwidths of 100 kHz and 200 kHz. Thick lines indicate CW excitation, without skull
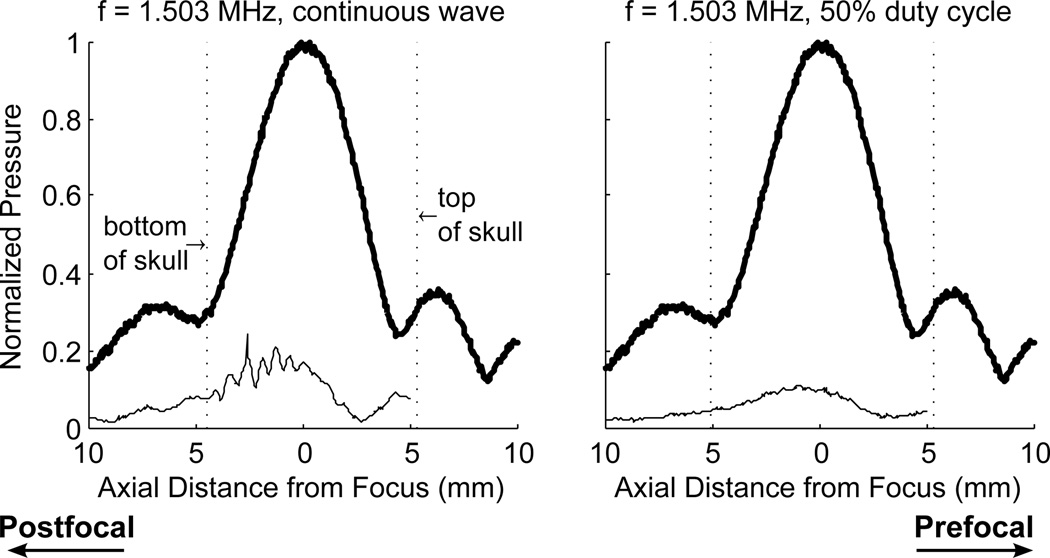
At 268 kHz and 841 kHz, using the therapy transducer, a 50% duty cycle reduced but did not eliminate the standing waves in the skull. Figure 5 illustrates the effects of the 50% duty cycle using the therapy transducer. After application of the reduced duty cycle, standing waves were still detected near the skull base, but did not appear all the way to the top of the skull as seen in the continuous wave case. The use of a 50% duty cycle with the wideband composite transducer eliminated the standing waves in the skull. Figure 6 shows the profile using continuous wave sonication, and using a 50% duty cycle. With the continuous wave sonication, standing waves can be seen near the back wall of the skull. After implementing the 50% duty cycle, the waves were eliminated. The modified pulse was tested at three locations in two different skulls and was successful in all cases in eliminating standing waves. It is important to note that standing waves conditions could still be forced when the transducer focus was pushed very close to the skull base.
Figure 5.
Profile through the focus at 268 kHz (left) reduced duty cycle, and at 841 kHz (right). Thick lines indicate CW excitation, without skull
Figure 6.
Profile through the focus 1.503 MHz using continuous wave (left) and single cycle pulses at 50% duty cycle (right). Thick lines indicate CW excitation, without skull
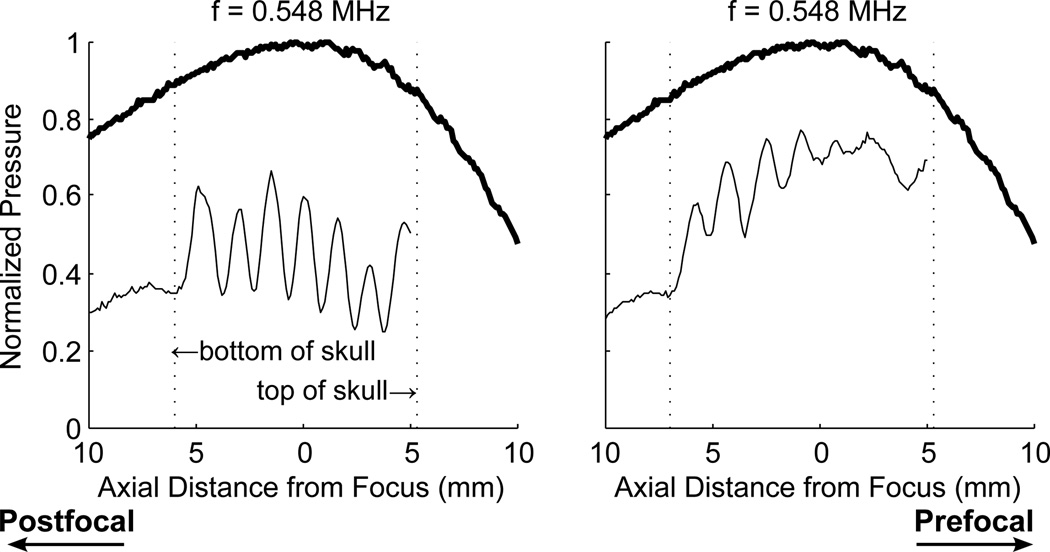
At 548 kHz, the effect of geometry on standing waves was found to be substantial. The overall amplitude of the wave as well as the location of the waves was impacted by the sonication location in the skull. Figure 7 shows two profiles through the transducer focus captured at different locations in the skull.
Figure 7.
Profile through the focus using a 548 kHz continuous wave at two different locations in the skull. Thick lines indicate CW excitation, without skull
In Vivo Experiments
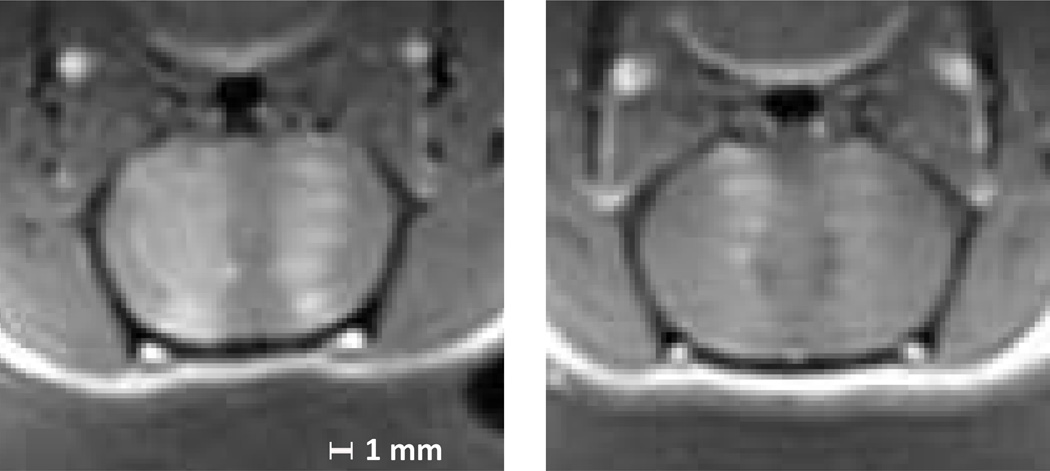
Distinct standing wave patterns were seen in thirteen of the forty-seven animals sonicated at 558 kHz (figure 8). Additionally, over half the animals showed patterns of opening in at least one location which could possibly be attributable to standing waves, although without certainty. In cases where the opening was very strong or very weak, it was difficult to detect standing waves from the T1W-images, and banded opening was seen mostly for sonications at mid-range power levels.
Figure 8.
Contrast enhanced T1 weighted images of axial sections of two rat brains after microbubble mediated blood brain barrier disruption at 558 kHz. Enhancement indicating BBB opening is visible at the half-wavelength spacing characteristic of standing waves. The animals are supine in these images, and the transducer is located below the head.
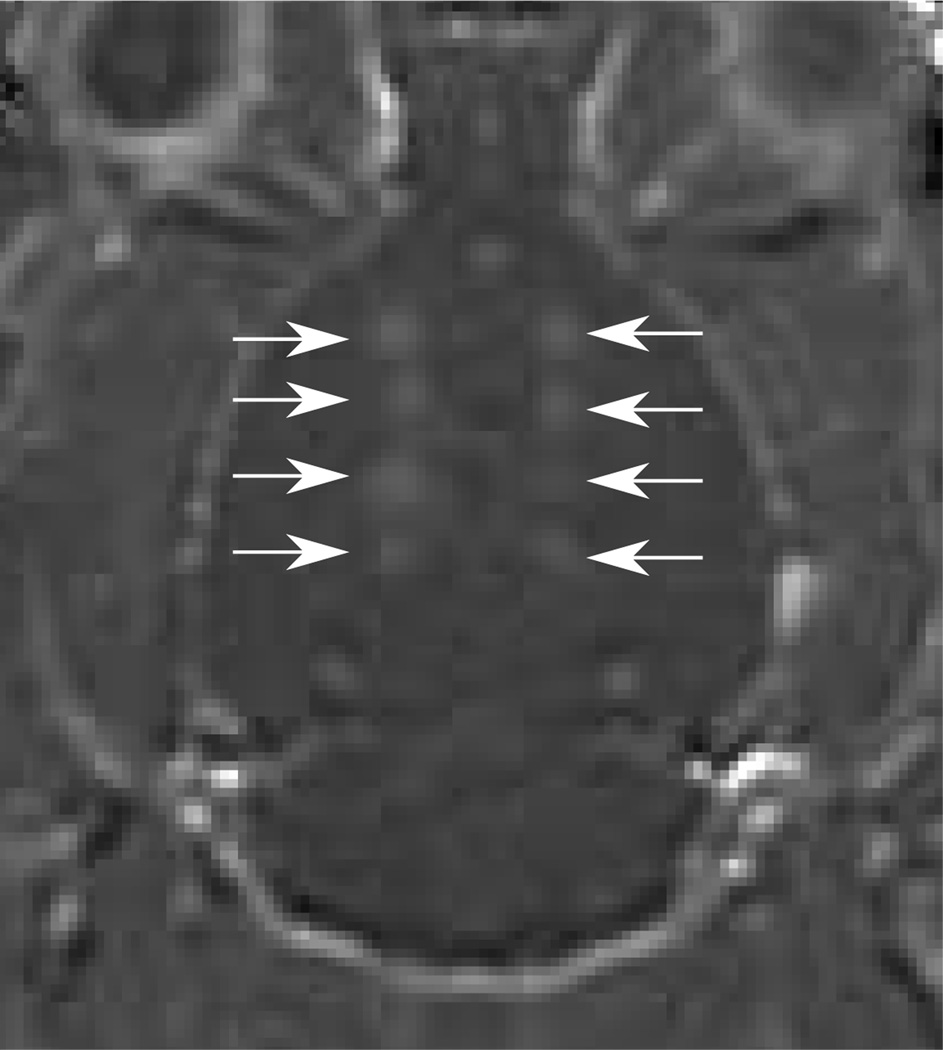
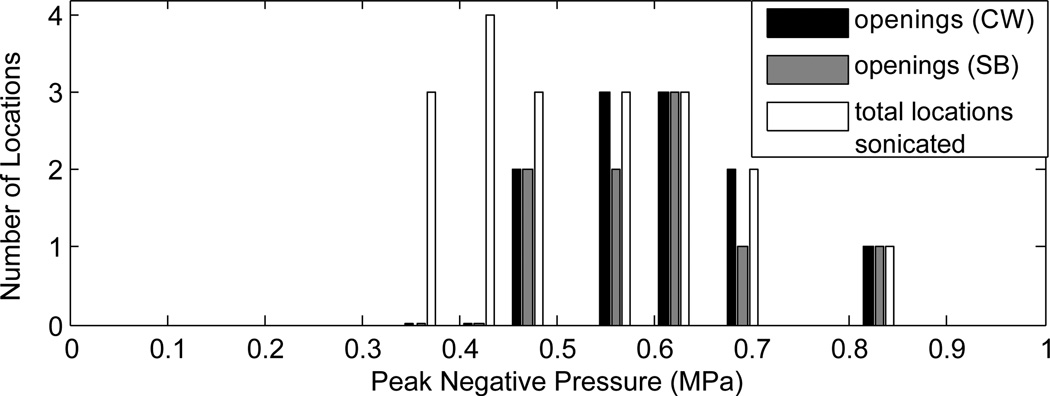
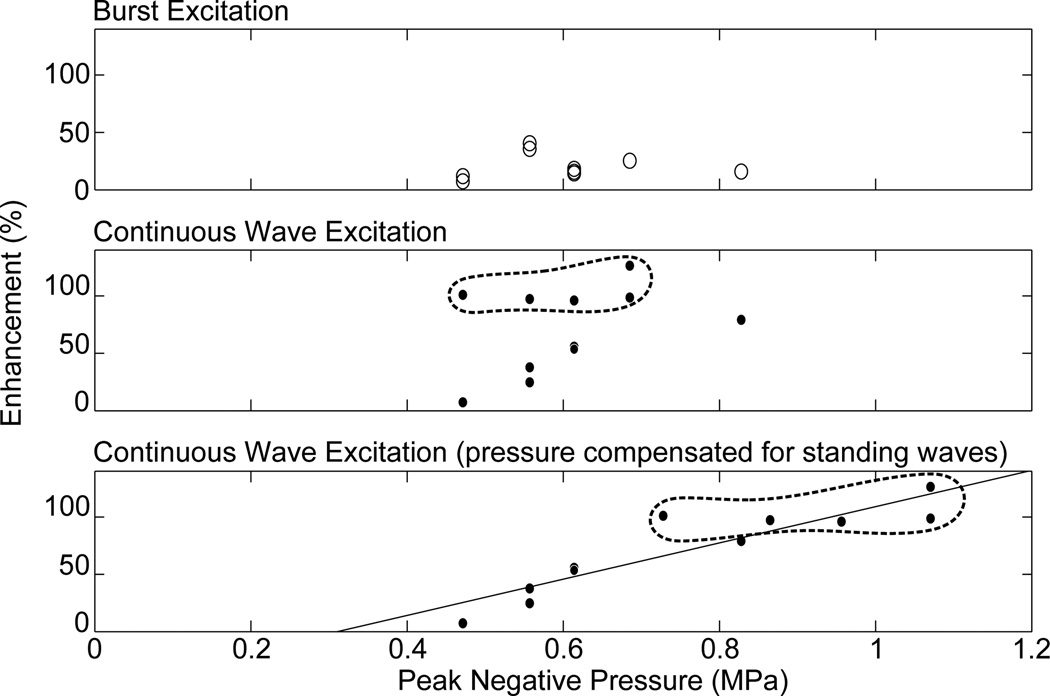
Implementation of SB excitation in vivo using the 1.503 MHz diagnostic transducer resulted in successful opening of the BBB (figure 9). In the five animals used to determine disruption threshold, BBB disruption was observed in eleven of nineteen CW locations, and nine of nineteen locations using the SB excitation. The results are summarized in figure 10. There were six possible instances of edema from the continuous wave sonications identified from the T2W images, and two possible instances observed using the SB excitation. Histological examination revealed extravasated red blood cells at the T2W-signal enhancement identified locations. Further, inertial cavitation, identified by broadband noise around the hydrophone’s 0.75 MHz centre frequency was detected during three CW sonications, but was not detected during any of the SB sonications. Two instances of inertial cavitation detected during CW sonications corresponded to edema detected at those locations. The remaining inertial cavitation event occurred during the time t=0 sonication at a point which did not exhibit edema. Since bolus injection occurred at t=0, microbubbles are assumed to not have been circulating at this time and so the event may have resulted from a trapped air bubble in the coupling bath. Three other CW edema locations did not exhibit cavitation, and acoustic emissions data was not available for the final CW location which exhibited edema due to an acquisition error. The instances of CW edema occurred at in situ pressures ranging from 0.47–0.82 MPa, and the inertial cavitation instances occurred at pressures ranging from 0.61–0.65 MPa. Acoustic emissions data was not available for the sonication at 0.82 MPa. For the SB sonications, the two instances of edema both occurred at 0.56 MPa in situ pressure. Instances of opening, edema and inertial cavitation are summarized in table 3. Figure 11 shows the enhancement versus pressure data for the two types of pulse. The CW enhancement levels were widely varied. A manual shift of high outliers was performed for the CW enhancement data to see if standing wave contributions can be summarized using a simple correction factor. Interestingly, a shift of the unusually high CW enhancement points by a factor of 1.6, the maximum contribution of standing waves measured in the ex vivo skulls using this transducer, produces the linear trend shown in the bottom plot of figure 11.
Figure 9.
Contrast-enhanced T1w image of a rat brain normalized to baseline images showing enhancement after sonication using 10 ms bursts consisting of continuous wave excitation (left side) and 10 ms and 50 ms bursts consisting of closely timed short bursts (right side). The arrows indicate sonication locations.
Figure 10.
Summary of opening of the BBB using continuous wave excitation and SB excitation. The number of locations where opening was detected for CW and SB bursts, and the total number of locations sonicated at each pressure are shown.
Table 3.
Summary of sonication results at 1.503 MHz
| CW Sonications | SB Sonications | ||||||
|---|---|---|---|---|---|---|---|
| Study | No. animals |
Opening | Edema | Inertial cavitation |
Opening | Edema | Inertial cavitation |
| threshold determination |
5 | 11(19) | 6(19) | 3(19) | 9(19) | 2(19) | 0(19) |
| enhancement comparison |
6 | 22(22) | 19(22) | 7(22) | 22 (22) | 9(22) | 0(22) |
CW (Continuous Wave), SB (Short Burst)
Figure 11.
Enhancement as a function of peak negative pressure for burst excitation (top) and continuous wave excitation (middle), and enhancement as a function of pressure with correction of the continuous wave high enhancement locations (>80% enhancement) for a maximum pressure increase due to standing waves of 60% (bottom). Points which have been corrected are circled.
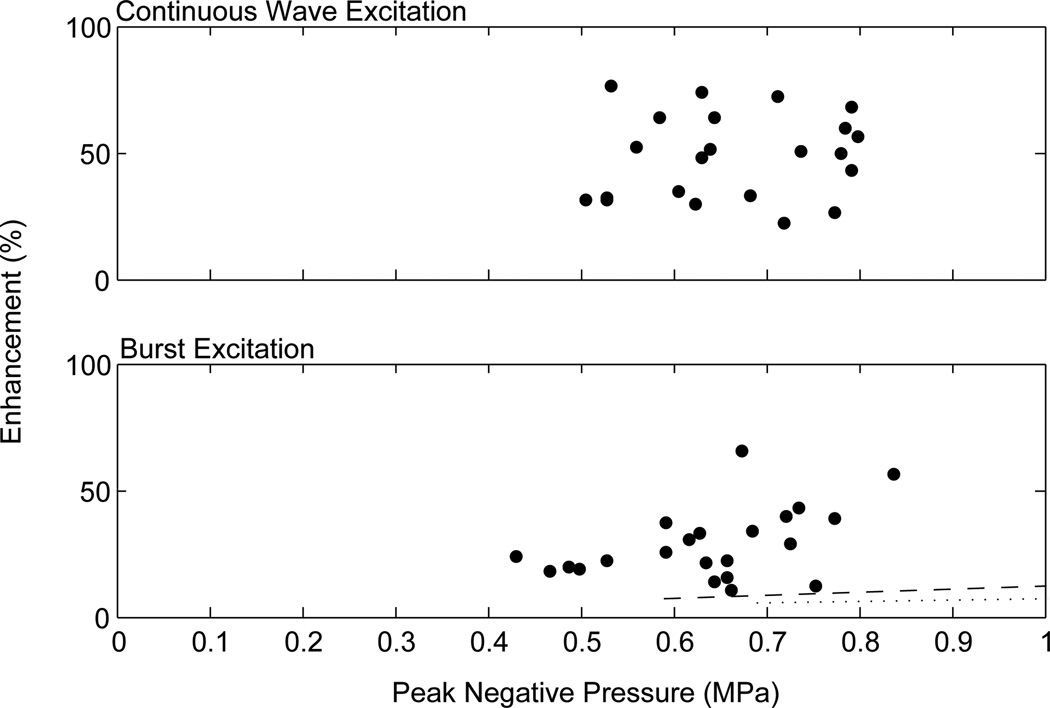
In the six rats used to compare CW and SB enhancement levels, no statistical difference was found between the 10 ms and 50 ms bursts of the SB type pulse (two-tailed t-test, p=0.98 for 0.58 MPa; p=0.48 for 0.71 MPa). This is consistent with studies that have shown no statistical difference between CW bursts of lengths 10 ms or more [Hynynen et al., 2001]. The means of the two burst types at both 0.58 MPa and 0.71 MPa were found to be statistically different (p=0.00001, p=0.0005). After correction for the attenuation through the skull at the individual locations, the enhancement versus estimated pressure actually delivered is shown in figure 12. The CW data set shows no correlation. The data set using SB excitation shows a linear trend. The one high enhancement outlier in the modified pulse data set was from a sonication which appears to have hit a ventricle, possibly explaining the high enhancement levels. Nineteen instances of edema were identified from the T2W images using continuous wave excitation, versus nine possible locations using the modified pulse. Additionally, acoustic data from seven CW locations showed clear indication of inertial cavitation, whereas no indication of inertial cavitation was detected from the short burst sonications. All instances of inertial cavitation in the enhancement study corresponded with edema.
Figure 12.
Enhancement as a function of peak negative pressure for continuous wave excitation (top) and burst excitation (bottom). The dashed line represents the reported values for the mean enhancement and approximate threshold during BBB opening in rabbit brain through a craniotomy window at 1.63 MHz with a sonication duration of 20 s [Hynynen et al, 2001]. The dotted line represents the reported values for the mean enhancement and approximate threshold during BBB opening in rabbit brain through a craniotomy window at 2.04 MHz with a sonication duration of 20 s [McDannold et al, 2008].
Discussion
Standing waves effects were visible in over 25% of the animals sonicated at 558 kHz, a frequency relevant to preclinical transcranial ultrasound. This percentage only includes scans where there was a distinct banded enhancement effect visible. However, standing waves likely contributed to a higher percentage of the cases. In cases of strong opening, the enhanced region would be larger and the bands would overlap, making detection of standing waves more difficult. The hydrophone measurements also demonstrated a strong sensitivity to the geometry of the skull at 548 kHz. This may explain why signs of standing waves were not visible in all of the animals, and why in some animals standing wave patterns were visible in some locations but not others. However, the use of experimental geometry as a method of reducing standing wave effects could be difficult to implement in a manner that would produce consistent results. Angling the transducer to create a non-normal angle of incidence will decrease transmission through the skull, or otherwise alter the delivered sound field but may aid in reducing standing waves.
In the human skull attenuation would play a role in reducing standing waves at higher frequencies, however due to the short distances associated with rodent skulls, the contribution of attenuation to decreasing standing wave effects in small animal models is likely minimal. A definite decreasing trend with increasing frequency could not be established. With increasing frequency the focus shifted away from the transducer requiring repositioning to keep the focus in the middle of the skull cavity. This shift in the transducer position would affect the path of the ultrasound through the skull bone. The change in the skull bone/ultrasound geometry would influence the standing wave amplitude and could mask an amplitude trend with increasing frequency, if such a trend exists. Reduction by tighter focusing is supported by the decrease in standing waves between the f-number 1 transducer driven at 1.409 MHz (fig. 5), and the f-number 0.8 transducer driven at 1.503 MHz (fig. 8). With the tighter focus, standing waves were visible close to the skull base but were not strong near the top of the skull. Therefore, the use of planar transducers or loosely focused transducers would be highly inadvisable for transcranial applications as there would be a high likelihood of standing wave effects and therefore unwanted and uncontrollable variability between sonications.
Swept frequencies were unsuccessful in eliminating standing waves in this study, as was using a reduced duty cycle using the narrowband therapy transducer, as the ringing by the transducer was sufficient to cause standing waves. Even with a wideband, low frequency transducer, long wavelengths could result in standing waves, and the longer wait times between pulses within a burst necessary to achieve a 50% duty cycle could result in unusual bubble behavior. However, lower duty cycles were not investigated and it may be possible to achieve the same benefit with short low duty cycle bursts.
Successful opening of the BBB using a reduced duty cycle, which has been shown to remove standing waves, has demonstrated that this effect can still be produced using only a travelling wave field. This is an important discovery when considering clinical application of microbubble mediated BBB disruption. In the human skull, standing wave fields could be highly variable and difficult to control. A procedure which was dependent on the presence of standing waves in the skull could prevent it from ever being adopted into clinical practice.
The results from the BBBD threshold study comparing CW excitation and SB excitation suggest that the thresholds for disruption are similar. The greater number of disrupted sites using the CW excitation was expected as standing wave contributions are likely still present in some instances, which would increase the in situ pressures over the SB case. Although it is interesting that a simple shift of high outliers produced a linear trend in the continuous wave threshold study data, quantifying standing wave influence in in vivo experiments is far more complicated than applying a corrective multiplier and such a trend may be coincidental. The unpredictability of standing waves can be clearly seen in the completely uncorrelated data acquired in the continuous wave case of the enhancement study. The linear enhancement produced by the traveling wave field show it to be a more reliable means of conducting BBB experiments. The increased mean enhancement level seen in the continuous wave case is more likely due to the increased pressure experienced in these locations due to standing waves, and likely comparison of CW and burst exciation given purely traveling wave conditions for both pulse types, would reveal similar enhancement versus pressure relations between the two pulse types. Figure 12 also shows two trends from literature of enhancement versus pressure in rabbit brain [Hynynen et al, 2001; McDannold et al., 2008]. Both studies performed sonications through craniotomies, minimizing the possibility of standing waves. Both studies also used 20 s sonication durations, so the enhancement levels are expected to be lower than in this study.
One possible benefit of use of SB excitation is the potential for reduced risk of causing damage. In both studies 25 possible instances of edema and 7 instances of inertial cavitation were identified for CW compared with only 11 instance of edema, and no inertial cavitation for the 50% duty cycle. The increased number of locations with edema in the CW case is likely a result of the higher levels of pressure caused by the standing waves. Using the SB excitation, the pressures delivered can be better controlled, thereby minimizing damage. Investigation of the inertial cavitation threshold using SB excitation would also be interesting as cavitation bioeffects have been seen to occur more readily in a standing wave field [Kerr et al., 1989].
While 1.503 MHz is not necessarily applicable to clinical work, a study has shown that BBB disruption can be characterized by mechanical index [McDannold et al., 2008], which would allow treatment pressures to be related to their lower frequency equivalents. Additionally, use of SB excitation in clinical practice would almost guarantee the elimination of standing waves in the larger human skull, and may reduce the risk of tissue damage. Use of the same pulse parameters in pre-clinical animal work and clinical trials would negate the need to find a relation between thresholds using a reduced duty cycle and those using continuous wave bursts without standing wave effects, the latter of which could be difficult to measure.
The modified pulse presented provides an improvement over continuous wave sonication by producing more repeatable results. However, it may turn out that an even higher level of control is required if BBB disruption is to be successfully transitioned into clinical practice. A pressure/enhancement relationship is not sufficient to provide the required level of consistency and safety in BBB procedures, and real-time monitoring and control of BBBD may be needed [McDannold et al., 2006].
Conclusion
Standing waves have been identified in in vivo experiments and reproduced in bench-top experiments in ex vivo rat skulls. Standing waves were determined to be geometrically dependent and were successfully eliminated using a wideband therapy transducer and a 50% duty cycle. Application of the modified pulse parameters in vivo resulted in opening of the BBB, demonstrating that BBB disruption is not dependent on standing wave conditions. Further, the pressure thresholds for opening of the BBB using continuous wave excitation and a modified pulse parameter were found to be comparable and enhancement using the modified pulse was found to be more predictable. In order to produce clinically translatable work, future preclinical work in this field should be conducted at higher frequencies using tightly focused transducers with wide apertures.
Acknowledgements
Support for this work was provided by NIH under grants No. EB003268 and No. EB009032. The authors would like to thank Ping Wu, Shawna Rideout-Gross and Alexandra Garces for their help with the in vivo work, and Milan Ganguly who performed the histology.
References
- Azuma T, Kawabata K-I, Umemura S-I. Schlieren Observation of Therapeutic Field in Water Surrounded by Cranium Radiated from 500 kHz Ultrasonic Sector Transducer. Proc. IEEE Ultrasonics Symp. 2004:1001–1004. [Google Scholar]
- Alexandrov AV, Molina CA, Grotta JC, Garami Z, Ford SR, Alvarez-Sabin J, Montaner J, Saqqur M, Demchuck AM, Moyé LA, Hill MD, Wojner AW. Ultrasound-Enhanced Systemic Thrombolysis for Acute Ischemic Stroke. N Engl J Med. 2004;351(21):2170–2178. doi: 10.1056/NEJMoa041175. [DOI] [PubMed] [Google Scholar]
- Baron C, Aubry J-F, Tanter M, Meairs S, Fink M. Simulation of Intracranial Acoustic Fields in Clinical Trials of Sonothrombolysis. Ultrasound Med Biol. 2009;35(7):1148–1158. doi: 10.1016/j.ultrasmedbio.2008.11.014. [DOI] [PubMed] [Google Scholar]
- Choi JJ, Pernot M, Small SA, Konofagou EE. Noninvasive, Transcranial and Localized Opening of the Blood-Brain Barrier using Focused Ultrasound in Mice. Ultrasound in Med. & Biol. 2007;33(1):95–104. doi: 10.1016/j.ultrasmedbio.2006.07.018. [DOI] [PubMed] [Google Scholar]
- Chopra R, Curiel L, Staruch R, Morrison L, Hynynen K. An MRI-compatible system for focused ultrasound experiments in small animal models. Med. Phys. 2009;36(5):1867–1874. doi: 10.1118/1.3115680. [DOI] [PMC free article] [PubMed] [Google Scholar]
- Clement GT, Sun J, Giesecke T, Hynynen K. A hemisphere array for non-invasive ultrasound brain therapy and surgery. Phys. Med. Biol. 2000;45:3707–3719. doi: 10.1088/0031-9155/45/12/314. [DOI] [PubMed] [Google Scholar]
- Connor CW, Hynynen K. Patterns of Thermal Deposition in the Skull During Transcranial Focused Ultrasound Surgery. IEEE Trans. Biomedical Eng. 2004;51(10):1693–1706. doi: 10.1109/TBME.2004.831516. [DOI] [PubMed] [Google Scholar]
- Dyson M. Non-Thermal Cellular Effects of Ultrasound. Br J Cancer. 1982;45 Suppl. V:165–171. [PMC free article] [PubMed] [Google Scholar]
- Eller A. Force on a bubble in a standing acoustic wave. J Acoust Soc Am. 1968;43(1):170–171. [Google Scholar]
- Erpelding TN, Hollman KW, O’Donnell M. Bubble-Based Acoustic Radiation Force Using Chirp Insonation to Reduce Standing Wave Effects. Ultrasound Med Biol. 2007;33(2):263–269. doi: 10.1016/j.ultrasmedbio.2006.07.039. [DOI] [PMC free article] [PubMed] [Google Scholar]
- Hynynen K, Jolesz FA. Demonstration of Potential Noninvasive Ultrasound Brain Therapy Through an Intact Skull. Ultrasound in Med. & Biol. 1998;24(2):275–283. doi: 10.1016/s0301-5629(97)00269-x. [DOI] [PubMed] [Google Scholar]
- Hynynen K, McDannold N, Vykhodtseva N, Jolesz FA. Noninvasive MR Imaging-guided Focal Opening of the Blood Brain Barrier in Rabbits. Radiology. 2001;20(3):640–646. doi: 10.1148/radiol.2202001804. [DOI] [PubMed] [Google Scholar]
- Kerr CL, Gregory DW, Shammari M, Watmough DJ, Wheatly DN. Differing Effects of Ultrasound-Irradiation on Suspension and Monolayer Cultured HeLa Cells, Investigated by Scanning Electron Microscopy. Ultrasound Med Biol. 1989;15(4):397–401. doi: 10.1016/0301-5629(89)90052-5. [DOI] [PubMed] [Google Scholar]
- Kinoshita M, McDannold N, Jolesz FA, Hynynen K. Targeted delivery of antibodies through the blood-brain barrier by MRI-guided focused ultrasound. Biochemical and Biophysical Research Communications. 2006;340:1085–1090. doi: 10.1016/j.bbrc.2005.12.112. [DOI] [PubMed] [Google Scholar]
- Kinoshita M, Hynynen K. Key factors that affect sonoporation efficiency in in vitro settings: The importance of standing wave in sonoporation. Biochemical and Biophysical Research Communications. 2007;359:860–865. doi: 10.1016/j.bbrc.2007.05.153. [DOI] [PMC free article] [PubMed] [Google Scholar]
- Liu H-L, Pan C-H, Ting C-Y, Hsiao M-J. Opening of the Blood-Brain Barrier By Low-Frequency (28-kHz) Ultrasound: A Novel Pinhole-Assisted Mechanical Scanning Device. Ultrasound Med. Biol. 2010;36(2):325–335. doi: 10.1016/j.ultrasmedbio.2009.10.004. [DOI] [PubMed] [Google Scholar]
- Martin E, Jeanmonod D, Morel A, Zadicario E, Werner B. High-intensity focused ultrasound for noninvasive functional neurosurgery. Ann. Neurol. 2009;66(6):858–861. doi: 10.1002/ana.21801. [DOI] [PubMed] [Google Scholar]
- McDannold N, Vykhodtseva N, Hynynen K. Targeted disruption of the blood-brain barrier with focused ultrasound: association with cavitation activity. Phys.Med. Biol. 2006;51:793–807. doi: 10.1088/0031-9155/51/4/003. [DOI] [PubMed] [Google Scholar]
- McDannold N, Vykhodtseva N, Hynynen K. Blood-Brain Barrier Disruption Induced by Focused Ultrasound and Circulating Preformed Microbubbles Appears to be Characterized by the Mechanical Index. Ultrasound in Med & Biol. 2008;34(5):234–840. doi: 10.1016/j.ultrasmedbio.2007.10.016. [DOI] [PMC free article] [PubMed] [Google Scholar]
- McDannold N, Clement GT, Black P, Jolesz F, Hynynen K. Transcranial magnetic resonance imaging-guided focused ultrasound surgery of brain tumors: initial findings in 3 patients. Neurosurgery. 2010;66(2):323–332. doi: 10.1227/01.NEU.0000360379.95800.2F. [DOI] [PMC free article] [PubMed] [Google Scholar]
- Mitri FG, Greenleaf JF, Fatemi M. Chirp Imaging Vibro-Acoustography for Removing the Ultrasound Standing Wave Artifact. IEEE Trans Med Imaging. 2005;24(10):1249–1255. doi: 10.1109/TMI.2005.854518. [DOI] [PubMed] [Google Scholar]
- Pernot M, Aubry J-F, Tanter M, Boch A-L, Marquet F, Kujas M, Seilhean D, Fink M. In vivo transcranial brain surgery with an ultrasonic time reversal mirror. J Neurosurg. 2007;106(6):1061–1066. doi: 10.3171/jns.2007.106.6.1061. [DOI] [PubMed] [Google Scholar]
- Song J, Hynynen K. Feasibility of Using Lateral Mode Coupling Method for a Large Scale Ultrasound Phased Array for Noninvasive Transcranial Therapy. IEEE Transactions on Biomedical Engineering. 2010;57(1):124–133. doi: 10.1109/TBME.2009.2028739. [DOI] [PMC free article] [PubMed] [Google Scholar]
- Sun J, Hynynen K. The potential of transskull ultrasound therapy and surgery using the maximum available skull surface area. J Acoust Soc Am. 1999;105(4):2519–2527. doi: 10.1121/1.426863. [DOI] [PubMed] [Google Scholar]
- Tang SC, Clement GT. Acoustic standing wave suppression using randomized phase-shift-keying excitations (L) J. Acoust. Soc. Am. 2009;126(4):1667–1670. doi: 10.1121/1.3203935. [DOI] [PMC free article] [PubMed] [Google Scholar]
- Tanter M, Pernot M, Aubry J-F, Montaldo G, Marquet F, Fink M. Compensating for bone interfaces and respiratory motion in High Intensity Focused Ultrasound. Int. J. of Hyperthermia. 2007;23(2):141–151. doi: 10.1080/02656730701209996. [DOI] [PubMed] [Google Scholar]
- Treat LH, McDannold N, Vykhodtseva N, Zhang Y, Tam K, Hynynen K. Targeted delivery of doxorubicin to the rat brain at therapeutic levels using MRI-guided focused ultrasound. Int. J. Cancer. 2007;121:901–907. doi: 10.1002/ijc.22732. [DOI] [PubMed] [Google Scholar]


