Abstract
A piezoelectric detector with a cylindrical shape is investigated for photoacoustic section imaging. Images are acquired by rotating a sample in front of the cylindrical detector. With its length exceeding the size of the imaging object, it works as an integrating sensor and therefore allows reconstructing section images with the inverse Radon transform. Prior to the reconstruction the Abel transform is applied to the measured signals to improve the accuracy of the image. A resolution of about 100 µm within a section and of 500 µm between sections is obtained. Additionally, a series of images of a zebra fish is shown.
OCIS codes: (110.5120) Photoacoustic imaging, (110.7170) Ultrasound, (100.3010) Image reconstruction techniques
1. Introduction
Photoacoustic tomography (PAT) is based on the generation of sound in the targeted medium by absorption of pulsed electromagnetic radiation. If the sample is illuminated by a short laser pulse, a spatial distribution of acoustic pressure inside the sample is generated by thermoelastic expansion, which induces the emission of an acoustic wave. Photoacoustics combines the advantages of two important non-invasive imaging technologies, diffuse optical imaging and ultrasound imaging. The former determines the imaging contrast and the latter the resolution [1].
Photoacoustic methods have found their way to a variety of medical diagnostic applications, such as imaging of small animals, which are basic models for medical research [2–5]. Examining the skin vasculature was shown [6–8] as well as mammography [9–11] and monitoring of therapy [12].
Since the acoustic signal amplitude depends on the absorption coefficient of the examined object photoacoustics can also give information about its molecular composition.
To reconstruct an image and to recover the initial distribution of absorbed energy, one must solve the inverse problem of thermoelastic sound generation. The available information for this inversion is the acoustic signals measured outside the object. Commonly small piezoelectric transducers, approximating point-detectors are used. A point-detector measures the mean value of the absorbed energy density over spherical surfaces with the point-detector in the center. The radius of each sphere is equal to the time the acoustic wave travels from the source to the detector multiplied with the speed of sound. The achievable spatial resolution is determined by the size and the bandwidth of the point-like detectors. Especially in the case of piezoelectric transducers the combination of small size with high sensitivity is difficult to realize.
The approach of large planar detectors with a size larger than the imaging object was introduced by Haltmeier et al. [13]. Such a detector receives a signal that is not a projection over a spherical surface but an exact projection over a plane, allowing the initial pressure distribution to be reconstructed by use of the standard inverse Radon transform. Later this concept was extended to linear and cylindrical detectors [14].
In this study a large, cylindrically shaped detector is investigated and special attention is given to signal processing and resolution. One advantage of this detection system is the fast scanning of single sections, as opposed to a complete three-dimensional tomography image. Compared to earlier approaches where circularly scanning cylindrical lens detectors were used for section imaging [3,15], in the present work the integrating effect over the large detector surface is taken into account by using the inverse Radon transform in the reconstruction. Furthermore, special signal processing techniques such as the Abel transform are investigated, which are especially suited for the integrating detector problem. Simulations and measurements of phantoms and a biological sample demonstrate the applicability of the technique.
2. Cylindrical detector
Figure 1(a) shows a schematic drawing of a cylindrically shaped detector. This detector has a focal volume, which is given as the product of focal depth in x-direction, the length of the cylinder in y-direction and the width of the focus in z-direction. Since the focus is located at the axis of the cylinder, the focal volume approximates a plane detection area at a distance of about the length of the radius [16]. The resolution deteriorates for objects outside this focusing plane.
Fig. 1.
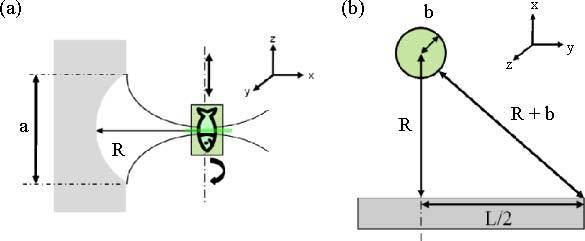
(a) Schematic drawing of a cylindrical detector and the focusing area from a side view; (b) drawing illustrating the relation between radius R of the detector, radius b of the object and length L of the detector.
A numerical aperture NA = 0.5 was chosen, which is a good compromise regarding the tradeoff between resolution and depth of field. It is defined as
| (1) |
where a is the width in z-direction and R is the radius of the cylindrical detector. The length of an integrating detector should be , which assumes that the object is contained in a sphere with radius b touching the detector [17]. This relation is derived from the requirement that acoustic waves arriving from the object at normal incidence on the detector should be separated in time from any waves that reach the end of the detector. The samples investigated in this work are much smaller in diameter than the radius of the cylinder, because an additional condition is to confine the sample near the cylinder axis for focusing. Therefore we could choose L to be shorter, according to the relation
| (2) |
where b is the radius of a sphere in which the object is enclosed. This relation is based on the same assumption to cause a sufficient delay of waves reaching the end of the detector, as illustrated in Fig. 1(b).
Due to the focusing property of the cylindrical sensor area, a signal measured at a given time t with this detector can be regarded as coming from the initial pressure distribution, p0, integrated over a line in y-direction at distance cst from the detector surface, where cs is the speed of sound. This is the main difference to a point like detector combined with a cylindrical lens, where the signal at a given time is related to the initial pressure distribution integrated over a circle with radius cst and the detector in the center. To acquire one section image with the integrating detector requires rotation of the object about an axis oriented in z-direction. After conversion of the time axis into distance, the collected signals represent linear projections of the initial pressure distribution. Image reconstruction is therefore straightforward and only requires the standard inverse Radon transform.
Integrating cylindrical detectors are related to integrating line detectors, because a cylindrical surface can be regarded as lines obeying the condition in Eq. (2) arranged on a circular arc. The Abel transform has been used in PAT with line detectors to calculate the circular integrals of a photoacoustic source from the acoustic signal in the two-dimensional (2D) case [17]. Consider a wave propagating in 2D space (u, v) (the plane perpendicular to the line detectors) emanating from an initial pressure distribution and a detector located at (u0, v0). The temporal signal received by the detector is denoted p2D(u0, v0, t) and is related to the integral of the initial pressure distribution M[](u0, v0, r) over a circle with radius r and center (u0, v0) via the relation [17]
| (3) |
The benefit of this transform is twofold: First of all, it transforms the bipolar pressure signal that is generated by a finite photoacoustic source into a purely positive signal. Secondly, if we assume a circular source, the maximum of the circular integral will coincide with the distance of the detector to the center of the source. By contrast, the maximum of the bipolar acoustic signal does not coincide with this distance. Transferred to signal acquisition with the cylindrical detector, the relation above links the signal seen by each of the lines forming the cylindrical surface with the corresponding circular integral. The result of the Abel transform appears therefore better suited for image reconstruction via the inverse Radon transform than the directly measured pressure signals. We will in the following simulation compare the reconstruction using the pressure signals with the reconstruction using the Abel transformed signals.
3. Simulations
Simulations were used to test signal processing and reconstruction methods, mainly the difference of reconstruction from pressure signals and from Abel transformed signals. The simulations are based on the integration of analytical signals from uniformly heated, spherical sources over the area of the cylindrical sensor. Integration over the detector area was performed in cylindrical coordinates, making use of the analytical signals received from a spherical source with a line detector in y-direction [18]. The phantom consisted of five spheres with a diameter of 2 mm in the x-y-plane. To simulate data acquisition for an image, the phantom was rotated about an axis oriented in z-direction and scanned in z-direction. The simulated detector had the same dimensions as the real detector used for the experiments.
Figure 2 shows a simulation result. In Fig. 2(a) the simulated pressure signals of the spheres were inverse Radon transformed. It shows a slight distortion of the spheres lying outside the rotation axis, which was chosen in the center of the image. Figure 2(b) shows a reconstruction from the simulated data which were Abel transformed and then inverse Radon transformed. The source in the middle of the image lies near the rotation axis, therefore it is nearly exactly reconstructed. The sources further away from the rotation axis occur blurred but can be located at the simulated position.
Fig. 2.
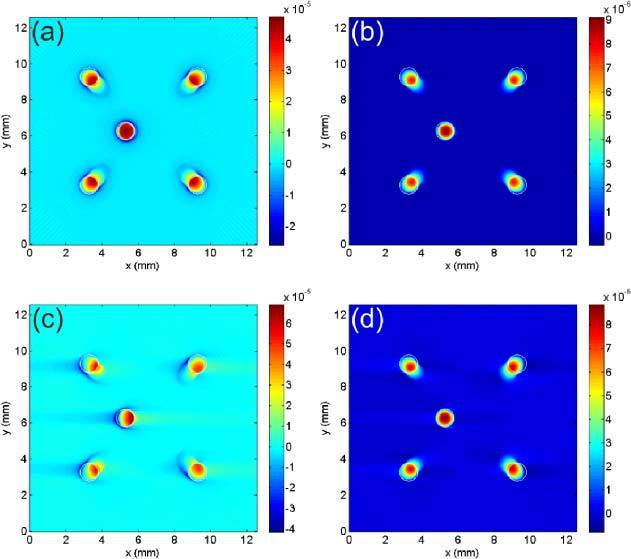
Simulated image of a phantom consisting of five homogenously heated spheres. (a) Reconstruction from pressure signals acquired over 360°, (b) reconstruction from Abel transformed pressure signals acquired over 360°, (c) pressure signals over 180°, (d) Abel transformed signals over 180°.
It is shown that the Abel transform is quite applicable for the given detection system. The sources appear at the given positions and the dimensions are accurate. The effect of the Abel transform to return mainly positive images in contrast to the untransformed images is distinguishable in Fig. 2.
Comparing the two images in Figs. 2(a) and (b), however, the advantages of the Abel transform are not striking. A more application related example is shown in parts (c) and (d), where only data from a scan over 180 degrees are used for the reconstruction. Considering the inverse Radon transform to give an exact reconstruction, then these data should be sufficient for obtaining an image. Acquiring only half the data saves time, which is important in many applications. When the raw, bipolar signals are used for the reconstruction, the sphere close to the rotation axis is strongly distorted and even more the other spheres. Such distortions are not visible when the Abel transformed signals are used, as seen in part (d) of Fig. 2.
4. Detector and measurement setup
The detector was built with a mold made of aluminum with a rectangular cross section. It had a length L of 45 mm and a width a of 20 mm. The mold fitted onto a Teflon cylinder with a radius R of 20 mm. A piezoelectric film (PVDF) with a thickness of 110 µm, with electrodes deposited on either side was attached to the cylinder. Contact on the backside was made by gluing an electric cable onto the foil with conductive adhesive. Resin was poured into the mold and after drying out, the Teflon cylinder was removed. Contacting the upper side of the detector was done by drawing a line of silver-conductive varnish from the foil to the aluminum case. To protect the surface of the piezoelectric foil a thin plastic sheet was attached to the detector [19]
Illumination was done by pulses from an optical parametric oscillator (OPO), which was pumped by a frequency-tripled, Q-switched Nd:YAG laser with a repetition rate of 10 Hz. The OPO output beam was tuned to a wavelength of 502 nm. It was split by a beam splitter and the pulses were coupled into two optical fibers of 600 µm core diameter. The output beams of the fibers were shaped with cylindrical lenses, forming a line shaped illumination on the surface of the sample (see Fig. 3 ).
Fig. 3.
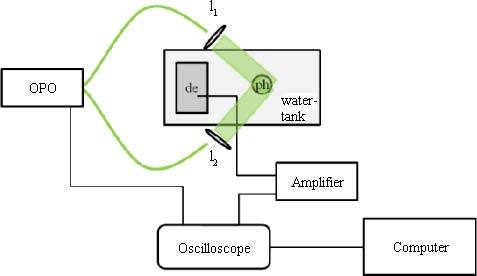
Experimental setup seen from above: l1 and l2 are cylindrical lenses focusing onto one plane of the phantom (ph), as indicated by the green line in Fig. 1(a).
Recording the data of each x-y-plane was performed by rotating the phantom over 360° in 400 steps, which gives an increment of 0.9°. For the maximum sample diameter of 10 mm used in this study this gives an achievable resolution of 78 µm in the x-y-plane. Since the repetition rate of the laser pulses was 10 Hz, one scan took 40 s.
The detector and the sample were placed in a water tank for acoustical coupling. Scanning in z-direction and the rotation of the sample were performed by scanning stages and a programmable control.
5. Resolution
The measurement of the resolution in z-direction was performed with a black sphere made of black oil-based paint with a diameter of 250 µm embedded in gelatin. For this experiment, the sample was moved together with the illumination in z-direction and rotated. The line illumination was in this scan always focused onto the black sphere. In this way, the focusing properties of the cylindrical lens were investigated. Normally in an imaging experiment the illumination would be fixed relative to the detector, leading to some additional focusing onto the selected section of the object and improvement of the resolution in z-direction. The detector was moved in z-direction in steps of 100 µm. 31 planes were recorded, which gives a total scan length of 3 mm.
After recording, the signals were Abel transformed and then the inverse Radon transform was applied to data acquired for each imaging plane (Fig. 4(a) ). In the displayed image only the positive values are used. The z-resolution of the detector was estimated from a profile of the reconstructed image. For the given detection setup the apparent width of the spherical source was 525 µm (Fig. 4(b)). It is a convolution of the resolution with the size of the sphere. We performed a deconvolution by searching for the width of a Gaussian function that gives after convolution with the rectangular cross section of the sphere the observed profile. The result was a resolution of 495 µm.
Fig. 4.
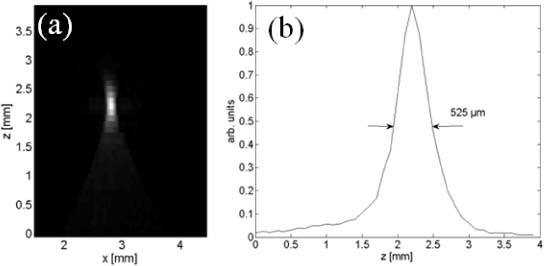
(a) Reconstructed image of a single sphere in a plane parallel to the rotation axis; (b) profile of a single sphere in z-direction.
To measure the in-plane resolution a black human hair with a diameter of 80 µm was used (Fig. 5(a) ). It was mounted on a plastic frame. The hair was oriented parallel to the z-direction and the illumination was aligned parallel to the x-y-plane.
Fig. 5.
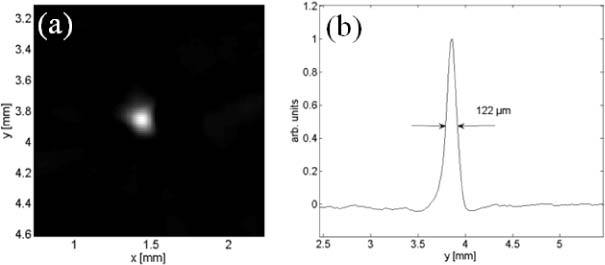
(a) Section image of a single black hair with a diameter of 80 µm; (b) profile in x-direction.
A profile of the hair image in the x-y-plane after the Abel and the inverse Radon transform is shown in Fig. 5(b). A width of 122 µm was measured, which gave a resolution of 108 µm after performing the deconvolution as described above. This is compatible with characteristics of the PVDF-foil, which owing to its thickness of 110 µm has an upper frequency limit of about 9 MHz [20].
6. Imaging results
Finally, to demonstrate the section imaging capabilities of the cylindrical detector, experiments on a biological sample were done. The sample was a zebra fish, which was embedded in gelatin for stabilization and for mounting it to the scanning stages. The illuminating lines were fixed to the height of the focusing plane of the detector. The rotational axis of the fish was chosen to be near the focusing length of the cylindrical detector. Signals were acquired with averaging over 5 scans and were amplified with a bandwidth of 15 MHz.
Figure 6 shows section images of a zebra fish. The data was processed using a band pass filter with lower frequency limit of 250 kHz and upper limit of 10 MHz. Supplementary the data was Abel transformed before applying the inverse Radon transform. Clearly shown are the stripes of the zebra fish but also the spine, fins and some other inner structures can be seen. The sections were taken at step size of 2 mm from the tail to the head and one can see the emersion of the inner structures throughout the different sections.
Fig. 6.
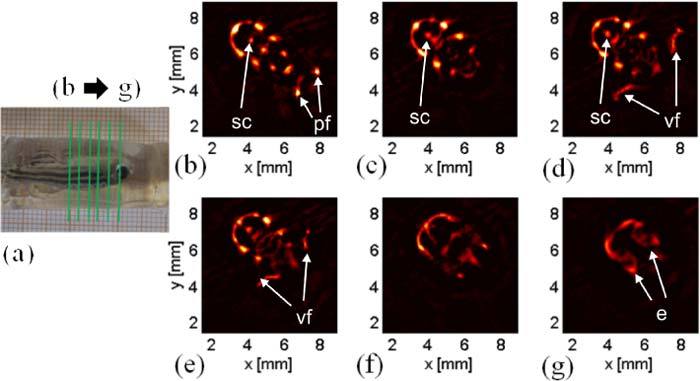
(a) photograph of the embedded zebrafish; (b)–(g) sections of the zebrafish (indicated as green lines in (a)): sc, spinal cord; pf, pelvic fins; vf, ventral fins; e, eyes.
7. Discussion
Full 3D PAT with a single point or line detector is very time consuming. A typical number of detector positions lies between 104 and 105, leading to data acquisition times on the order of hours when the laser pulse repetition rate is 10 Hz. Visualizing single sections of interest therefore saves time. Criteria are exact reconstruction within the section and low crosstalk between sections. Current approaches use small cylindrical detectors and assume a point like sensor in the reconstruction. However, real detectors must have finite size and the point assumption is not exactly valid, which leads to limitations in the accuracy of the reconstruction. Model based reconstruction methods taking into account the finite detector size have been proposed to improve the accuracy [21]. In this work we proposed using a large integrating cylindrical detector that allows the use of the inverse Radon transform for reconstruction. The only condition for validity of this approach is that the detector has a certain minimum size given by Eq. (2). As a necessary signal processing step the Abel transform converts the measured signal into positive and symmetric signals which are more appropriate for the reconstruction than the raw, bipolar signals.
Using the cylindrical detector gives a resolution of about 100 µm in the x-y-plane. The resolution along the z-axis is in the range of about 500 µm which can be explained by the fact that the focus of the detector has a finite width in this direction. As explained above, the value given here can be regarded as an upper limit of the resolution because the illumination was moved together with the object. Depending on the optical scattering within the sample, the illumination with the line source fixed relative to the detector could lead to better resolution and thus lower crosstalk between sections.
Compared to a tomographic full 3D image taken with a point or line sensor, the image formed by the focusing cylindrical sensor is affected by the trade-off between resolution and depth of field. The z-resolution is given by the lens properties and depends on the range of acoustic wave-vector (k-vector) directions gathered by the finite numerical aperture of the lens. Consequently, the resolution is not uniform and much higher in x-y-plane (the plane of a single section image) than in out of plane direction. In full 3D imaging with a small (point or line) sensor, where signals are taken all around the sample, the full k-space is sampled, enabling a reconstruction with uniform resolution [22]. The effect of finite depth of field can be best seen in the simulations (Fig. 2): The outer sources, which move far away from the focus of the lens during a circular scan, appear somewhat blurred, although with reasonable resolution. The blurring in Fig. 2 is in radial direction relative to the rotation axis, which is located in the center of the image. In contrast, an approximate point sensor with finite size causes blurring in lateral direction [23]. In the case of the cylindrical detector, the blurring can be reduced by using a lens with smaller NA. The concomitant deterioration of the out of plane resolution may be acceptable in certain applications. An example is imaging of a fairly transparent object, where the crosstalk between sections can be minimized by the line illumination.
8. Conclusion
Photoacoustic imaging with a circularly scanning, cylindrical piezoelectric detector provides a method for obtaining sections of a sample within relatively short time. The effect of finite detector size is avoided by using an integrating geometry, where the detector is larger than the imaging object. A possible application of such a sensor is the imaging of selected slices of small animals in biological or preclinical research.
Acknowledgments
This work has been supported by the Austrian Science Fund (FWF), projects Nos. S10502-N20, S10508-N20 and L418-N20. We thank D. Meyer (University of Innsbruck) for the supply of zebra fish.
References and links
- 1.Xu M. H., Wang L. V., “Photoacoustic imaging in biomedicine,” Rev. Sci. Instrum. 77(4), 041101 (2006). 10.1063/1.2195024 [DOI] [Google Scholar]
- 2.Kruger R. A., Kiser W. L., Reinecke D. R., Kruger G. A., Miller K. D., “Thermoacoustic molecular imaging of small animals,” Mol. Imaging 2(2), 113–123 (2003). 10.1162/153535003322331993 [DOI] [PubMed] [Google Scholar]
- 3.Wang X. D., Pang Y. J., Ku G., Xie X. Y., Stoica G., Wang L. V., “Noninvasive laser-induced photoacoustic tomography for structural and functional in vivo imaging of the brain,” Nat. Biotechnol. 21(7), 803–806 (2003). 10.1038/nbt839 [DOI] [PubMed] [Google Scholar]
- 4.Ma R., Taruttis A., Ntziachristos V., Razansky D., “Multispectral optoacoustic tomography (MSOT) scanner for whole-body small animal imaging,” Opt. Express 17(24), 21414–21426 (2009). 10.1364/OE.17.021414 [DOI] [PubMed] [Google Scholar]
- 5.Xu Z., Zhu Q., Wang L. V., “In vivo photoacoustic tomography of mouse cerebral edema induced by cold injury,” J. Biomed. Opt. 16(6), 066020 (2011). 10.1117/1.3584847 [DOI] [PMC free article] [PubMed] [Google Scholar]
- 6.Kolkman R. G. M., Steenbergen W., van Leeuwen T. G., “In vivo photoacoustic imaging of blood vessels with a pulsed laser diode,” Lasers Med. Sci. 21(3), 134–139 (2006). 10.1007/s10103-006-0384-z [DOI] [PubMed] [Google Scholar]
- 7.Laufer J., Cleary J. O., Zhang E. Z., Lythgoe M. F., Beard P. C., “Photoacoustic imaging of vascular networks in transgenic mice,” Proc. SPIE 7564, 75641A–, 75641A-5. (2010). 10.1117/12.842204 [DOI] [Google Scholar]
- 8.Fronheiser M. P., Ermilov S. A., Brecht H. P., Conjusteau A., Su R., Mehta K., Oraevsky A. A., “Real-time optoacoustic monitoring and three-dimensional mapping of a human arm vasculature,” J. Biomed. Opt. 15(2), 021305 (2010). 10.1117/1.3370336 [DOI] [PMC free article] [PubMed] [Google Scholar]
- 9.Ermilov S. A., Khamapirad T., Conjusteau A., Leonard M. H., Lacewell R., Mehta K., Miller T., Oraevsky A. A., “Laser optoacoustic imaging system for detection of breast cancer,” J. Biomed. Opt. 14(2), 024007 (2009). 10.1117/1.3086616 [DOI] [PubMed] [Google Scholar]
- 10.Manohar S., Kharine A., van Hespen J. C., Steenbergen W., van Leeuwen T. G., “The Twente Photoacoustic Mammoscope: system overview and performance,” Phys. Med. Biol. 50(11), 2543–2557 (2005). 10.1088/0031-9155/50/11/007 [DOI] [PubMed] [Google Scholar]
- 11.Heijblom M., Piras D., Ten Tije E., Xia W. F., van Hespen J., Klaase J., van den Engh F., van Leeuwen T., Steenbergen W., Manohar S., “Breast imaging using the Twente Photoacoustic Mammoscope (PAM): new clinical measurements,” Proc. SPIE 8087, 80870N–, 80870N-7. (2011). 10.1117/12.889664 [DOI] [Google Scholar]
- 12.Oberheide U., Bruder I., Welling H., Ertmer W., Lubatschowski H., “Optoacoustic imaging for optimization of laser cyclophotocoagulation,” J. Biomed. Opt. 8(2), 281–287 (2003). 10.1117/1.1559998 [DOI] [PubMed] [Google Scholar]
- 13.Haltmeier M., Scherzer O., Burgholzer P., Paltauf G., “Thermoacoustic computed tomography with large planar receivers,” Inverse Probl. 20(5), 1663–1673 (2004). 10.1088/0266-5611/20/5/021 [DOI] [Google Scholar]
- 14.Burgholzer P., Hofer C., Paltauf G., Haltmeier M., Scherzer O., “Thermoacoustic tomography using integrating detectors,” Proc. SPIE 5864, 586403–, 586403-12. (2005). 10.1117/12.632908 [DOI] [PubMed] [Google Scholar]
- 15.Razansky D., Distel M., Vinegoni C., Ma R., Perrimon N., Köster R. W., Ntziachristos V., “Multispectral opto-acoustic tomography of deep-seated fluorescent proteins in vivo,” Nat. Photonics 3(7), 412–417 (2009). 10.1038/nphoton.2009.98 [DOI] [Google Scholar]
- 16.Burgholzer P., Hofer C., Paltauf G., Haltmeier M., Scherzer O., “Thermoacoustic tomography with integrating area and line detectors,” IEEE Trans. Ultrason. Ferroelectr. Freq. Control 52(9), 1577–1583 (2005). 10.1109/TUFFC.2005.1516030 [DOI] [PubMed] [Google Scholar]
- 17.G. Paltauf, R. Nuster, M. Haltmeier, and P. Burgholzer, “Photoacoustic tomography with integrating area and line detectors,” in Photoacoustic Imaging and Spectroscopy, L. V. Wang, ed. (CRC Press, Boca Raton, FL, 2009), pp. 251–263. [Google Scholar]
- 18.Burgholzer P., Bauer-Marschallinger J., Grün H., Haltmeier M., Paltauf G., “Temporal back-projection algorithms for photoacoustic tomography with integrating line detectors,” Inverse Probl. 23(6), S65–S80 (2007). 10.1088/0266-5611/23/6/S06 [DOI] [Google Scholar]
- 19.Xiang D., Hsu N. N., Blessing G. V., “The design, construction and application of a large aperture lens-less line-focus PVDF transducer,” Ultrasonics 34(6), 641–647 (1996). 10.1016/0041-624X(96)00058-3 [DOI] [Google Scholar]
- 20.Oraevsky A., Karabutov A., “Ultimate sensitivity of time-resolved opto-acoustic detection,” Proc. SPIE 3916, 228–239 (2000). 10.1117/12.386326 [DOI] [Google Scholar]
- 21.Rosenthal A., Ntziachristos V., Razansky D., “Model-based optoacoustic inversion with arbitrary-shape detectors,” Med. Phys. 38(7), 4285–4295 (2011). 10.1118/1.3589141 [DOI] [PubMed] [Google Scholar]
- 22.Haltmeier M., Zangerl G., “Spatial resolution in photoacoustic tomography: effects of detector size and detector bandwidth,” Inverse Probl. 26(12), 125002 (2010). 10.1088/0266-5611/26/12/125002 [DOI] [Google Scholar]
- 23.Xu M. H., Wang L. V., “Analytic explanation of spatial resolution related to bandwidth and detector aperture size in thermoacoustic or photoacoustic reconstruction,” Phys. Rev. E Stat. Nonlin. Soft Matter Phys. 67(5), 056605 (2003). 10.1103/PhysRevE.67.056605 [DOI] [PubMed] [Google Scholar]


