

Abstract
We present a double-helix point spread function (DH-PSF) based three-dimensional (3D) microscope with efficient photon collection using a phase mask fabricated by gray-level lithography. The system using the phase mask more than doubles the efficiency of current liquid crystal spatial light modulator implementations. We demonstrate the phase mask DH-PSF microscope for 3D photo-activation localization microscopy (PM-DH-PALM) over an extended axial range.
OCIS codes: (180.6900) Three-dimensional microscopy, (220.4000) Microstructure fabrication, (110.4850) Optical transfer functions, (050.1970) Diffractive optics
1. Introduction
During the last few years we have witnessed a revolution in optical methods that overcome the resolution limitations of classical microscopy [1–5]. Of these, super-resolution methods PALM [2], F-PALM [3] and STORM [4] are based on localization of photoactivatable or photoswitchable fluorescent molecules with nanometer accuracy in a wide-field image. Recently, these localization based super-resolution methods have been extended to 3D imaging by using special microscope modalities like, astigmatic imaging [6], bi-plane imaging [7], interferometric imaging [8], and double-helix point spread function (DH-PSF) [9].
The DH-PSF is an engineered point spread function applied to 3D imaging, including ranging [10], particle localization [11], particle tracking [12–14], and localization based super-resolution imaging [9,15]. DH-PSF microscopy is advantageous because it provides uniformly high 3D localization precision and longer depth range [16,17] than methods that use a standard PSF [18], astigmatic PSF [6,19–22], or bi-plane imaging [7,21–24].
The DH-PSF has two transverse lobes that rotate about the optical axis with defocus [10,25]. When applied to particle imaging, the DH-PSF provides information about the 3D position of multiple particles within a single image [12]. The 3D position of a particle on the object side is recorded on the image plane in the form of a rotation pattern of the two main lobes. The transverse position is then determined by the center of the pattern and the axial position is determined by its orientation.
The DH-PSF is realized by modifying the pupil plane of the imaging system with a pre-designed phase modulation (phase mask) [25]. All previous implementations of the DH-PSF required either a hologram [10] or a liquid crystal (LC) Spatial Light Modulator (SLM) to apply this phase modulation [9,12,15,25]. Whereas SLMs enable dynamic modulation of the pupil function, they also limit the amount of light transmitted to the detector because they are designed to work with linear polarization producing up to 50% photon loss. Furthermore, SLM’s non-ideal modulation results in limited diffraction efficiency (typically in the order of 60% [9,12]). Even with state-of-the-art reflective LC SLMs (Boulder Nonlinear Systems, XY512 Nematic SLM with high efficiency mirror—diffraction efficiency 95%), at best only 47.5% of the photons crossing the system pupil will be detected for an isotropically emitting source. This is a critical limitation for photon-limited applications, like single-molecule fluorescence microscopy, because the loss of photons is directly related to a reduction in precision and resolution [16,26]. Hence, to realize the limits of precision, maximizing the photon-efficiency of the optical system is required. One demonstrated solution is to record a second DH-PSF image by using a half-wave plate to rotate the rejected orthogonally polarized light and then modulating it with the SLM [15]. This approach provides additional polarization information but requires more complicated systems that still suffer from the losses due to the non-ideal SLM diffraction efficiency.
In this paper, we introduce a photon-efficient 3D DH microscope and demonstrate it for photo-activation localization microscopy (PALM). The key innovation is the use of a polarization-insensitive, lithographically fabricated, phase mask (PM) for the efficient collection of emitted photons. This photon-efficient DH microscope represents a major step towards realizing the theoretical localization precision limits while contributing towards an easy implementation of DH-PSFs. We present details of the mask fabrication process in section 2 and the experimental characterization in section 3. Section 4 describes the application to 3D PM-DH-PALM.
2. Phase mask design and fabrication
The phase mask profile to be generated is given in Fig. 1(a) and its design, based on the theory of propagation invariant beams [27] and 3D light-field synthesis [28], has been reported in [25]. The selected design has phase modulation in the range 0-2π and presents seven phase vortices.
Fig. 1.

(a) Surface profile of the DH phase mask design. (b) Measured surface profile of the fabricated phase mask. The colormap corresponds to the height relief. The diameter of the mask is 2.7 mm.
In order to implement this phase mask we control the surface profile of the phase modulation element. Here, we use a positive photo-resist (AZ-4210, Clariant) spin-coated on a glass slide. The relation between surface height h and phase delay φ is, h = λφ/[2π(n-1)], where λ is the modulated wavelength and n is the refractive index of the resist after development. The refractive index for UV-bleached photo-resist was measured using ellipsometry resulting in n = 1.635 ± 0.003 at λ = 632.8 nm.
The photoresist is exposed with a gray-level intensity profile representing the phase modulation of the DH-PSF mask using a mask-less lithography system (IMP SF-100 EXPRESS). A single-shot exposure process enables up to 30 phase levels of addressable height in the photo-resist. The exposed mask is developed in a mixture of AZ-400K and de-ionized water at a ratio of 1:4 for 3 minutes and bleached with a UV lamp to reduce the optical absorbance of the material. In the experiments reported here, the phase mask is 2.7 mm in diameter.
3. Phase mask characterization
We used surface profilometry to characterize the phase mask quality and conducted optical tests to establish the optical efficiency and PSF performance.
3.1. Profilometric measurement
A white light interferometer (Zygo New View) was used to verify that the fabricated mask follows the required phase design of the DH-PSF mask. Figure 1(a) shows the design height relief for 514 nm wavelength and the mask design from Ref. [25], while (b) shows the surface profile of the fabricated mask as measured by the profilometer.
The fabricated mask matches the design relief in terms of position of phase vortices, phase gradient and location of the extrema. It is important to note that phase vortices and their locations are critical for generating the desired DH-PSF. The mask was fabricated and tested for λ = 514 nm. The 2π phase delay in wavefront corresponds to a thickness of 816 nm for this photoresist. The imperfections shown in Fig. 1(b) contribute to some scattering, but as we show below, they lead to minor deviations from the ideal DH-PSF design.
3.2. Efficiency measurement
The transmission efficiency of the fabricated mask and its ability to localize energy into the characteristic pattern was measured to determine the deviation from ideal performance. The testing setup is shown in Fig. 2(a) . The 514 nm wavelength line of an Ar + laser (Coherent) is spatial filtered and collimated with a lens of 100 mm focal length (L1). The resulting collimated beam is apertured right after the lens to a 2.7 mm diameter. A second lens (L2) of focal length f = 100 mm focuses the beam onto a CCD camera (Point Grey Research, Chameleon CMLN-13S2M-CS). The fabricated phase mask is placed at the front focal plane of L2 to generate the DH-PSF, and mounted on an x-y-z translation. Alignment is determined via observation of the PSF as the stage is adjusted. Images of the standard PSF are acquired by removing the fabricated mask. The camera is adjusted to maximize dynamic range using the standard PSF and these parameters are stored for later testing of the DH-PSF with the fabricated phase mask in place.
Fig. 2.

(a) Setup for efficiency measurement of the fabricated DH mask. The 514 nm Ar + laser line is spatially filtered. L1 and L2 are achromatic lenses of focal length f = 100 mm. The phase mask is positioned at the back focal plane of L1 (front focal plane of L2) using an x-y-z translation stage. (b) and (c) show respectively the experimental standard and DH PSF, while (d) and (e) show the corresponding, numerically simulated, PSFs. The scale bar is 150 µm.
Figures 2(b) and (c) show the experimental standard PSF and DH-PSF images, respectively. Figures 2(d) and (e) show the PSFs simulated numerically [10] with the same system parameters including noise. The dark regions in the experimental PSF images, shown in Figs. 2(b) and (c), were characterized and found to have single pixel 0/1 noise with density 0.3. This noise was added to the simulated PSF images so as to make theoretical efficiency calculations consistent with the experimental conditions.
One method of measuring the transmission efficiency, η, through the mask is to observe the reading of an optical power meter placed behind the Fourier plane with and without the fabricated mask in the beam path, resulting in η = 87%
Alternatively, the CCD measurements shown in Figs. 2(b)–(e) were used to determine the transmission efficiency. The relative energy in the DH-PSF image with respect to the energy in the standard PSF image was found to be 83.4% and 95.8%, for the experimental and theoretical cases, respectively. The transmission efficiency of the phase mask is given by the ratio of these numbers leading to η = 87%. The theoretical relative energy was used to compensate the experimental relative energy for the effects of a finite detector. The transmission efficiency found by the two methods described above turned out to be the same.
The remaining 13% of the energy that is not transmitted is lost in reflection, absorption, and scattering. Specular and diffused reflection account for about 11% and can be easily reduced using anti-reflection coatings. Absorption and scattering can be reduced by improving the optical material quality, for instance, by transferring the mask to glass or quartz.
Another measure of the functional efficiency for the fabricated mask is the ratio of the experimental peak intensities for the standard and DH-PSF, [ISTD/IDH]EXP, as compared to the theoretical value [ISTD/IDH]THEO. These ratios were found to be 8.7 and 7.2 respectively giving a functional efficiency, [ISTD/IDH]THEO/[ISTD/IDH]EXP x100 = 83%. If this efficiency is compensated to take into account the transmission loss, it results in a functional efficiency of 83/.87 = 95%.
3.3. PSF characterization and calibration
The phase mask is placed in a custom table top fluorescence microscope depicted in Fig. 3 . The setup consists of a 488 nm Argon line for the excitation beam and a 405 nm laser diode for the activation beam (for PALM experiments). Both beams are coupled into the microscope objective (Plan-Neofluar Zeiss, NA = 1.3) using lens Lc of focal length f = 100 mm. A dichroic D1 (Omega QMAX 410) is used to combine the 488 nm and 405 nm beams, while dichroic D2 (Semrock Di01-R405/488/561/635) separates the excitation and activation beams from the emitted signal (at 514 nm). An achromatic lens, TL with f = 150 mm, together with the objective provides a magnification of 91X at the intermediate image plane (dashed line). The fabricated phase mask is placed in the Fourier plane of a 4F relay system such that the back focal plane of the microscope objective (which is inaccessible) is imaged onto the phase mask. The first lens L1 of the relay system is of focal length f = 100 mm. A second lens L2, f = 150 mm focuses the field onto the camera (Andor iXon EMCCD) for a total system magnification of ~137X. An iris is placed close to the phase mask to stop the beam down to the diameter of the fabricated mask, 2.7 mm. This limiting aperture reduces the NA of the system to 1.23. The fabricated mask is mounted on an x-y-z translation stage for precise alignment. A band pass emission filter (Omega QMAX 510-560) is placed in the beam path. The camera is cooled to −80°C for all experiments. The samples are mounted on a 3D, nanometer resolution piezo translation stage (Physike Instrumente PZ 164E).
Fig. 3.
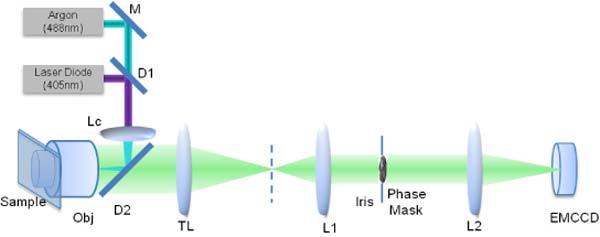
The setup for DH-PSF characterization and PM-DH-PALM experiment. The objective, Obj is 1.3NA Zeiss Plan-NeoFluar, Lc is f = 100 mm achromat. TL, L1 and L2 are achromatic lenses with focal lengths, fTL = 150 mm, fL1 = 100 mm and fL2 = 150 mm, respectively. The phase mask is positioned at the back focal plane of L1 (front focal plane of L2) using an x-y-z translation stage.
The calibration of the DH-PSF is accomplished by imaging a slide containing quantum dots (QD-525, Invitrogen) which are mounted in a 90% glycerol solution. Quantum dot blinking was not observed in this medium at the imaging rates used in all the reported experiments.
The quantum dots were chosen so that the emission spectrum closely resembles that of PA-GFP (photo-activatable green fluorescent protein) for future use in PM-DH-PALM. Figure 4(a) shows the image of a quantum dot cluster generating the shape of two lobes rotating with defocus to form a double-helix. The axial range of this system, corresponding to 180° rotation of the two lobes of double-helix, is 4 µm. The sample is translated through the full range in 100 nm intervals for calibration purposes. 60 images with 100 ms exposure are acquired at each axial position.
Fig. 4.
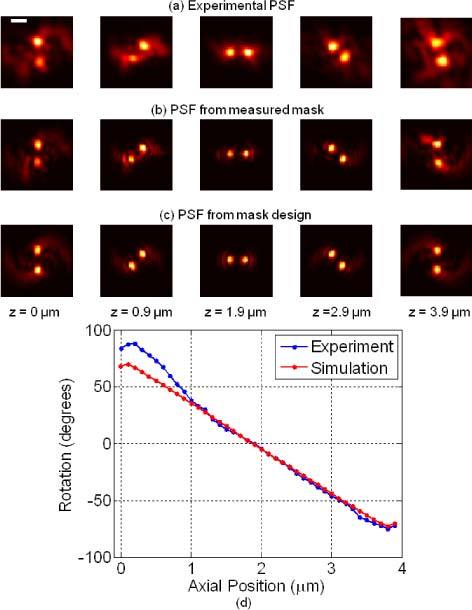
The transverse (x-y) images for different z positions are shown for (a) the experimental PSF obtained with the fabricated DH phase mask, (b) the simulated PSF using the measured surface profile of the DH mask, and (c) the simulated PSF using the original mask design. System parameters are NA = 1.23 and M = 137X. The scale bar is 1 µm. (d) Calibration curve showing the plot of the DH-PSF rotation angle versus the axial position of the emitter, for the experimental PSF and, for comparison, the same plot for the ideal PSF obtained from the mask design.
For comparison, the PSFs generated numerically using the measured mask (from profilometer data), as well as the ideal design, are shown in Figs. 4(b) and (c) respectively. The experimental PSF in Fig. 4(a) is blurred relative to the PSFs in Fig. 4(b) or (c) because the imaged particle was a quantum dot aggregate, which contributes to an increase in the lobe size relative to an ideal point source.
The relation between axial position and the rotation angle of the two lobes, generates a calibration curve, which is calculated with an angle estimator (AE) [12] and is shown in Fig. 4(d). The AE calculates the weighted centroid of each lobe to give the rotation angle of the PSF at each z position. The transverse position is estimated by the midpoint of the weighted centroids. The calibration curve matches the theoretical prediction very well in the axial region from z = 1 µm to 3.9 µm. Due to aberrations in the intensity profile for the region z < 1 µm, we did not consider it further in the analysis.
Interestingly, in the calibration curve for the simulated PSF, the full range of the rotation angle established by the AE is ± 70°, even though the two peaks of the PSF are seen to rotate by ± 90°. This difference is because the AE used here searches for two lobes by adaptively thresholding and calculating the weighted centroid of each lobe. The resulting thresholded lobes are not restricted to a particular shape around the peak. As a result, the weighted centroid is shifted with respect to the intensity peak for each lobe leading to a smaller rotation angle value.
The calibration data in Fig. 4(d) is also used to estimate the precision of the 3D position estimator along the axial range of operation [12]. The AE provides the x, y position and rotation angle from the image. With the known rotation angle, the z position is then determined from the calibration curve. The precision of the estimations with varying z position are shown in Fig. 5 . For the 3 µm axial range the average precision is σ(X,Y,Z) = (3.8 nm, 2.4 nm, 3.7 nm). For this quantum dot cluster, the number of photons detected in the two lobes at focus were 56000 ± 9400. If necessary, this precision can be improved by using the pattern matching maximum-likelihood estimator (MLE) [29].
Fig. 5.
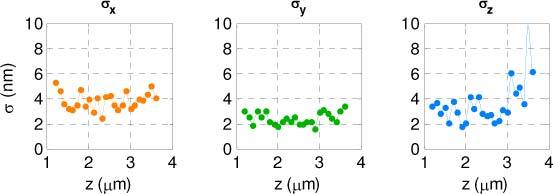
The precisions of the estimated x, y and z positions using the Angle Estimator for the quantum dot cluster used in the calibration.
4. Phase-Mask Double-Helix Photo-Activation Localization Microscopy- PM-DH-PALM
Results in the previous sections establish the capability of the fabricated mask to perform the DH functionality in a microscope setup. In this section we report on the use of this microscope for 3D PALM. In the PM-DH-PALM modality, a sparse set of photo-activatable fluorescent molecules in an initial inactive (non-fluorescence) state are stochastically photo-activated with an activation beam (405 nm for PA-GFP) to the fluorescent state. In a second step, an excitation laser (488 nm in case of PA-GFP) is used to excite these activated fluorescent molecules for imaging [2,3]. By controlling the exposure (power and duration) of the activation light, the number of activated and imaged molecules can be controlled [3]. In the PM-DH-PALM modality, images of individual fluorescent molecules are seen as double spots, corresponding to the DH-PSF, until they turn off due to photobleaching. These images are used to estimate the 3D positions of the fluorescent molecules. Cycling the reactivation beam allows a different set of molecules to be imaged in every exposure. The acquisition of multiple images over time provides information about the precise distribution of molecules in the 3D volume. In 3D PALM, the spatial overlap of molecules closer than the diffraction limit is no longer the physical limit to resolution. Instead the limiting process becomes the 3D localization precision.
To test the performance of the DH-PSF microscope, the localization precision of a quantum dot was measured to be σQD(X,Y,Z) = (10 nm, 13 nm, 38 nm) with an average of ~8551 ± 1062 detected photons. A representative image of the quantum dot as well as histograms for position estimation of 150 images are shown in Figs. 6(a)–(d) . This quantum dot was mounted in the PALM sample and was used as a fiduciary. Hence these measurements were performed under the same experimental conditions of single molecules in the PM-DH-PALM experiment, including background noise and sample induced aberrations.
Fig. 6.
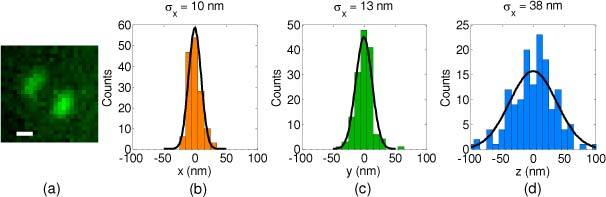
(a) An image of the quantum dot. The scale bar is 500 nm. The 3D position of the quantum dot was estimated using the Angle Estimator. Panels (b), (c) and (d) show the histogram of 150 position estimations along x, y and z dimensions.
4.1. PM-DH-PALM Experiment
Samples of the PtK1 (Rat Kangaroo Kidney Epithelial) cells expressing PA-GFP-tubulin were prepared for the PM-DH-PALM experiment. These cells were mounted in the same 90% glycerol solution as used for the calibration sample in section 3.3. The experimental setup is given in Fig. 3. The excitation beam at 488 nm remains on throughout the experiment. The 405 nm activation laser diode was controlled to turn on for 1.5 seconds at an interval of 10.5 seconds so as to bleach as many of the activated molecules as possible before turning on others in next activation cycle. The images were acquired for 47 minutes with 200 ms exposure time. To monitor the spatial drift over time, quantum dots acting as fiduciaries were mounted in the PtK1 cell samples.
4.2. Data Analysis
A time-series of images was acquired for analysis. In order to identify the potential single-molecules, we implemented low-pass filtering and spatially varying background subtraction [30] followed by adaptive thresholding. The potential molecule images were then tested for the size of the lobes and the distance between the two lobes against the values obtained for these parameters from the calibration data. Confirmed molecules are then used to estimate the x, y and z positions with the AE [12]. Drift of the sample while PALM imaging was recorded by use of two fiduciary quantum dots which were constantly emitting at the edges of the field. The estimated 3D positions for all the molecules were corrected for the drift. The 3D distribution of molecules in the sample after reconstruction is shown in Fig. 7(a) .
Fig. 7.
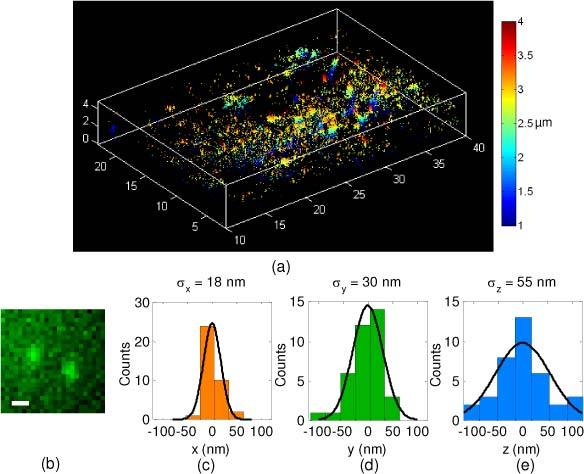
3D single PA-GFP-tubulin molecule localizations in PtK1 cells using PM-DH-PALM with a surface relief phase mask. (a) 3D image of the reconstructed region. The colormap encodes depth. (b) image of one detected molecule (see text for details). The scale bar is 500 nm. The estimation of the 3D position for this single molecule was done using the Angle Estimator. (c), (d) and (e) show the histogram of 37 position estimations along x, y and z.
For a bright molecule with an average of 6985 ± 1390 photons detected per image, the localization precisions along each dimension were calculated to be σMolecule(X,Y,Z) = (18 nm, 30 nm, 55 nm). A representative image and histograms using 37 estimations for 3D positions are shown in Figs. 7(b)–(e).
Figure 8 displays the average precision performance of the PM-DH-PALM experiment. The detected time series provided 15,433 molecule images. Figure 8(a) shows a histogram reporting the number of molecules observed with a given number of detected photons in the two lobes of each DH-PSF image. The median number of photons detected per image was 911. If a double-lobed image appeared in consecutive images (closer than 250 nm in the transverse and 500 nm in the axial direction) it was identified as belonging to a single molecule. In this way, the number of identified molecules was 9313; among them, molecules for which 850 to 950 photons per image were detected led to a localization precision σ(X,Y,Z) = (33 nm, 30 nm, 76 nm). This precision was calculated for molecules emitting for at least four consecutive images. The histograms in Figs. 8(b)–(d) show the mean-subtracted (x, y, z) positions for each estimation.
Fig. 8.

Average performance of the PM-DH-PALM experiment: (a) Histogram of the number of molecules observed with a given number of photons detected in the two DH lobes. Median number of photons is 911. (b)-(d) show the histograms of 3D position estimations of identified molecules with detected photons in the range 850 to 950. The observed precision was σ(X,Y,Z) = (33 nm, 30 nm, 76 nm).
5. Discussion
These particle localization and PM-DH-PALM experiments are representative of the PM-DH microscope capability for super-resolution microscopy and photon-limited imaging. Because few tools are currently available to increase the fluorescence emission of single-molecule fluorophores, the efficient photon collection by phase masks is critical for 3D DH-PALM imaging.
In the reported experiments, surface reflections and scattering within the phase mask are responsible for a 13% percent light loss relative to a standard fluorescence setup. However these losses can be further mitigated by use of anti-reflection coatings and improved fabrication processes. Phase masks could also be fabricated by other means beyond gray-level lithography, for instance via graded index materials or multilevel diffractive optics.
SLM implementations of DH microscopes have been reported elsewhere [9,12–15]. SLMs require more complicated setups than fixed phase masks but the PSFs they generate are of comparable quality to those of Fig. 4 [9]. However, with current state-of-the-art modulation technology, for isotropic emitters, at best, a maximum efficiency of only 47.5% is possible, which is about half of the demonstrated efficiency for the fixed phase mask. Hence, if the PALM experiments had been performed with a SLM based setup, the estimation of molecule positions would have been significantly less precise (by about a factor of 2). To compensate for this loss, the number of photons collected per molecule image could be increased by raising the excitation power but this is associated with an increase in background auto-fluorescence and potential photodamage.
Surface-relief phase-mask based microscopes present the advantages of high transmission efficiency, accurate DH-PSF reproduction, and ease of integration. On the other hand, SLM microscopes provide fast and adaptive manipulation of the PSF. Such flexibility could prove handy, for example, when experimenting with fluorophores with different emission spectra. However, prior work has shown [25] that DH-PSF mask designs provide a working bandwidth of 100 nm, suggesting that a few fixed phase masks would suffice for most applications.
In the implementation reported here, we used a custom microscope built on an optical table and a 4F system to image the back focal plane of the objective onto the mask. However, fixed phase masks can be easily incorporated in commercially available microscopes by insertion at the back aperture of the objective.
In conclusion, we demonstrated a DH-PSF microscope with efficient photon collection and its application in 3D PALM. Efficient phase masks open the way for photon efficient DH microscopy collecting in excess of 90% of photons relative to standard microscopes. DH surface relief phase masks also provide an easy path to integrate the technique with conventional microscopes.
Acknowledgments
We thankfully acknowledge Dr. Jennifer DeLuca and Dr. Keith DeLuca for providing the samples used in the experiments and useful discussions. This research was supported by the National Science Foundation under awards DBI- 0852885, DBI-1063407, DGE- 0801680 and NNIN at the Colorado Nanofabrication Laboratory and the National Science Foundation under Grant No. ECS-0335765.
References and Links
- 1.Lidke K., Rieger B., Jovin T., Heintzmann R., “Superresolution by localization of quantum dots using blinking statistics,” Opt. Express 13(18), 7052–7062 (2005). 10.1364/OPEX.13.007052 [DOI] [PubMed] [Google Scholar]
- 2.Betzig E., Patterson G. H., Sougrat R., Lindwasser O. W., Olenych S., Bonifacino J. S., Davidson M. W., Lippincott-Schwartz J., Hess H. F., “Imaging intracellular fluorescent proteins at nanometer resolution,” Science 313(5793), 1642–1645 (2006). 10.1126/science.1127344 [DOI] [PubMed] [Google Scholar]
- 3.Hess S. T., Girirajan T. P. K., Mason M. D., “Ultra-high resolution imaging by fluorescence photoactivation localization microscopy,” Biophys. J. 91(11), 4258–4272 (2006). 10.1529/biophysj.106.091116 [DOI] [PMC free article] [PubMed] [Google Scholar]
- 4.Rust M. J., Bates M., Zhuang X., “Sub-diffraction-limit imaging by stochastic optical reconstruction microscopy (STORM),” Nat. Methods 3(10), 793–796 (2006). 10.1038/nmeth929 [DOI] [PMC free article] [PubMed] [Google Scholar]
- 5.Schmidt R., Wurm C. A., Jakobs S., Engelhardt J., Egner A., Hell S. W., “Spherical nanosized focal spot unravels the interior of cells,” Nat. Methods 5(6), 539–544 (2008). 10.1038/nmeth.1214 [DOI] [PubMed] [Google Scholar]
- 6.Huang B., Wang W., Bates M., Zhuang X., “Three-dimensional super-resolution imaging by stochastic optical reconstruction microscopy,” Science 319(5864), 810–813 (2008). 10.1126/science.1153529 [DOI] [PMC free article] [PubMed] [Google Scholar]
- 7.Juette M. F., Gould T. J., Lessard M. D., Mlodzianoski M. J., Nagpure B. S., Bennett B. T., Hess S. T., Bewersdorf J., “Three-dimensional sub-100 nm resolution fluorescence microscopy of thick samples,” Nat. Methods 5(6), 527–529 (2008). 10.1038/nmeth.1211 [DOI] [PubMed] [Google Scholar]
- 8.Shtengel G., Galbraith J. A., Galbraith C. G., Lippincott-Schwartz J., Gillette J. M., Manley S., Sougrat R., Waterman C. M., Kanchanawong P., Davidson M. W., Fetter R. D., Hess H. F., “Interferometric fluorescent super-resolution microscopy resolves 3D cellular ultrastructure,” Proc. Natl. Acad. Sci. U.S.A. 106(9), 3125–3130 (2009). 10.1073/pnas.0813131106 [DOI] [PMC free article] [PubMed] [Google Scholar]
- 9.Pavani S. R. P., Thompson M. A., Biteen J. S., Lord S. J., Liu N., Twieg R. J., Piestun R., Moerner W. E., “Three-dimensional, single-molecule fluorescence imaging beyond the diffraction limit by using a double-helix point spread function,” Proc. Natl. Acad. Sci. U.S.A. 106(9), 2995–2999 (2009). 10.1073/pnas.0900245106 [DOI] [PMC free article] [PubMed] [Google Scholar]
- 10.Greengard A., Schechner Y. Y., Piestun R., “Depth from diffracted rotation,” Opt. Lett. 31(2), 181–183 (2006). 10.1364/OL.31.000181 [DOI] [PubMed] [Google Scholar]
- 11.Pavani S. R. P., Greengard A., Piestun R., “Three-dimensional localization with nanometer accuracy using a detector-limited double-helix point spread function system,” Appl. Phys. Lett. 95(2), 021103 (2009). 10.1063/1.3158923 [DOI] [Google Scholar]
- 12.Pavani S. R. P., Piestun R., “Three dimensional tracking of fluorescent microparticles using a photon-limited double-helix response system,” Opt. Express 16(26), 22048–22057 (2008). 10.1364/OE.16.022048 [DOI] [PubMed] [Google Scholar]
- 13.Thompson M. A., Casolari J. M., Badieirostami M., Brown P. O., Moerner W. E., “Three-dimensional tracking of single mRNA particles in Saccharomyces cerevisiae using a double-helix point spread function,” Proc. Natl. Acad. Sci. U.S.A. 107(42), 17864–17871 (2010). 10.1073/pnas.1012868107 [DOI] [PMC free article] [PubMed] [Google Scholar]
- 14.Thompson M. A., Lew M. D., Badieirostami M., Moerner W. E., “Localizing and tracking single nanoscale emitters in three dimensions with high spatiotemporal resolution using a double-helix point spread function,” Nano Lett. 10(1), 211–218 (2010). 10.1021/nl903295p [DOI] [PMC free article] [PubMed] [Google Scholar]
- 15.Pavani S. R. P., DeLuca J. G., Piestun R., “Polarization sensitive, three-dimensional, single-molecule imaging of cells with a double-helix system,” Opt. Express 17(22), 19644–19655 (2009). 10.1364/OE.17.019644 [DOI] [PubMed] [Google Scholar]
- 16.Grover G., Pavani S. R. P., Piestun R., “Performance limits on three-dimensional particle localization in photon-limited microscopy,” Opt. Lett. 35(19), 3306–3308 (2010). 10.1364/OL.35.003306 [DOI] [PubMed] [Google Scholar]
- 17.Badieirostami M., Lew M. D., Thompson M. A., Moerner W. E., “Three-dimensional localization precision of the double-helix point spread function versus astigmatism and biplane,” Appl. Phys. Lett. 97(16), 161103 (2010). 10.1063/1.3499652 [DOI] [PMC free article] [PubMed] [Google Scholar]
- 18.Speidel M., Jonás A., Florin E.-L., “Three-dimensional tracking of fluorescent nanoparticles with subnanometer precision by use of off-focus imaging,” Opt. Lett. 28(2), 69–71 (2003). 10.1364/OL.28.000069 [DOI] [PubMed] [Google Scholar]
- 19.Kao H. P., Verkman A. S., “Tracking of single fluorescent particles in three dimensions: use of cylindrical optics to encode particle position,” Biophys. J. 67(3), 1291–1300 (1994). 10.1016/S0006-3495(94)80601-0 [DOI] [PMC free article] [PubMed] [Google Scholar]
- 20.Holtzer L., Meckel T., Schmidt T., “Nanometric three-dimensional tracking of individual quantum dots in cells,” Appl. Phys. Lett. 90(5), 053902 (2007). 10.1063/1.2437066 [DOI] [Google Scholar]
- 21.von Middendorff C., Egner A., Geisler C., Hell S. W., Schönle A., “Isotropic 3D Nanoscopy based on single emitter switching,” Opt. Express 16(25), 20774–20788 (2008). 10.1364/OE.16.020774 [DOI] [PubMed] [Google Scholar]
- 22.Mlodzianoski M. J., Juette M. F., Beane G. L., Bewersdorf J., “Experimental characterization of 3D localization techniques for particle-tracking and super-resolution microscopy,” Opt. Express 17(10), 8264–8277 (2009). 10.1364/OE.17.008264 [DOI] [PubMed] [Google Scholar]
- 23.Ram S., Chao J., Prabhat P., Ward E. S., Ober R. J., ““A novel approach to determining the three-dimensional location of microscopic objects with applications to 3D particle tracking,” Proc. SPIE 6443, 64430D–, 64430D-7. (2007). 10.1117/12.698763 [DOI] [Google Scholar]
- 24.Ram S., Prabhat P., Chao J., Ward E. S., Ober R. J., “High accuracy 3D quantum dot tracking with multifocal plane microscopy for the study of fast intracellular dynamics in live cells,” Biophys. J. 95(12), 6025–6043 (2008). 10.1529/biophysj.108.140392 [DOI] [PMC free article] [PubMed] [Google Scholar]
- 25.Pavani S. R. P., Piestun R., “High-efficiency rotating point spread functions,” Opt. Express 16(5), 3484–3489 (2008). 10.1364/OE.16.003484 [DOI] [PubMed] [Google Scholar]
- 26.Thompson R. E., Larson D. R., Webb W. W., “Precise nanometer localization analysis for individual fluorescent probes,” Biophys. J. 82(5), 2775–2783 (2002). 10.1016/S0006-3495(02)75618-X [DOI] [PMC free article] [PubMed] [Google Scholar]
- 27.Piestun R., Schechner Y. Y., Shamir J., “Propagation-invariant wave fields with finite energy,” J. Opt. Soc. Am. A 17(2), 294–303 (2000). 10.1364/JOSAA.17.000294 [DOI] [PubMed] [Google Scholar]
- 28.Piestun R., Spektor B., Shamir J., “Wave fields in three dimensions: analysis and synthesis,” J. Opt. Soc. Am. A 13(9), 1837–1848 (1996). 10.1364/JOSAA.13.001837 [DOI] [Google Scholar]
- 29.S. Quirin, S. R. P. Pavani, and R. Piestun, “Pattern matching estimator for precise 3-D particle localization with engineered point spread functions,” in Digital Holography and Three-Dimensional Imaging, OSA Technical Digest (CD) (Optical Society of America, 2010), paper DMC3. [Google Scholar]
- 30.MathWorks, “Product documentation,” (2011), Example 2—Analyzing Images, http://www.mathworks.com/help/toolbox/images/f0-8778.html