Abstract
An optical coherence tomography (OCT) for high axial resolution corneal imaging is presented. The system uses 375 nm bandwidth (625 to 1000 nm) from a broadband supercontinuum light source. The system was developed in free space to minimize image quality degradation due to dispersion. A custom-designed spectrometer based on a Czerny Turner configuration was implemented to achieve an imaging depth of 1 mm. Experimentally measured axial resolution was 1.1 μm in corneal tissue and had a good agreement with the theoretically calculated resolution from the envelope of the spectral interference fringes. In vivo imaging was carried out and thin corneal layers such as the tear film and the Bowman’s layer were quantified in normal, keratoconus, and contact lens wearing eyes, indicating the system’s suitability for several ophthalmic applications.
OCIS codes: (170.4500) Optical coherence tomography, (170.4460) Ophthalmic optics and devices, (170.0110) Imaging systems
1. Introduction
Optical coherence tomography (OCT) is a leading biomedical imaging modality capable of generating images of living biological tissue in vivo at high resolution [1,2]. OCT has been widely used in the area of ophthalmology, where it has become one of the prominent diagnostic tools for both anterior and posterior segment of the eye [1,3–5]. Despite the benefits provided by OCT in studying eye diseases, origin and progression of many diseases are still difficult to investigate. This is due, in part, to the lack of axial resolution that enables us to objectively quantify certain structures in the eye. For the diseases pertaining to the cornea, there has been growing interest in visualizing individual corneal layers such as the tear film, the Bowman’s layer, and the Descemet’s membrane. However, the thickness of these layers can be as thin as 3–15 μm [6], which makes it difficult to image them reliably in vivo. In vivo confocal microscopy offers optical sectioning capability at cellular level resolution [7,8]. Mostly though, its limited field of view, resulting from high image magnification, makes it difficult to acquire wide area corneal images. Although OCT can overcome this limitation at the cost of lateral resolution, standard anterior segment OCT systems do not have sufficient axial resolution to precisely quantify the thickness of all the individual corneal layers. Hence, it has been increasingly important to further improve the axial resolution of the OCT for these applications.
With the advances in broadband light sources, images with axial resolution of a few microns have been obtained using OCT for both the posterior segment [9,10] and the anterior segment [11] of the eye. The high resolution anterior segment OCT can now directly visualize individual corneal layers like the Bowman’s layer and the Descemet’s membrane in vivo and has been used in studying the changes in these layers resulting from Fuch’s Dystrophy [12] and hypoxia induced corneal swelling [13]. OCT has also been used in indirect tear film thickness measurement [14,15]. The axial resolution of the OCT systems used in these studies was 3–4 μm, which is just two to five times smaller than the structures been studied [6]. This may cause an increase in measurement variability and errors. Moreover, it has not been possible to directly visualize the natural tear film over the human cornea that is estimated to be 2–5 μm by interferometric methods [16].
Our goal in this study is to develop a corneal OCT with one micrometer axial resolution, which could be used to quantify thickness profiles of the tear film and thin corneal layers in both normal and pathological corneas. The axial resolution of OCT is inversely proportional to the bandwidth and proportional to the square of the center wavelength of the light source [17]. Using small center wavelength for in vivo human eye imaging could be hazardous [18] and lead to patient discomfort, we hence used a broad bandwidth light (375 nm) from a supercontinuum source centered at 812.5 nm to achieve ultrahigh axial resolution. While sub-micrometer axial resolution in OCT systems has been achieved using broad bandwidth femtosecond or supercontinuum lasers with bandwidths larger than 350 nm [19–21], these systems were time domain systems. Fourier domain OCT systems [2,22] provide improved sensitivity and imaging speed compared to time domain systems [23–25]. Using bandwidths larger than 350 nm in Fourier domain systems however has been difficult and to the best of our knowledge has not been reported to date. The challenge is to design spectrometers having a large spectral range along with high spectral resolution required for acceptable imaging depth. To overcome this challenge, we used a spectrometer design based on a Czerny Turner configuration that has been proposed by our group [26]. System design and imaging performance of the proposed OCT will be discussed in detail in this paper and potential ophthalmic applications are presented.
2. System design
2.1. Spectrometer
The cornea is a curved surface with an average radius of curvature of 7.8 mm [27]. To image a 4 mm wide lateral section around the apex of the cornea, an imaging depth of at least 1 mm is required. The imaging depth of spectral domain OCT is directly proportional to the resolving power of the spectrometer. Thus, to achieve the required imaging depth, designing a spectrometer with high spectral resolution and wide spectral range is crucial. Czerny Turner spectrometers have been used for applications where high spectral resolution and large spectral range are required [28–30]. Benefits of this design are that it is corrected for coma while spherical aberration is minimized by keeping the numerical aperture low. Astigmatism however is left uncorrected. This design works well in a traditional spectrometer where slits are used since spot elongation caused by astigmatism occurs along the direction of the slit, resulting in negligible power loss. In our application, where a linescan camera is used, the power loss is substantial due to the small pixel size (5 × 5 μm2), leading to a reduction in signal to noise ratio. Recently, the design of a low cost spectrometer based on a Czerny Turner configuration has been demonstrated where astigmatism is corrected using a cylindrical lens placed before the detector [26]. An equivalent geometry spectrometer was designed and assembled for this study based on a different light source and detector.
The spectral resolution requirement of the spectrometer is given by the expression [9]
| (1) |
where d is the imaging depth, λ is the wavelength and δλ is the spectral resolution. The spectral resolution requirement, as calculated from Eq. (1), changes from 0.096 nm at 625 nm to 0.250 nm at 1000 nm for 1 mm imaging depth. Assuming the spectral resolution requirement to be 0.096 nm and the spectral range to be 375 nm, the spectral data must be sampled over at least 3907 points (i.e. 375 nm/0.096 nm). We hence used an 8160 pixel linescan camera (L803K, Basler), sampling the signal over all of its 8160 pixels. The system thus, should be limited by the spectral resolution obtained by the spectrometer optics.
Ray tracing software CODE V (Synopsys Inc) was used to evaluate the spectral resolution at five wavelengths (625 nm, 700 nm, 800 nm, 900 nm and 1000 nm) wherein the spectrometer is defined to have just two discrete wavelengths that are separated by the required spectral resolution at that wavelength and the PSF of the system was calculated. Figure 1 shows the PSFs obtained, while Fig. 2 shows the plot comparing the required spectral resolution obtained by Eq. (1) with the actual spectral resolution of the optics. Ideally the actual spectral resolution should be smaller than the required spectral resolution for all wavelengths. We note that the spectrometer meets the resolution requirement for all the wavelengths except around 600 nm. The lack of spectral resolution in some wavelength band at the extremity of the spectrum is equivalent to operating with a smaller bandwidth, which will lead to a reduction in the axial resolution. The system hence satisfies the criteria of imaging depth larger than 1 mm, though the effective bandwidth of the system is reduced to 300 nm at 1mm imaging depth, which yields a reduced axial resolution.
Fig. 1.

The spectrometer PSF for two wavelengths separated by the required spectral resolution calculated from Eq. (1) for (a) 625 nm (b) 700 nm (c) 800 nm (d) 900 nm (e) 1000 nm.
Fig. 2.
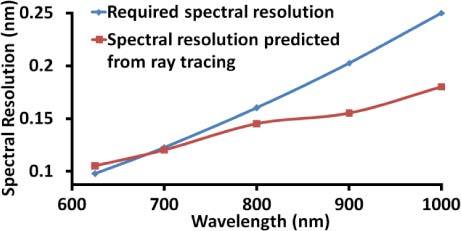
Spectral resolution predicted by ray tracing compared with the required spectral resolution. The spectral resolution requirement is satisfied by all wavelengths except between 625 nm and 690 nm.
2.2. Optical system layout
The OCT was built in free space to avoid reduction in axial resolution due to dispersion induced by the optical fiber [31–33] and because of the lack of a readily available fiber optic directional coupler for such a broad bandwidth light source.
Figure 3 shows the schematic of the OCT system. A near IR achromatic doublet lens (Thorlabs, focal length = 35 mm, diameter = 25.4 mm) collimates the beam from the supercontinuum source (Leukos, SM-20) and a bandpass filter, which is a combination of a long pass (Semrock, model # BLP01-561R-25) and a short pass filter (Omega Optical, model # 3RD1000SP), is used to select the spectrum from 625 nm to 1000 nm. The beam diameter was 6 mm and is controlled by an adjustable diaphragm. The beam is then split into the sample and reference arm by a 50/50 cube beamsplitter (Edmund Optics). In the sample arm, the beam is scanned on the sample in telecentric geometry using a galvanometer based optical scanner (Cambridge Technologies, model # 6220) and is focused by an objective lens (focal length = 60 mm, working distance = 56 mm, diameter = 25.4 mm) which has two achromatic doublets with focal lengths 100 mm and 150 mm (Thorlabs) separated by 5 mm. In the reference arm, an identical objective lens is used to focus the beam on the reference mirror in order to match the dispersion between the two arms. A variable neutral density filter (V-NDF) (Thorlabs) was placed in the reference arm to maximize the fringe visibility. To match dispersion, an identical V-NDF set at maximum transmission (OD = 0) was placed in the sample arm.
Fig. 3.
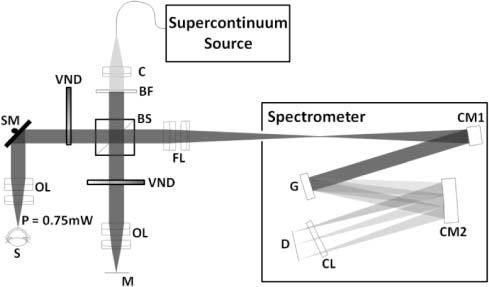
Full schematic of the OCT system. C, Collimator; BF, Bandpass filter; BS, Beamsplitter; VND, Variable neutral density filter; SM, Scanning mirror; OL, Objective lens; S, Sample; M, Reference mirror; FL, Focusing lens; CM1, First concave mirror; G, Linear grating; CM2, Second concave mirror; CL, Cylindrical lens; D, Linescan CCD.
Two beams traveling back from the sample and reference arms are focused to enter the spectrometer using the same lens as the objective. On entering the spectrometer the beam is collimated by a concave mirror (Edmund Optics, focal length = 200 mm and diameter = 50.8 mm). A diffraction grating (Richardson gratings, 500 grooves/mm) disperses the collimated beam into its wavelength components. These different wavelengths are then focused onto the linescan camera using another concave mirror identical to the first one and an astigmatism correcting cylindrical lens (Thorlabs, focal length = 100 mm). The raw data, through a frame grabber (Bitflow Inc., Karbon CL), is transferred to a workstation (Dell, Precision 7400).
2.3. k-space remapping and dispersion compensation
To accurately sample the OCT signal linearly in k-space, we calibrated the spectrometer experimentally. We first theoretically evaluated the positions of 41 different wavelengths between 600 nm and 1000 nm at 10 nm step on the linescan camera using CODE V. The positions of four different wavelengths (633 nm, 700 nm, 830 nm and 976 nm) were then measured on the linescan camera by placing laser line filters in the beam path. The theoretically obtained spectral positions were then linearly scaled and translated to match the experimentally measured positions to account for tolerances in components and alignment associated with building the system. The 41 data points were then interpolated to 8160 sample points, providing equispaced data sampling in k-space.
Although the dispersion between the reference and sample arm was matched by using identical optics in both the arms, for such a large bandwidth, even a small dispersion mismatch can cause reduction in system performance. Hence, numerical dispersion compensation [10] was implemented to achieve optimal performance.
3. System performance
3.1. Axial and lateral resolution and depth sensitivity
The axial resolution of the OCT system was estimated by replacing the sample with a flat mirror. To ensure that there is no degradation in the axial resolution due to errors in k-space remapping and dispersion mismatch, theoretical axial point spread function (PSF) was calculated as the Fourier transform of the envelope of the spectral interference fringes. Figure 4(a) shows the measured axial PSF at the axial distance of 0.16 mm in blue and the theoretical axial PSF in dashed red. The axial resolution, estimated as the full width at half maximum (FWHM) of the measured PSF, was 1.52 μm in air which corresponds to 1.11 μm in tissue (n = 1.376) [6]. The FWHM of the theoretical axial PSF was 1.45 μm in air and is in good agreement with that from the measured PSF, indicating that the system achieves optimal axial resolution. The lateral resolution of the OCT, defined as the focal spot size on the sample, was measured to be 25 μm on a CCD, which was 1.25 times the diffraction limited spot size of 20 μm.
Fig. 4.

(a) The axial PSF of the OCT measured experimentally by a mirror in the sample arm shown in blue, the PSF estimated theoretically from the envelope of spectral interference fringes shown in dashed red. The FWHM of the axial PSF is estimated to be 1.52 μm in air which corresponds to 1.11 μm in corneal tissue. (b) Sensitivity roll off of the system evaluated by measuring the axial PSF at different depths.
Figure 4(b) shows the axial PSF of the OCT system plotted at seven axial locations up to 1.1 mm. A 21 dB roll off in the sensitivity of OCT from 0.16 mm to 1 mm depth was observed. An axial resolution of 1.11 μm was maintained up to the depth of 0.32 mm beyond which it starts to degrade with depth and is estimated to be 3.0 μm in tissue at the depth of 1 mm. The degradation in sensitivity and axial resolution is due to limited spectral resolution of the spectrometer.
3.2. Validation of thickness measurements with the OCT
To validate the accuracy of the OCT system in estimating thickness, four reference samples (photoresist spin coated on top of a silica chip) with known thicknesses were fabricated. The refractive index and thickness of the samples were measured using an ellipsometer with refractive index estimated to be 1.61 and thicknesses values being 0.91 μm, 1.36 μm, 3.37 μm and 4.40 μm. The images obtained for the samples are shown in Fig. 5 . Since the thickness values are close to the axial resolution of the OCT, the images were obtained after zero padding the interference signal to reduce the pixel separation by five times. The two interfaces can be distinctively identified in all the samples except the 0.91 μm thick sample. The photoresist thicknesses measured by OCT were 1.25 ± 0.13 μm, 3.45 ± 0.05 μm and 4.58 ± 0.06 μm, obtained from five independent measures along the surface of the sample. The ellipsometry and the OCT measurements differ due to limited accuracy of the OCT measures (0.1 μm).
Fig. 5.
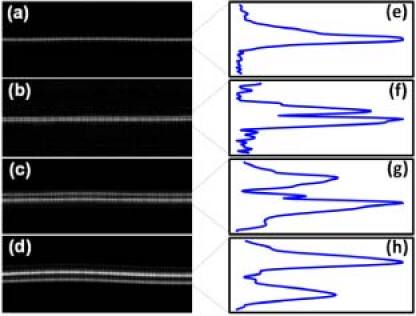
The images obtained for the photoresists (n = 1.6) of thickness (a) 0.91 μm (b) 1.36 μm (c) 3.37 μm and (d) 4.40 μm and the peaks for photoresist thickness of (e) 0.91 μm (f) 1.36 μm (g) 3.37 μm and (h) 4.40 μm.
3.3. Imaging the human cornea and ophthalmic applications
In vivo OCT imaging was performed on human corneas. The research adhered to the tenets of the Declaration of Helsinki. The protocol was approved by the Research Subjects Review Board at the University of Rochester. Informed consent was obtained from all participants after the purpose of the study and the procedures were explained. The power of the light shined into the subject’s eye was 0.75 mW, which is 80 times below the maximum permissible exposure as dictated by ANSI [29]. A bite bar was used to minimize the subject’s head motion. Each image consists of 250 A-scans. Exposure time for each A-scan was 1 ms and the real time frame rate obtained on the screen was 2 frames/s. Such a large exposure time is used because it is difficult to focus all the light coming from the sample arm of the OCT on to the linescan camera sensor (pixel size 5 × 5 μm2). Further improvement in the spectrometer design is required to improve the frame rate.
Figure 6 shows the image obtained by the system for a 4 mm section around the apex of a normal cornea. The thin topmost layer in the image is the tear layer whose mean thickness across the 4 mm section was measured to be 4.7 ± 1.6 μm. The next two layers, epithelium and Bowman's layer, had mean thicknesses of 49.7 ± 1.4 μm and 19.2 ± 1.2 μm, respectively. The Bowman's layer is followed by the stroma, which is made up of brightly reflecting centers that may be keratocytes. Below the stroma is the Descemet's membrane followed by the endothelium. The Descemet's membrane can be visualized as a thin strip in the lower portion of the cornea. The thickness of this layer was measured to be 4 ± 0.7 μm. The endothelium can be visualized as the last bright boundary of the cornea. In these thickness estimates, we assumed the refractive index of 1.401 for the epithelium [34] and an average corneal refractive index of 1.376 for Bowman's layer and Descemet’s membrane [6].
Fig. 6.
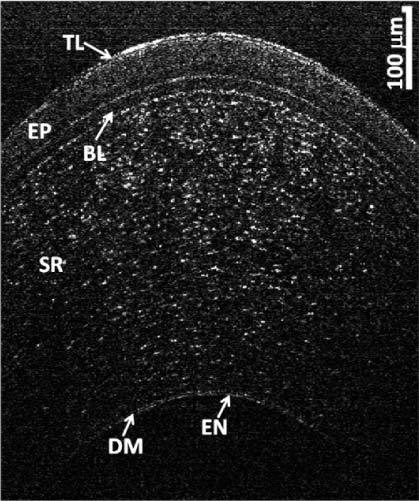
OCT image of the cornea of a normal patient. TL: Tear Layer, EP: Epithelium, BL: Bowman’s Layer, SR: Stroma, DM: Descemet’s Membrane, EN: Endothelium.
To demonstrate the capability of the OCT system in studying ocular pathologies we also imaged abnormal corneas.
3.3.1. Keratoconus
Keratoconus is a degenerative disorder of the eye that involves non-inflammatory thinning and steepening of the central and/or para-central cornea [35]. Although the exact cause of keratoconus is uncertain, the evidence suggests that the corneal epithelium and Bowman’s layer may be involved in the disease development [36–40].
Micrometer resolution OCT was used to image individual corneal layers of moderate and severe keratoconus patients as shown in Fig. 7(b) and (c) . A normal cornea (Fig. 7(a)) was also included for comparison. The center thickness, averaged over three repeated measurements on the same image, in normal cornea (464.7 ± 0.8 μm) was significantly larger than keratoconus corneas (moderate: 408.1 ± 1.8 μm and severe: 404.5 ± 0.4 μm) with it being smallest in severe case. A similar trend of decrease in thickness with severity of disease was observed for both the epithelium and the Bowman’s layer with successive reduction in mean epithelium thickness being observed from normal (49.7 ± 1.4 μm) to moderate (43.8 ± 2.2 μm) to severe (35.8 ± 11.7 μm) keratoconus and mean Bowman’s layer thickness being larger in normal cornea (19.2 ± 1.2 μm) than moderate keratoconus cornea (14.8 ± 1.2 μm). In severe keratoconus subject the Bowman’s layer could not be observed, indicating the potential destruction of the Bowman’s layer in this case.
Fig. 7.
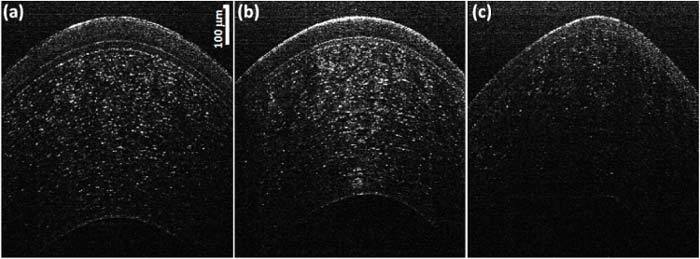
OCT images of (a) Normal (same image shown in Fig. 6), (b) moderate keratoconus (c) severe keratoconus.
Steepening of the cornea was observed with increased disease severity wherein the anterior corneal surface was flattest for normal cornea (Radius of curvature averaged over three measurements on the same image or R = 10.5 ± 0.3 mm) and the steepness increasing from moderate (R = 8.3 ± 0.2 mm) to severe keratoconus cornea (R = 7.4 ± 0.2 mm). A significant increase in the amount of light backscattered from the Bowman’s layer can be observed in a moderately keratoconus cornea when compared with a normal cornea.
3.3.2. Tear Layers associated with soft contact lens
It has been estimated that more than half of the contact lens wearers experience ocular dryness and discomfort [41,42]. Pre lens tear film (PLTF) and post lens tear film (PoLTF) play a vital role in maintaining safe and comfortable contact lens usage [43–47]. Therefore to better understand the safety and comfort of contact lenses, determining the thickness of PLTF and PoLTF is crucial. Figure 8(a) shows the image taken immediately after instilling the tear drop on the subject who was wearing the contact lens for three minutes. Figures 8(b) and (c) show the zoom-in view of the PLTF and PoLTF, respectively wherein the two interfaces can be visualized in both cases. The average thickness of PLTF and PoLTF were calculated to be 6.8 ± 1.1 μm and 2.9 ± 1.2 μm, respectively.
Fig. 8.
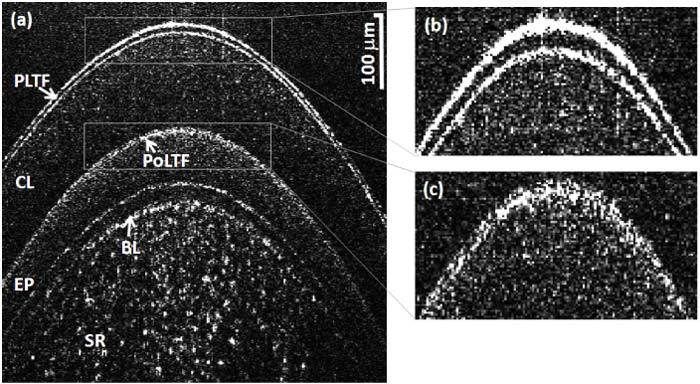
(a) Image of the contact lens wearer's cornea immediately after instilling a tear drop, where the subject was wearing the contact lens for three minutes. (b) Zoom-in view of the PLTF: two interfaces can be clearly visualized. (c) Zoom-in view of the PoLTF: two interfaces are distinguishable.
4. Conclusions
This study demonstrates a micrometer-resolution spectral domain OCT with a custom developed astigmatism corrected spectrometer based on Czerny Turner design. The axial resolution of 1.11 μm in corneal tissue was achieved with the thickness measurement accuracy verified using photoresist layer samples. In vivo human corneal imaging was carried out that indicates the feasibility of quantifying the thickness of the individual corneal layers including the tear film, the Bowman’s layer, the Descemet’s membrane and the epithelium. Micrometer resolution OCT can be a powerful tool enabling us to improve our knowledge of the etiology and progression of corneal and ocular surface diseases.
Acknowledgments
We would like to acknowledge Chris Streimer and Amrita Yadav for providing us with the photoresist samples. This research was supported by grants from NIH/NEI 5R01EY014999, Research to Prevent Blindness, NYSTAR/Bausch and Lomb, and the NYSTAR Foundation C050070.
References and links
- 1.Huang D., Swanson E. A., Lin C. P., Schuman J. S., Stinson W. G., Chang W., Hee M. R., Flotte T., Gregory K., Puliafito C. A., Fujimoto J. G., “Optical coherence tomography,” Science 254(5035), 1178–1181 (1991). 10.1126/science.1957169 [DOI] [PMC free article] [PubMed] [Google Scholar]
- 2.Fercher A. F., Hitzenberger C. K., Kamp G., Elzaiat S. Y., “Measurement of intraocular distances by backscattering spectral interferometry,” Opt. Commun. 117(1-2), 43–48 (1995). 10.1016/0030-4018(95)00119-S [DOI] [Google Scholar]
- 3.Hee M. R., Izatt J. A., Swanson E. A., Huang D., Schuman J. S., Lin C. P., Puliafito C. A., Fujimoto J. G., “Optical coherence tomography of the human retina,” Arch. Ophthalmol. 113(3), 325–332 (1995). [DOI] [PubMed] [Google Scholar]
- 4.Izatt J. A., Hee M. R., Swanson E. A., Lin C. P., Huang D., Schuman J. S., Puliafito C. A., Fujimoto J. G., “Micrometer-scale resolution imaging of the anterior eye in vivo with optical coherence tomography,” Arch. Ophthalmol. 112(12), 1584–1589 (1994). [DOI] [PubMed] [Google Scholar]
- 5.Kałusny J. J., Wojtkowski M., Kowalczyk A., “Imaging of the anterior segment of the eye by spectra optical coherence tomography,” Opt. Appl. 32, 581–589 (2002). [Google Scholar]
- 6.D. A. Atchison and J. Smith, Optics of the Human Eye (Elsevier, 2002). [Google Scholar]
- 7.Jalbert I., Stapleton F., Papas E., Sweeney D. F., Coroneo M., “In vivo confocal microscopy of the human cornea,” Br. J. Ophthalmol. 87(2), 225–236 (2003). 10.1136/bjo.87.2.225 [DOI] [PMC free article] [PubMed] [Google Scholar]
- 8.Niederer R. L., Perumal D., Sherwin T., McGhee C. N. J., “Laser scanning in vivo confocal microscopy reveals reduced innervation and reduction in cell density in all layers of the keratoconic cornea,” Invest. Ophthalmol. Vis. Sci. 49(7), 2964–2970 (2008). 10.1167/iovs.07-0968 [DOI] [PubMed] [Google Scholar]
- 9.Leitgeb R., Drexler W., Unterhuber A., Hermann B., Bajraszewski T., Le T., Stingl A., Fercher A., “Ultrahigh resolution Fourier domain optical coherence tomography,” Opt. Express 12(10), 2156–2165 (2004). 10.1364/OPEX.12.002156 [DOI] [PubMed] [Google Scholar]
- 10.Wojtkowski M., Srinivasan V., Ko T., Fujimoto J., Kowalczyk A., Duker J., “Ultrahigh-resolution, high-speed, Fourier domain optical coherence tomography and methods for dispersion compensation,” Opt. Express 12(11), 2404–2422 (2004). 10.1364/OPEX.12.002404 [DOI] [PubMed] [Google Scholar]
- 11.Christopoulos V., Kagemann L., Wollstein G., Ishikawa H., Gabriele M. L., Wojtkowski M., Srinivasan V., Fujimoto J. G., Duker J. S., Dhaliwal D. K., Schuman J. S., “In vivo corneal high-speed, ultra high-resolution optical coherence tomography,” Arch. Ophthalmol. 125(8), 1027–1035 (2007). 10.1001/archopht.125.8.1027 [DOI] [PMC free article] [PubMed] [Google Scholar]
- 12.Shousha M. A., Perez V. L., Wang J., Ide T., Jiao S., Chen Q., Chang V., Buchser N., Dubovy S. R., Feuer W., Yoo S. H., “Use of ultra-high-resolution optical coherence tomography to detect in vivo characteristics of Descemet’s membrane in Fuchs’ dystrophy,” Ophthalmology 117(6), 1220–1227 (2010). 10.1016/j.ophtha.2009.10.027 [DOI] [PMC free article] [PubMed] [Google Scholar]
- 13.Hutchings N., Simpson T. L., Hyun C., Moayed A. A., Hariri S., Sorbara L., Bizheva K., “Swelling of the human cornea revealed by high-speed, ultrahigh-resolution optical coherence tomography,” Invest. Ophthalmol. Vis. Sci. 51(9), 4579–4584 (2010). 10.1167/iovs.09-4676 [DOI] [PubMed] [Google Scholar]
- 14.Wang J., Fonn D., Simpson T. L., Jones L., “Precorneal and pre- and postlens tear film thickness measured indirectly with optical coherence tomography,” Invest. Ophthalmol. Vis. Sci. 44(6), 2524–2528 (2003). 10.1167/iovs.02-0731 [DOI] [PubMed] [Google Scholar]
- 15.Chen Q., Wang J., Tao A., Shen M., Jiao S., Lu F., “Ultrahigh-resolution measurement by optical coherence tomography of dynamic tear film changes on contact lenses,” Invest. Ophthalmol. Vis. Sci. 51(4), 1988–1993 (2010). 10.1167/iovs.09-4389 [DOI] [PMC free article] [PubMed] [Google Scholar]
- 16.King-Smith P. E., Fink B. A., Hill R. M., Koelling K. W., Tiffany J. M., “The thickness of the tear film,” Curr. Eye Res. 29(4-5), 357–368 (2004). 10.1080/02713680490516099 [DOI] [PubMed] [Google Scholar]
- 17.Drexler W., “Ultrahigh-resolution optical coherence tomography,” J. Biomed. Opt. 9(1), 47–74 (2004). 10.1117/1.1629679 [DOI] [PubMed] [Google Scholar]
- 18.American National Standards Institute, “American national standard for safe use of lasers,” ANSI Z136.1-2007 (2007).
- 19.Drexler W., Morgner U., Kärtner F. X., Pitris C., Boppart S. A., Li X. D., Ippen E. P., Fujimoto J. G., “In vivo ultrahigh-resolution optical coherence tomography,” Opt. Lett. 24(17), 1221–1223 (1999). 10.1364/OL.24.001221 [DOI] [PubMed] [Google Scholar]
- 20.Povazay B., Bizheva K., Unterhuber A., Hermann B., Sattmann H., Fercher A. F., Drexler W., Apolonski A., Wadsworth W. J., Knight J. C., Russell P. S. J., Vetterlein M., Scherzer E., “Submicrometer axial resolution optical coherence tomography,” Opt. Lett. 27(20), 1800–1802 (2002). 10.1364/OL.27.001800 [DOI] [PubMed] [Google Scholar]
- 21.Wang Y., Zhao Y., Nelson J. S., Chen Z., Windeler R. S., “Ultrahigh-resolution optical coherence tomography by broadband continuum generation from a photonic crystal fiber,” Opt. Lett. 28(3), 182–184 (2003). 10.1364/OL.28.000182 [DOI] [PubMed] [Google Scholar]
- 22.Häusler G., Linduer M. W., “Coherence radar and spectral radar-new tools for dermatological diagnosis,” J. Biomed. Opt. 3(1), 21–31 (1998). 10.1117/1.429899 [DOI] [PubMed] [Google Scholar]
- 23.Leitgeb R., Hitzenberger C. K., Fercher A. F., “Performance of fourier domain vs. time domain optical coherence tomography,” Opt. Express 11(8), 889–894 (2003). 10.1364/OE.11.000889 [DOI] [PubMed] [Google Scholar]
- 24.de Boer J. F., Cense B., Park B. H., Pierce M. C., Tearney G. J., Bouma B. E., “Improved signal-to-noise ratio in spectral-domain compared with time-domain optical coherence tomography,” Opt. Lett. 28(21), 2067–2069 (2003). 10.1364/OL.28.002067 [DOI] [PubMed] [Google Scholar]
- 25.Choma M. A., Sarunic M. V., Yang C. H., Izatt J. A., “Sensitivity advantage of swept source and Fourier domain optical coherence tomography,” Opt. Express 11(18), 2183–2189 (2003). 10.1364/OE.11.002183 [DOI] [PubMed] [Google Scholar]
- 26.Lee K. S., Thompson K. P., Rolland J. P., “Broadband astigmatism-corrected Czerny-Turner spectrometer,” Opt. Express 18(22), 23378–23384 (2010). 10.1364/OE.18.023378 [DOI] [PubMed] [Google Scholar]
- 27.B. Rabbetts, Bennett & Rabbetts’ Clinical Visual Optics (Elsevier 2007).
- 28.Czerny M., Turner A. F., “Über den Astigmatismus bei Spiegelspektrometern,” Z. Phys. 61, 792–797 (1930). 10.1007/BF01340206 [DOI] [Google Scholar]
- 29.Shafer B., Megill L. R., Droppleman L., “Optimization of the Czerny-Turner spectrometer,” J. Opt. Soc. Am. 54(7), 879–887 (1964). 10.1364/JOSA.54.000879 [DOI] [Google Scholar]
- 30.Xue Q., Wang S., Lu F., “Aberration-corrected Czerny-Turner imaging spectrometer with a wide spectral region,” Appl. Opt. 48(1), 11–16 (2009). 10.1364/AO.48.000011 [DOI] [PubMed] [Google Scholar]
- 31.Drexler W., Hitzenberger C. K., Baumgartner A., Findl O., Sattmann H., Fercher A. F., “Investigation of dispersion effects in ocular media by multiple wavelength partial coherence interferometry,” Exp. Eye Res. 66(1), 25–33 (1998). 10.1006/exer.1997.0401 [DOI] [PubMed] [Google Scholar]
- 32.Hitzenberger C. K., Baumgartner A., Fercher A. F., “Dispersion induced multiple signal peak splitting in partial coherence interferometry,” Opt. Commun. 154(4), 179–185 (1998). 10.1016/S0030-4018(98)00280-6 [DOI] [Google Scholar]
- 33.Hitzenberger C. K., Baumgartner A., Drexler W., Fercher A. F., “Dispersion effects in partial coherence interferometry: implications for intraocular ranging,” J. Biomed. Opt. 4(1), 144–151 (1999). 10.1117/1.429900 [DOI] [PubMed] [Google Scholar]
- 34.Patel S., Marshall J., Fitzke F. W., 3rd, “Refractive index of the human corneal epithelium and stroma,” J. Refract. Surg. 11(2), 100–105 (1995). [DOI] [PubMed] [Google Scholar]
- 35.Krachmer J. H., Feder R. S., Belin M. W., “Keratoconus and related noninflammatory corneal thinning disorders,” Surv. Ophthalmol. 28(4), 293–322 (1984). 10.1016/0039-6257(84)90094-8 [DOI] [PubMed] [Google Scholar]
- 36.Kim W. J., Rabinowitz Y. S., Meisler D. M., Wilson S. E., “Keratocyte apoptosis associated with keratoconus,” Exp. Eye Res. 69(5), 475–481 (1999). 10.1006/exer.1999.0719 [DOI] [PubMed] [Google Scholar]
- 37.Coyle J. T., “Keratoconus and eye rubbing,” Am. J. Ophthalmol. 97(4), 527–528 (1984). [DOI] [PubMed] [Google Scholar]
- 38.Macsai M. S., Varley G. A., Krachmer J. H., “Development of keratoconus after contact lens wear. patient characteristics,” Arch. Ophthalmol. 108(4), 534–538 (1990). [DOI] [PubMed] [Google Scholar]
- 39.Rahi A., Davies P., Ruben M., Lobascher D., Menon J., “Keratoconus and coexisting atopic disease,” Br. J. Ophthalmol. 61(12), 761–764 (1977). 10.1136/bjo.61.12.761 [DOI] [PMC free article] [PubMed] [Google Scholar]
- 40.Harrison R. J., Klouda P. T., Easty D. L., Manku M., Charles J., Stewart C. M., “Association between keratoconus and atopy,” Br. J. Ophthalmol. 73(10), 816–822 (1989). 10.1136/bjo.73.10.816 [DOI] [PMC free article] [PubMed] [Google Scholar]
- 41.Caffery B. E., Richter D., Simpson T., Fonn D., Doughty M., Gordon K., “The prevalence of dry eye in contact lens wearers: part 2 of the Canadian Dry Eye Epidemiology study,” Invest. Ophthalmol. Vis. Sci. 37, S72 (1996). [Google Scholar]
- 42.Doughty M. J., Fonn D., Richter D., Simpson T., Caffery B., Gordon K., “A patient questionnaire approach to estimating the prevalence of dry eye symptoms in patients presenting to optometric practices across Canada,” Optom. Vis. Sci. 74(8), 624–631 (1997). 10.1097/00006324-199708000-00023 [DOI] [PubMed] [Google Scholar]
- 43.Timberlake G. T., Doane M. G., Bertera J. H., “Short-term, low-contrast visual acuity reduction associated with in vivo contact lens drying,” Optom. Vis. Sci. 69(10), 755–760 (1992). 10.1097/00006324-199210000-00002 [DOI] [PubMed] [Google Scholar]
- 44.Tutt R., Bradley A., Begley C., Thibos L. N., “Optical and visual impact of tear break-up in human eyes,” Invest. Ophthalmol. Vis. Sci. 41(13), 4117–4123 (2000). [PubMed] [Google Scholar]
- 45.Hayashi T., Fatt I., “A lubrication theory model of tear exchange under a soft contact lens,” Am. J. Optom. Physiol. Opt. 53(3), 101–103 (1976). [DOI] [PubMed] [Google Scholar]
- 46.Wagner L., Polse K., Mandell R., “Tear pumping and edema with soft contact lenses,” Invest. Ophthalmol. Vis. Sci. 19(11), 1397–1400 (1980). [PubMed] [Google Scholar]
- 47.Little S. A., Bruce A. S., “Postlens tear film morphology, lens movement and symptoms in hydrogel lens wearers,” Ophthalmic Physiol. Opt. 14(1), 65–69 (1994). 10.1111/j.1475-1313.1994.tb00559.x [DOI] [PubMed] [Google Scholar]


