Abstract
We present a novel non-invasive and non-contact system for reflex-free retinal imaging and dynamic retinal vessel analysis in the rat. Theoretical analysis was performed prior to development of the new optical design, taking into account the optical properties of the rat eye and its specific illumination and imaging requirements. A novel optical model of the rat eye was developed for use with standard optical design software, facilitating both sequential and non-sequential modes. A retinal camera for the rat was constructed using standard optical and mechanical components. The addition of a customized illumination unit and existing standard software enabled dynamic vessel analysis. Seven-minute in-vivo vessel diameter recordings performed on 9 Brown-Norway rats showed stable readings. On average, the coefficient of variation was (1.1 ± 0.19) % for the arteries and (0.6 ± 0.08) % for the veins. The slope of the linear regression analysis was (0.56 ± 0.26) % for the arteries and (0.15 ± 0.27) % for the veins. In conclusion, the device can be used in basic studies of retinal vessel behavior.
OCIS codes: (330.4460) Ophthalmic optics and devices; (170.2945) Illumination design; (170.0110) Imaging systems; (170.2655) Functional monitoring and imaging; (170.3880) Medical and biological imaging; (330.7325) Visual optics, metrology
1. Introduction
Impairment of the microcirculation is involved in the pathogenesis of various eye diseases, including glaucoma, diabetic retinopathy, vessel occlusion, and age-related macular degeneration, as well as in systemic disorders such as diabetes mellitus and cardiovascular diseases. In humans, non-invasive static retinal vessel analysis is long established and the correlations between retinal vessel diameter and systemic diseases (e.g., diabetes and arterial hypertension) are well demonstrated. A more recently developed method is dynamic analysis of retinal vessel diameter; i.e., analysis of the response of the retinal vasculature to changes in retinal metabolism and neuronal activity. In this context, previous studies have reported correlations with ocular diseases as well as the risk factors for systemic pathologies due to changes in the microvasculature (e.g., risk of suffering cardiac events, cerebral stroke, dementia) [1–4].
The Retinal Vessel Analyzer (RVA, Imedos Systems UG, Jena, Germany) is a system for retinal imaging, and static and dynamic vessel analysis in human eyes [5]. Retinal imaging systems enable inspection of the eye fundus and high-resolution documentation of retinal and choroidal structures and changes, and can be used with fluorescence techniques. In static vessel analysis, parameters estimated from vessel diameter measurements obtained from single images in standardized procedures describe the stationary and morphological state of retinal vessels. In dynamic vessel analysis, the diameter of retinal vessel segments is measured as a function of time, and by stimulating or provoking retinal microcirculation, vessel function and microvascular autoregulation mechanisms can be investigated or diagnosed [6–14].
However, little is known of the basic pathology of these diseases and how their basic mechanisms are translated into dysfunction of the retinal vessels. Animal models offer a higher degree of freedom in experimental design and in interventions under controlled conditions, which allows a more thorough understanding of the correlation between retinal vessel dysfunction and the pathological mechanisms of the diseases that the dysfunctions are associated with. For example, most of the pharmacological and molecular interventions that could be used in such investigations are not applicable to humans and most molecular methods are simply not allowed for human use. As a consequence, animal research offers the only possibility to study the pathomechanisms of the major diseases mentioned above and their correlation to retinal vascular function, which in turn may lead to new treatments for diabetic retinopathy, age-related macular degeneration, and glaucoma, among others. The analysis of retinal vascular function may also offer new insight into the interpretation of health risks due to systemic vascular/metabolic diseases.
Rats are commonly used for in-vivo investigations, and numerous rat models are available for studying both ocular and cardiovascular diseases [15–17]. Therefore, the aim of the present work was to develop an imaging device suitable for microvascular investigation by dynamic retinal vessel analysis of animal eyes as small as those of the rat.
Non-contact optical imaging is an essential requirement for studying retinal microcirculation. The application of pressure to the eye and the introduction of barriers to oxygen diffusion (e.g. contact lenses) through the cornea have a crucial influence on the physiological and pathophysiological balance of retinal vascular function [18–20]. Thus, contact retina cameras previously utilized in animal experiments [21–24] are inappropriate for studying dynamic physiological and pathophysiological processes under conditions close to reality. Other setups for retina imaging and documentation use auxiliary aspheric lenses in combination with retina cameras [25] or slit lamps [26] that show inhomogeneous fundus illumination and low-contrast imaging, respectively. In fluorescence angiography, in which different wavelengths are used for illumination and imaging, the images are not affected by superimposed reflexes [27]. Recent works show classical fundus imaging in combination with high-resolution techniques such as optical coherence tomography to image different layers of the inner and outer retina [28] or demonstrate wavefront-sensing combined with adaptive optics to image ganglion cells or single cones e.g. in mice [29].
The first requirement of the present study was to match the retina camera system to the rat eye, using the principle of indirect ophthalmoscopy. Functionally, two separate optical paths are required: one for fundus illumination and another for imaging. To understand the optical system, it was necessary to understand image formation in both contact and non-contact fundus cameras, an overview of which is provided in [30]. The highest priority in the design of fundus cameras is the stop design [30,31]; while the secondary design criterion is to correct aberrations; e.g., in the aerial image produced by the ophthalmoscopic lens. We combined the most important system-design requirements for the rat eye according to image formation theory in indirect ophthalmoscopy, using currently available techniques for retinal vessel analysis in the human eye. Design of the illumination and imaging optics of the retina camera, using standard optical-design software, was the final step in realizing the experimental setup for dynamic retinal vessel analysis in rats (DVA-R).
2. Materials and methods
2.1 DVA-R setup
A schematic of the complete DVA-R setup is shown in Fig. 1 . The DVA-R is comprised of a retina camera adapted to the rat eye (RC-R), an illumination unit (IU), and a DVA platform also used for human DVA [5]. The novel retina camera contains optics for illumination and imaging. The DVA platform includes a PC with standard DVA software (DVA, Release 4.16, Imedos Systems UG, Jena, Germany) and a charge-coupled device (CCD) placed in the imaging path. The DVA platform is employed for image and data acquisition, storage, diameter measurements, and CCD control. The DVA captures the optical images at a frame rate of 25 fps, providing an active pixel area of 6.4 mm × 4.8 mm at a resolution of 752 × 582 pixels.
Fig. 1.
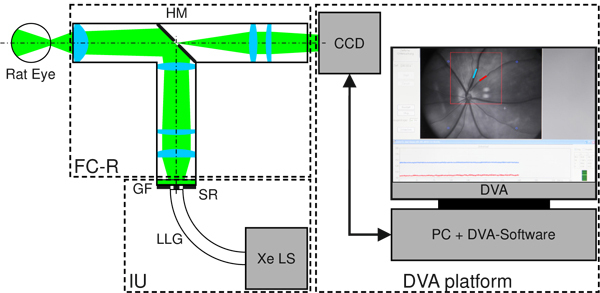
Schematic of retinal vessel analysis in the rat eye utilizing DVA-R. The DVA-R consists of a retina camera adapted to the rat eye (RC-R), an illumination unit (IU) and the standard DVA platform including PC, DVA software, CCD, and CCD control. The RC-R contains the optics for both illumination and imaging geometrically separated by a hole mirror (HM). The IU is comprised of a Xe light source (Xe LS), a liquid light guide (LLG), and a ring stop representing the source ring (SR). The broadband Xe spectrum is filtered with a green filter (GF).
The illumination unit (IU) comprises a Xe light source (Xe LS) (Spotlight 5000, Eurosep Instruments, Cergy St Christophe, France), a liquid light guide (LLG) (diameter 8 mm, length 1500 mm) (Fluid LL Series 380, Lumatec GmbH, Deisenhofen, Germany) for light delivery to the retina camera optics, and a customized ring stop (POG Präzisionsoptik Gera GmbH, Gera, Germany) at the output face of the light guide representing the source ring (SR) for the illumination path. The green DVA filter (GF) was used to ensure good vessel contrast, in accordance with [5].
2.2 Optical system design
Standard software was used for optical system design and analysis (ZEMAX®, Radiant ZEMAX LLC, Release: ZEMAX_2011-02-14_x64, WA, USA). The sequential (SC) mode of ZEMAX was used for paraxial and lens design, and the optical paths for illumination and imaging were designed separately. Realistic light-source ray tracing of the total system was performed in the non-sequential (NSC) mode to check light distributions at the hole mirror and at the eye.
2.3 Stop design
As previously described [30,32], in fundus cameras the retina is illuminated by formation of an annular light distribution (ring) in the anterior eye (cornea, anterior chamber, anatomic pupil). The maximum extent of the imaging bundle in the corneal plane is also referred to as the corneal window (CW), and includes all rays that diverge from the maximum field angle [30]. Any interference with the illumination bundle must be avoided in this area.
A particular type of ray aberration in optical systems is associated with marginal ray height. Thus, smaller pupils might evoke better performances down to diffraction-limited systems. To determine CW in the rat eye, we developed a new reduced schematic rat eye (rSRE) based on the 1979 model of Hughes [33] (HSRE). While having identical geometric properties in the anterior eye (cornea and anterior lens), the total refractive power of rSRE is slightly less than that of Hughes´ model. For optimization, the reciprocal of the refractive power (effective focal length, EFFL) was used in the ZEMAX merit function editor (MFE). The new model in ZEMAX was used to calculate on-axis modulation transfer functions (MTFs) at different pupil diameters at the wavelength of 560 nm to suggest an imaging aperture diameter and to define the corneal window. Compared with HSRE, the new eye model is suitable for sequential ray tracing and analysis for field heights of at least a 16° half-angle at a pupil diameter of 1 mm.
2.4 Optical system design requirements
Here, the essential requirements for optical system design are defined. As mentioned above, for investigating the retinal microcirculation, a non-contact system is required. We chose a working distance of approximately 15 mm for practicability. An imaging path front focal length of “−∞” was used for planning fundus imaging and DVA in mydriatic eyes (relaxed eyes). As a compromise between lumen throughput and image quality, affected by optical aberrations and/or diffraction a pupil diameter of 1 mm was adopted as the imaging aperture. To enable high-contrast and reflex-free fundus imaging matched to the rat eye, the CW condition must be considered when designing the optical paths for illumination and imaging. The two paths were connected using a customized hole mirror as an opto-geometric interface, tilted by 45° to form a T-shaped system. For DVA [5] the imaging field-of-view (FOV) was set to 30°, with another 2° added to adjust for marginal losses over the full field of illumination (FOI). Considering the active pixel area of the CCD, image size was set to a diameter of 7 mm. The system wavelength for design of the illumination and imaging paths was set as monochromatic (560 nm) to take into account the DVA green filter transmission. The maximum diameter was 25 mm for all system elements, including lenses and stops, to enable the setup to be constructed using standard components. Consequently, a maximum effective intermediate image size of approximately 17.5 mm normal to the optical axis could be used for the tilted mirror at 45°.
2.5 Paraxial approach
The paraxial approach was necessary to determine the parameters of stop size, stop position, and lens distance. First, the unfolded paraxial illumination path was designed, in the reverse direction. The pupil ring geometry was defined with respect to the total lateral magnification deduced from the physical size of the source ring. The pupil ring was imaged into the source ring plane using an ophthalmoscopic lens, a hole mirror for changing the path direction, a field lens, and additional lenses. The default ZEMAX merit function was used with additional magnification operands to control the image size at the source ring and to control the intermediate image size at the hole mirror.
Second, the paraxial imaging path was designed. With the fundus as object at infinity, the diameter of the imaging aperture was set to 1 mm. Before the hole mirror, the optical elements and distances were the same as those in the illumination path. After the hole mirror, the aperture stop for CW control and additional lenses were adjusted to bring the fundus image into the imaging plane.
2.6 Lens design
After designing the paraxial system, the illumination and imaging paths were transferred into lens design. On the assumption that rodents have poor modulation transfer through the eye [34], a lens design using standard lenses (Qioptiq Holding Deutschland GmbH, Göttingen, Germany) was devised by substituting all paraxial system elements.
2.7 Lens design analysis
To assess functional interaction of the total optical system with respect to the folded illumination path and the imaging path, the sequential data were transferred to non-sequential mode, and the ring source was added to enable realistic ray tracing in terms of propagation and spatial distribution. True-color detectors were placed at the source ring, hole mirror, and pupil ring plane to assess position, lateral magnification, and separation. Because the imaging path is of greater significance than the illumination path, the following were analyzed in greater detail for the former: system MTF, spot diagram, field curvature and distortion data. In this context, system means the complete optical pathway of the eye model and the retina camera (rSRE and RC-R). In sequential mode, rays were traced from the fundus as an object surface (curved) to the image plane (flat CCD sensor). To enable comparison with the data of [34] ZEMAX MTF data obtained in cyc/mm (arising from finite-finite imaging) were rescaled to cyc/deg, taking into account the total lateral magnification and the real curved object size at the eye model.
2.8 Experimental setup
All of the optical elements were integrated into a mechanical framework composed of standard components (Qioptiq). The optical system was integrated with the CCD and the illumination unit into the overall DVA-R system, as shown in Fig. 1. For focus adjustment to get sharp fundus images a standard element (Fine Adjustment C30, Qioptiq Holding Deutschland GmbH, Göttingen, Germany) was utilized.
2.9 Animal preparation
All animal protocols and all procedures were approved by the Institutional Animal Care and Use Committee of the Paracelsus Medical University and the County of Salzburg.
Ten rats were examined: 9 male Brown-Norway and a male Wistar (Charles River Germany, Sulzfeld, Germany). DVA was performed in the Brown-Norway rats. The rats were between 20 and 40 weeks old and weighed 270–380 g. They were anesthetized with Pentobarbital Sodium (50 mg/kg i.p. initially, supplemented as needed).
Imaging and DVA were performed in the right eye after application of topical anesthesia (Novain 0.4%, AGEPHA Pharmaceuticals, Vienna, Austria). The pupil was dilated with mydriatic eye drops (Tropicamid 0.5% and Phenylephrine 2.5%, Landesapotheke Salzburg, Austria), and sodium hyaluronate eye drops (Hylocomod, Croma Pharma, Leobendorf, Austria) were used to maintain stability of the tear film and moistness of the cornea. To prevent artifacts caused by breathing and head movements, the rat’s head was fixed in a stereotaxic head holder (Model 900, Kopf Instruments, Tujunga, CA, USA).
2.10 Image acquisition / DVA
Single images were taken using the standard DVA platform. To obtain qualitative and quantitative feedback from different rat strains (e.g., regarding the combination of illumination light levels and pigmentation), images were captured from 9 Brown-Norway rats and a Wistar rat. For DVA including illumination balancing, vessel segment marking, data acquisition, and vessel diameter, measurements were obtained using the standard DVA platform. To obtain a vessel diameter equivalent to that in the DVA in terms of measuring units (m. u.), lateral magnification in the imaging path of the total system (from the retina to the CCD imager) was considered in the DVA software settings (MAG = 2.5). The Gullstrand eye No. 1 [35] is the standard schematic human eye for DVA [5] the rSRE was considered the standard rat eye for DVA-R. If the rSRE is considered emmetropic, it holds that 1 m. u. = 1 µm.
To assess the stability of the measurement over a typical experimental period, baseline measurement of 7-minutes duration were performed in the 9 Brown-Norway rats. The coefficient of variation and the slope of a linear regression line were used as statistical measures of stability.
3. Results
3.1 rSRE in ZEMAX
Figure 2 shows schematic ZEMAX illustrations of the dimensions of the rat eye (b, c) in relation to the human eye (a).
Fig. 2.
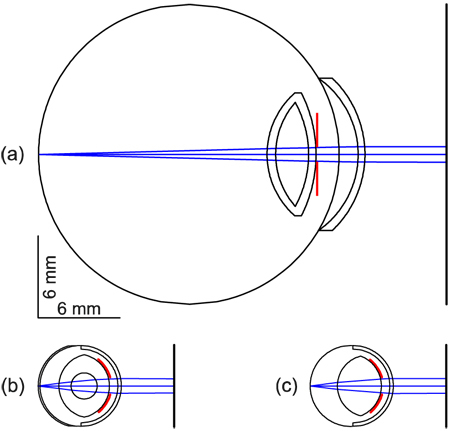
Relaxed schematic eyes in ZEMAX. (a) Gullstrand’s human schematic eye No. 1 [35]. (b) Hughes’ schematic rat eye [7]. (c) Reduced schematic rat eye (rSRE). All eyes show a pupil diameter of 1 mm (red lines).
The rat eye is about a quarter the size of the human eye. With the merit function operand EFFL (effective focal length), the rSRE was optimized to a refractive power of 299.995 dpt, in contrast with Hughes’ core lens model, which has a refractive power of 300.705 dpt. All radii and refractive indices are listed in Table 1 . The rSRE enables ray tracing for half-field angles ≥ 15° and imaging apertures of at least 1 mm in diameter. We inserted a pupil close to the anterior lens face, which is not specified in Hughes´ eye model.
Table 1. Schematic Rat Eye Data from Hughes (HSRE data) and for the Reduced Eye (rSRE) in ZEMAX.
| Surface | HSRE [33] |
rSRE |
||||
|---|---|---|---|---|---|---|
| d (mm) | r (mm) | n | d (mm) | r (mm) | n | |
| Cornea, anterior | 0 | −2.965 | 0 | −2.965 | ||
| 1.38 | 1.38 | |||||
| Cornea, posterior | 0.260 | −2.705 | 0.260 | −2.705 | ||
| 1.337 | 1.51 | |||||
| Pupil | n.s. | n.s. | 0.880 | −2.340 | ||
| 1.337 | 1.51 | |||||
| Lens, anterior | 0.881 | −2.340 | 0.881 | −2.340 | ||
| 1.39 | 1.665 | |||||
| Core, anterior | 1.778 | −0.958 | ||||
| 1.5 | ||||||
| Core, posterior | 3.695 | 0.958 | ||||
| 1.39 | ||||||
| Lens, posterior | 4.591 | 2.340 | 4.111 | 2.259 | ||
| 1.337 | 1.337 | |||||
| Retina | 5.981 | n.s. | 6.111 | 2.965 | ||
| 1.351 | ||||||
| Outer limiting membrane | 6.111 | n.s. | ||||
Note: d = distance starting from the anterior corneal surface; r = radius of curvature according to ZEMAX ( ± ); n = refractive index of each layer. Unspecified values are given as n.s.
3.2 Corneal window
Figure 3 shows CWs for two different pupil sizes in the rSRE with a field of view of 30°. The beam paths for imaging were designed separately before superimposition. With reference to the cornea, the upper CW could be ascertained as 1.14 mm at a pupil diameter of 0.50 mm, whereas the lower CW was 1.68 mm for a pupil diameter of 1.0 mm. Half of each ray bundle is presented for each of the two cases.
Fig. 3.
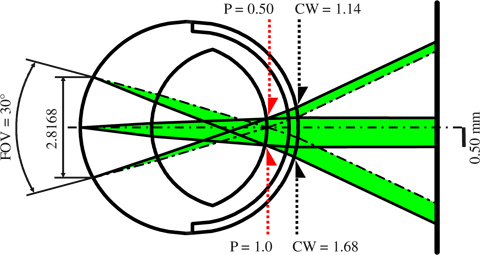
Result of ZEMAX SC illustrating the corneal window (CW) in the reduced schematic rat eye (rSRE). Half-ray bundles are shown for a 0.5 mm pupil (P) (above) and a 1 mm pupil (below), with the rays originating at field points 0° (optical axis) and ± 15°. The 30° field-of-view (FOV) corresponds to 2.8168 mm field height normal to the optical axis. Two rays are plotted for each pupil size: the maximum extent ray (solid line) and the center line (chain line). The 0.50 mm pupil requires a 1.14 mm CW (above), whereas the 1.0 mm pupil requires a 1.68 mm CW (below). P and CW are diameter values.
3.3 Overview of design requirements
Table 2 lists the essential parameters for constructing the optical system (discussed previously), along with the values used in design of the illumination and imaging paths.
Table 2. Key System Design Requirements for Illumination and Imaging.
| Parameter | Value |
|---|---|
| Working distance | ≈15 mm |
| Field of view | 30° |
| Field of illumination | 32° |
| Imaging aperture | ≤ 1.0 mm |
| Corneal window | ≤ 1.68 mm |
| Front focal length (ophthalmoscopic lens) | − ∞ |
| Lens and hole mirror diameters | ≤ 25 mm |
| Hole mirror intermediate image size (normal) | ≤ 17.5 mm |
| Fundus image full size | 7 mm |
| Wavelength | 560 nm (green) |
3.4 Paraxial system design
Figure 4 shows the paraxial subsystem design, scaled vertically by a factor of 3, and incorporating the parameter values from Table 2. The reverse illumination path is shown in Fig. 4(a).
Fig. 4.
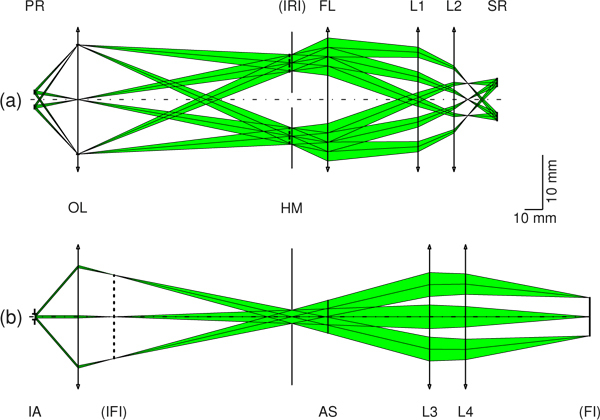
ZEMAX SC results scaled vertically by a factor of 3. (a) Reverse unfolded illumination path from the pupil ring (PR) to the source ring (SR), with a lateral magnification of 2.3. The ophthalmoscopic lens (OL) produces an intermediate ring image (IRI) at the hole mirror (HM). A field lens (FL) and additional lenses (L1, L2) are used to bring the IRI into the SR plane. (b) Imaging path from the pupil position (imaging aperture (IA) of 1.0 mm) to the fundus image (FI) plane. With the OL and lenses L3 and L4, the fundus at infinity is imaged in the FI plane to form a 7-mm image representing a 30° field of view in object space. AS represents an aperture stop used for CW control.
With a pupil ring distance in air (20 mm) longer than the final working distance (≈15 mm), a corneal window of 1.68 mm, and a field of illumination of 32°, the pupil ring is imaged via an ophthalmoscopic lens (OL) into the hole mirror (HM) plane, to form an intermediate ring image (IRI; vertical dashed line).
Finally, a field lens (FL) and additional lenses (L1 and L2) bring the IRI into the source ring (SR) plane, with total lateral magnification of 2.3. The paraxial imaging path is shown in Fig. 4(b).
With an imaging aperture of 1 mm and a 30° field of view, an intermediate fundus image (vertical dotted line in the figure) is generated by the ophthalmoscopic lens. Additional lenses (L3 and L4) then bring the intermediate fundus image into the fundus image (FI) plane, exciting a full image size of 7.0 mm. An aperture stop (AS) was placed after the HM as a means of controlling CW in the experimental setup later on.
3.5 Lens design
Following the paraxial system design process, all paraxial lenses were substituted by real lenses. The combined illumination and imaging system, the schematic rat eye, and a CCD body for illustration are shown in Fig. 5 . All lenses and stops are standard Qioptiq components compatible with the Microbench opto-mechanical system platform. The hole mirror is a first surface mirror (NT69-245, Edmund Optics GmbH, Karlsruhe, Germany) customized by drilling.
Fig. 5.
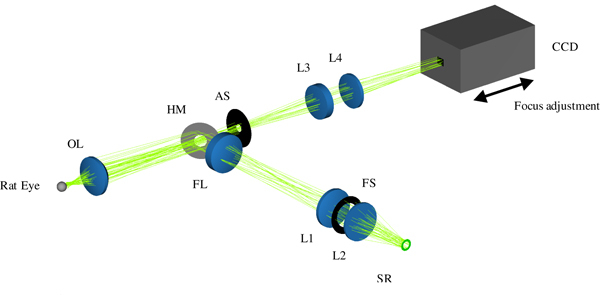
Total optical retina camera in ZEMAX NSC mode, showing the integrated lens optical setup for fundus illumination (folded path) and imaging, adapted to the rat eye. An annular light source, the reduced schematic rat eye, and a CCD are added to enable realistic ray tracing and illustration. Illumination path: source ring (SR) – lenses (L1, L2) – field lens (FL), defines the field of illumination at fundus – hole mirror (HM) – ophthalmoscopic lens (OL) – rat’s pupil (not shown). Imaging path: rat’s fundus – OL – HM – aperture stop (AS) – lenses (L3, L4) – detector. Focus adjustment is done by moving the CCD as indicated by arrows.
3.6 Optical performance
Because of the key role of stop design, the stops and stop images in the ZEMAX NSC mode were analyzed first in the illumination path (Fig. 6 ). True-color detectors were placed close to the source ring, the hole-mirror, and the pupil-ring plane. Figure 6 shows that good ring-stop imaging is theoretically possible using the optimized optical system.
Fig. 6.
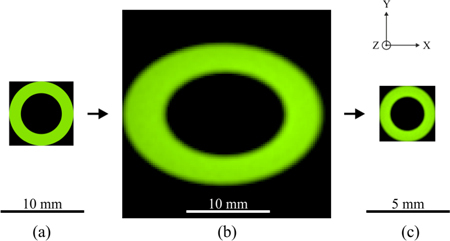
ZEMAX NSC mode results for light propagation and stop check along the z-axis ( = optical axis) in the illumination path at a wavelength of 560 nm. The plots show the distribution of light in the xy-plane in position space. (a) Source ring representing the initial annular size and shape. (b) Hole mirror plane tilted by 45°. The intermediate image at the hole mirror shows the expected elliptical shape, with a distribution in x stretched by a factor of 1.414 with respect to y. Its eccentricity at the hole mirror in x is caused by the different ray heights hitting the tilted plane. (c) Pupil ring as aerial image, 0.435 times the source ring size.
The imaging path was analyzed in ZEMAX sequential mode, and MTFs with geometric optical aberrations were considered. Figure 7 shows tangential (T) and sagittal (S) curves for the system (eye model and retina camera) MTF as a function of spatial frequency in object space in cyc/mm (lower axis). Beginning with the fundus of the eye as the object surface, MTFs were calculated for three field heights, at 0 mm (blue), 0.9613 mm (green), and 1.4084 mm (red), corresponding to field angles of 0°, 10°, and 15°, respectively. The diffraction limit is indicated by the dotted line in the figure. The effective imaging aperture in the rSRE was 1.02 mm, valid for a CW of 1.68 mm. For modulation transfer assessment of the retina camera optics, in respect to the in-vivo performance of rat eye according to [34], two prominent spatial frequencies are indicated in Fig. 7: 1 cyc/deg and 2 cyc/deg for exemplary contrasts of 0.5 and 0.1, respectively. Additionally, the on-axis contrast at 0.5 for the rSRE is shown for comparison.
Fig. 7.
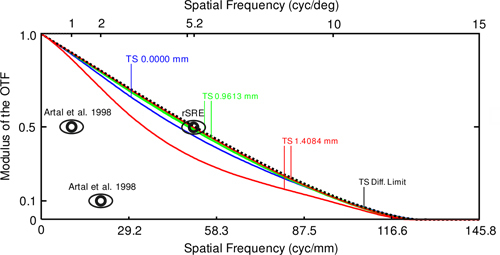
ZEMAX SC mode results, showing system (eye model and retina camera) MTF data for the imaging path at 560 nm wavelength, with spatial frequencies in object space given in cyc/mm (lower horizontal axis). The MTF diffraction limit is represented by the dotted line. Tangential (T) and sagittal (S) graphs calculated for the field points 0 mm (blue), 0.9613 mm (green), and 1.4084 mm (red), correspond to optical axes of 0°, 10°, and 15°, respectively. The spatial frequency shown on the upper horizontal axis gives MTF data in angle space in cyc/deg. Indicated (eye pictograms) are in-vivo contrast data for the rat at 1-mm pupil size (Artal et al. 1998) and schematic rat eye on-axis MTF data for the rSRE (5.2 cyc/deg at 0.5 contrast). In vivo, the contrast was 0.5 for about 1 cyc/deg and 0.1 for 2 cyc/deg, respectively.
Figure 8 shows the ZEMAX results as spot diagrams, field curvature plots, and a distortion plot in the image plane. The spot diagram in Fig. 8(a) represents geometric ray tracing results for three image heights (mm), with the corresponding object heights. The diffraction limit is demonstrated by the black circle representing the Airy disk (rAiry = 23.72 µm). Figure 8(b) shows tangential and sagittal field curvature data as a function of field height. With increasing field height, a steady rise in divergence occurs between T and S, up to 1.44 mm at the maximum field height. Figure 8(c) demonstrates distortion behavior as a percentage. The maximum value is + 8.86% (barrel distortion).
Fig. 8.
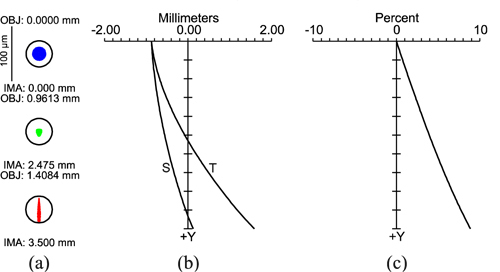
Performance parameters of image plane lens design in ZEMAX. (a) Spot diagram at the image plane for the field points 0 mm, 2.475 mm, and 3.5 mm, corresponding to rSRE field angles of 0°, 10°, and 15°, respectively. The circle indicates the Airy radius (rAiry = 23.72 µm). Thus, the system is diffraction limited. (b) Field curvatures (mm) are shown for the tangential (T) and sagittal (S) planes. Bending of the curves indicates field curvature, whereas divergence of S and T illustrates astigmatism that increases with field size. (c) Distortion as a function of field height from the optical axis, up to the maximum field at 3.5 mm (15°).
3.7 Fundus imaging
With the DVA-R setup in Fig. 1 equipped with the optical system shown in Fig. 5, 30° single fundus images were taken in 9 Brown-Norway rats and a Wistar rat. Two typical fundus images shown in Fig. 9(a) , 9(b) are both almost reflex-free. In the Brown-Norway fundus image (a), residual optical reflex can be seen centrally, just superior to the optic disk. In the Wistar fundus image (b), no reflexes occur due to the optics, but the greater penetration depth enables visualization of structures from deeper layers.
Fig. 9.
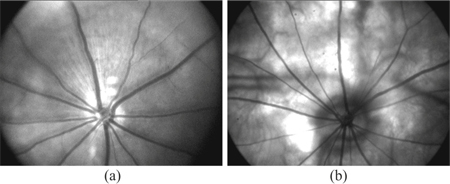
High-contrast fundus images of rats, obtained with the DVA-R, show retinal vessels arising from the optic disk. (a) Brown-Norway rat fundus image shows a residual optical reflex centrally, just superior to the optic disk. (b) Wistar rat fundus image shows retinal vessels, with no noticeable optical reflexes compared with (a), but with greater penetration depth. Choroidal vessels from deeper layers are visible.
3.8 Dynamic vessel analysis
Dynamic retinal vessel analysis was performed in 9 Brown-Norway rats. One retinal artery segment and one vein segment were selected manually in the DVA-R selection window (Fig. 10(a) ) prior to measurement. For functional demonstration, 7-minute baseline measurements were recorded. The time courses of the vessel diameters in a typical experiment are shown in Fig. 10(b). The diameter (mean ± standard deviation) could be ascertained to (31.6 ± 0.275) µm for the artery and (45.0 ± 0.271) µm for the vein for that rat.
Fig. 10.
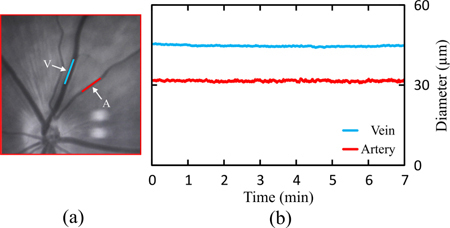
Typical DVA procedure. Retinal artery-vein selection and 7-minute baseline vessel-diameter measurement in a Brown-Norway rat. (a) Manual selection and marking of a retinal artery segment (A, red line) and a vein segment (V, blue line) in the DVA-R selection window. (b) Seven-minute baseline vessel-diameter recordings of the vessel segments shown in (a). The measured diameters are (31.6 ± 0.275) µm for the artery and (45.0 ± 0.271) µm for the vein (values given as mean ± standard deviation).
In all 9 Brown-Norway Rats, the average coefficient of variation was (1.1 ± 0.19) % for the arteries and (0.6 ± 0.08) % for the veins. The slope of the linear regression analysis was (0.56 ± 0.26) % for the arteries and (0.15 ± 0.27) % for the veins on average in all 9 animals.
4. Discussion
We demonstrated dynamic retinal-vessel analysis of the rat eye for the first time. For this purpose, we developed a simplified rat eye model (reduced schematic rat eye, or rSRE) to be used with ZEMAX, in both sequential and non-sequential mode. The model enabled definition of the optic design requirements prior to design and analysis of a novel non-contact retina camera adapted to the rat eye. Nearly reflex-free fundus imaging was achieved. We created a novel Dynamic Vessel Analyzer for the rat by combining this retina camera with an adapted Xe light source and the standard Dynamic Vessel Analyzer platform.
In dynamic retinal-vessel analysis, the reliability of the measuring procedure was demonstrated in 9 rats with baseline recordings without provocation (Fig. 10). Measurements yielded stable readings for both artery and vein, with coefficient of variation around 1% for the arteries and 0.6% for the veins. The drift of the arterial and venous measurements over the 7-minute period (< 1%) can be considered negligible taking into account the slight fluctuations in blood pressure in an in-vivo experiment.
Considering that pulse amplitude in humans is approximately 1%, these variations are likely caused by biological factors such as pulsation and vasomotion; this assumption is also supported by the fact that variation is higher in arteries, because we would expect pulsation amplitudes to be higher in arteries than in veins. However, we accept the possibility of a slight reading error in these variations due to weaker signal-to-noise ratio (SNR), which would probably be more pronounced in the arteries. Because the current frame rate of 25 fps does not meet the sampling theorem at the heart rate of a rat, a higher frame rate may reveal more details regarding biological influences on the baseline time course.
High-contrast reflex-free fundus images were produced in a pigmented Brown-Norway rat and a non-pigmented Wistar rat (Fig. 9). Compared with the Brown-Norway rat, approximately one-tenth of the light was needed for the Wistar rat because of its higher fundus reflectivity and lack of light-absorbing pigmentation. A residual reflex arising from the ophthalmoscopic lens was present in the Brown-Norway fundus image, but this had no negative effect on retinal imaging or DVA. Eye and retina camera alignment, along with individual vessel selection, are additional strengths of the developed system.
Eye safety was estimated in accordance to the specified fundamental requirements for optical radiation safety for ophthalmic instruments in humans (ISO 15004-2:2007) for continuous-wave operation aware of having no valid damage data for the rat. Light intensity was measured in terms of radiant flux using a research radiometer (IL1700, International Light Technologies, Peabody, Massachusetts, USA) together with a measuring head (GRO-268R, Laser 2000 GmbH, Wessling, Germany). For the Brown-Norway rat we measured 2 mW in the cornea plane. Considering the annular area of the illumination beam we obtained irradiance values of 76 mW/cm2 for the cornea, and with a 32° fundus field, 27 mW/cm2 for the retina. This means a safety factor of 52 for the cornea and 26 for the retina, respectively.
Fundus imaging and the DVA results from Fig. 9 and Fig. 10 indicate the direct response between the designed and realized opto-mechanical DVA-R setups, and provide conclusive evidence that stop design must be considered first, before correcting for optical aberrations. With the fundus imaging and dynamic vessel analysis (DVA) results from Fig. 9 and Fig. 10, it can be resumed that the substitution of all system lenses for standard lenses was sufficient in terms of optical performance for imaging the major retinal vessels and performing DVA. The astigmatism illustrated in Fig. 8(a) and 8(b) did not have an obvious effect on both, imaging and DVA. The simulation results from Fig. 7 enabled assessment of imaging performance including the rat eye optics. If the measured MTF contrast for a rat eye for a 1 mm pupil is 0.5 [34], neglecting the difference in wavelength (560 nm vs. 632.8 nm), we calculated a factor of approximately 5, in spatial frequency, compared to the system MTF at 0.5 contrast. The pictogram at 5.2 cyc/deg at a contrast of 0.5 in Fig. 7 represents the on-axis performance of the new eye model. That means, with the system MTF curves shown, the on-axis modulation transfer through the retina camera optics is nearly diffraction limited, because the system MTF contrast of 0.45 lies just slightly below the model eye contrast of 0.5 at 5.2 cyc/deg (see on-axis MTF curve in Fig. 7, blue solid line). With a contrast of 0.47 at the field height of 0.9613 mm the performance is even better. In terms of the spot diagram, field curvature, and distortion data, the performance parameters (Fig. 8) appear acceptable for imaging and measurements of vessel diameter. This is because we selected only a small part of the total field of view; i.e., the part relevant for measurement. In future work, we will attempt to reduce astigmatism, the drifting of sagittal and tangential image planes. Image performance may be enhanced by using customized lenses.
The optical system was designed in reverse order, starting at the rat eye, because the parameter values were clearly defined (Table 2). To focus on stop design (and therefore separation of illumination and imaging), we began with a paraxial design and applied the exact data for heights and angles using the corresponding ZEMAX editors (pupil imaging in Fig. 4(a) and object imaging in Fig. 4(b)). We did not consider any kind of transmission optimization in either the paraxial or lens design (e.g., the use of étendue to target the maximum lumen throughput), but compensated by applying a Xe light source to the low illumination path transmission.
Light–eye interaction is a crucial factor in fundus imaging by indirect ophthalmoscopy, and small eyes pose an additional challenge. The outer-ring diameter is limited by the iris, and the inner-ring diameter by the size of the central imaging aperture. The resulting geometric separation of illumination and imaging paths is necessary for good imaging contrast; any violation leads to impaired image quality. It is previously noted [30] that the corneal window (CW) is the key in fundus camera design. To determine CW in the rat eye, published schematic rat eye data [33] were transformed into ZEMAX. But the small spherical inner-core structure (radius of 0.958 mm) prevented its use in ZEMAX sequential mode, for tracing ray bundles sequentially filling the system stop, and for fields larger than 13° half-angle for a 0.25 mm pupil diameter, or 6.5° for a 1 mm pupil diameter. At this point, we introduced a new reduced schematic rat eye suitable for sequential ray tracing in ZEMAX (data listed in Table 1), which consists of fewer surfaces and has the major difference of a higher lens refractive index: 1.665 vs. 1.5 published in [33]. The higher refractive index is not inconsistent with eye anatomy or Hughes’ core lens model because the total refractive powers are identical. The advantage of the new model is that it enables continuous ray tracing in sequential mode. To define CW, the focus of modeling was the anterior eye, in particular the cornea and the lens, instead of considering a more complex structured eye model; e.g., a gradient index schematic eye [36]. The differences in effective focal length and refractive power (< 1 dpt), respectively, between the new model and Hughes´ model can be neglected when other influences are taken into account, such as tear film thickness and axial length alterations (1 dpt ≈10 µm difference in effective focal length). Different radii of curvature and refractive indices in the eye, whether schematic or real eye, will evoke slightly different exit angles at the cornea, and result in varying CWs. In practice, this uncertainty is considered by using an aperture stop in the imaging path.
MTF rat eye data were studied for two main reasons. First, it was necessary to find a compromise for the applicable pupil diameter in the rat. Smaller diameters lead to reduced geometric optical aberrations and greater depth of foci, whereas larger diameters lead to higher transmission. A 1 mm diameter was chosen. For that diameter, the model eye performance is similar to in-vivo data reported in [34]. The wavelength difference can be neglected. Measurements in mice evoked best optical performance roughly at this diameter [29]. However, all MTF data calculated and discussed above include all optical aberrations and thus represent how rodents naturally see. Analyzed with Shack-Hartmann wavefront sensors and best corrected, better optical performances are possible as measurements in mice show [29,37]. Second, prior to the assembling of the experimental setup, it was important to assess the complete system (rat eye model and optics of the retina camera) referring to in-vivo modulation transfer performance (see Fig. 7).
5. Conclusion
In this paper, we presented a well-performing system for retinal imaging and dynamic retinal vessel analysis in the rat. The system can be used for basic research on vessel behavior, and enables the investigation of microcirculation and the performance of retinal-vessel analysis measurements according to current paradigms, including standard provocation techniques such as oxygen breathing, and pressure application.
Acknowledgment
The authors acknowledge financial support from the German Federal Ministry of Education and Research within the program UNTERNEHMEN REGION (grant#: 03IP605, MIntEye), the Adele Rabensteiner Foundation, Austrian Academy of Sciences, Lotte Schwarz Endowment for Experimental Ophthalmology and Glaucoma Research, FWF Austrian Science Fund (grant#: FWF J1866-MED and FWF P15729), and the Fuchs Foundation.
References and links
- 1.Wong T. Y., Klein R., Couper D. J., Cooper L. S., Shahar E., Hubbard L. D., Wofford M. R., Sharrett A. R., “Retinal microvascular abnormalities and incident stroke: the atherosclerosis risk in communities study,” Lancet 358(9288), 1134–1140 (2001). 10.1016/S0140-6736(01)06253-5 [DOI] [PubMed] [Google Scholar]
- 2.Klein R., Klein B. E., Moss S. E., Wong T. Y., Hubbard L., Cruickshanks K. J., Palta M., “The relation of retinal vessel caliber to the incidence and progression of diabetic retinopathy: XIX: the Wisconsin epidemiologic study of diabetic retinopathy,” Arch. Ophthalmol. 122(1), 76–83 (2004). 10.1001/archopht.122.1.76 [DOI] [PubMed] [Google Scholar]
- 3.Ikram M. K., Witteman J. C. M., Vingerling J. R., Breteler M. M. B., Hofman A., de Jong P. T. V. M., “Retinal vessel diameters and risk of hypertension: the Rotterdam study,” Hypertension 47(2), 189–194 (2005). 10.1161/01.HYP.0000199104.61945.33 [DOI] [PubMed] [Google Scholar]
- 4.Klein R., Klein B. E. K., Knudtson M. D., Wong T. Y., Tsai M. Y., “Are inflammatory factors related to retinal vessel caliber? the Beaver Dam Eye study,” Arch. Ophthalmol. 124(1), 87–94 (2006). 10.1001/archopht.124.1.87 [DOI] [PubMed] [Google Scholar]
- 5.Seifert B.-U., Vilser W., “Retinal Vessel Analyzer (RVA)--design and function,” Biomed. Tech. (Berl.) 47(s1bSuppl 1 Pt 2), 678–681 (2002). 10.1515/bmte.2002.47.s1b.678 [DOI] [PubMed] [Google Scholar]
- 6.Nagel E., Vilser W., Lanzl I. M., “Retinal vessel reaction to short-term IOP elevation in ocular hypertensive and glaucoma patients,” Eur. J. Ophthalmol. 11(4), 338–344 (2001). [DOI] [PubMed] [Google Scholar]
- 7.Vilser W., Nagel E., Lanzl I., “Retinal Vessel Analysis--new possibilities,” Biomed. Tech. (Berl.) 47(s1bSuppl 1 Pt 2), 682–685 (2002). 10.1515/bmte.2002.47.s1b.682 [DOI] [PubMed] [Google Scholar]
- 8.Bek T., Hajari J., Jeppesen P., “Interaction between flicker-induced vasodilatation and pressure autoregulation in early retinopathy of type 2 diabetes,” Graefes Arch. Clin. Exp. Ophthalmol. 246(5), 763–769 (2008). 10.1007/s00417-008-0766-y [DOI] [PubMed] [Google Scholar]
- 9.Mandecka A., Dawczynski J., Vilser W., Blum M., Müller N., Kloos C., Wolf G., Müller U. A., “Abnormal retinal autoregulation is detected by provoked stimulation with flicker light in well-controlled patients with type 1 diabetes without retinopathy,” Diabetes Res. Clin. Pract. 86(1), 51–55 (2009). 10.1016/j.diabres.2009.06.017 [DOI] [PubMed] [Google Scholar]
- 10.Pemp B., Weigert G., Karl K., Petzl U., Wolzt M., Schmetterer L., Garhofer G., “Correlation of flicker-induced and flow-mediated vasodilatation in patients with endothelial dysfunction and healthy volunteers,” Diabetes Care 32(8), 1536–1541 (2009). 10.2337/dc08-2130 [DOI] [PMC free article] [PubMed] [Google Scholar]
- 11.Blum M., Saemann A., Wolf G., “The eye, the kidney and microcirculation,” Nephrol. Dial. Transplant. 26(1), 4–6 (2011). 10.1093/ndt/gfq425 [DOI] [PubMed] [Google Scholar]
- 12.Lanzl I. M., Seidova S.-F., Maier M., Lohmann C., Schmidt-Trucksäss A., Halle M., Kotliar K. E., “Dynamic retinal vessel response to flicker in age-related macular degeneration patients before and after vascular endothelial growth factor inhibitor injection,” Acta Ophthalmol. (Copenh.) 89(5), 472–479 (2011). 10.1111/j.1755-3768.2009.01718.x [DOI] [PubMed] [Google Scholar]
- 13.Pemp B., Polska E., Garhofer G., Bayerle-Eder M., Kautzky-Willer A., Schmetterer L., “Retinal blood flow in type 1 diabetic patients with no or mild diabetic retinopathy during euglycemic clamp,” Diabetes Care 33(9), 2038–2042 (2010). 10.2337/dc10-0502 [DOI] [PMC free article] [PubMed] [Google Scholar]
- 14.Pressler A., Esefeld K., Scherr J., Ali M., Hanssen H., Kotliar K., Lanzl I., Halle M., Kaemmerer H., Schmidt-Trucksäss A., Hager A., “Structural alterations of retinal arterioles in adults late after repair of aortic isthmic coarctation,” Am. J. Cardiol. 105(5), 740–744 (2010). 10.1016/j.amjcard.2009.10.070 [DOI] [PubMed] [Google Scholar]
- 15.Pang I. H., Clark A. F., “Rodent models for glaucoma retinopathy and optic neuropathy,” J. Glaucoma 16(5), 483–505 (2007). 10.1097/IJG.0b013e3181405d4f [DOI] [PubMed] [Google Scholar]
- 16.J. C. Morrison, E. Johnson, and W. O. Cepurna, “Rat models for glaucoma research,” in Progress in Brain Research, L. C. N. N. O. Carlo Nucci and B. Giacinto, eds. (Elsevier, 2008), pp. 285–301. [DOI] [PubMed] [Google Scholar]
- 17.M. Bader, “Rat Models of Cardiovascular Diseases,” in Rat Genomics, I. Anegon, ed. (Humana Press, 2010), pp. 403–414. [DOI] [PubMed] [Google Scholar]
- 18.Stefansson E., “Oxygen and diabetic eye disease,” Graefes Arch. Clin. Exp. Ophthalmol. 228(2), 120–123 (1990). 10.1007/BF00935719 [DOI] [PubMed] [Google Scholar]
- 19.Padnick-Silver L., Kang Derwent J. J., Giuliano E., Narfström K., Linsenmeier R. A., “Retinal oxygenation and oxygen metabolism in Abyssinian cats with a hereditary retinal degeneration,” Invest. Ophthalmol. Vis. Sci. 47(8), 3683–3689 (2006). 10.1167/iovs.05-1284 [DOI] [PubMed] [Google Scholar]
- 20.H. A. Reitsamer and J. W. Kiel, “Oxygen gradients in the anterior segment of the eye,” ARVO Meeting Abstracts 48, 6043 (2007). [Google Scholar]
- 21.Cohan B. E., Pearch A. C., Jokelainen P. T., Bohr D. F., “Optic disc imaging in conscious rats and mice,” Invest. Ophthalmol. Vis. Sci. 44(1), 160–163 (2003). 10.1167/iovs.02-0105 [DOI] [PubMed] [Google Scholar]
- 22.Paques M., Guyomard J. L., Simonutti M., Roux M. J., Picaud S., Legargasson J. F., Sahel J. A., “Panretinal, high-resolution color photography of the mouse fundus,” Invest. Ophthalmol. Vis. Sci. 48(6), 2769–2774 (2007). 10.1167/iovs.06-1099 [DOI] [PubMed] [Google Scholar]
- 23.Ufret-Vincenty R. L., Aredo B., Liu X., McMahon A., Chen P. W., Sun H., Niederkorn J. Y., Kedzierski W., “Transgenic mice expressing variants of complement factor H develop AMD-like retinal findings,” Invest. Ophthalmol. Vis. Sci. 51(11), 5878–5887 (2010). 10.1167/iovs.09-4457 [DOI] [PubMed] [Google Scholar]
- 24.Koronyo-Hamaoui M., Koronyo Y., Ljubimov A. V., Miller C. A., Ko M. K., Black K. L., Schwartz M., Farkas D. L., “Identification of amyloid plaques in retinas from Alzheimer’s patients and noninvasive in vivo optical imaging of retinal plaques in a mouse model,” Neuroimage 54(Suppl 1), S204–S217 (2011). 10.1016/j.neuroimage.2010.06.020 [DOI] [PMC free article] [PubMed] [Google Scholar]
- 25.DiLoreto D., Jr, Grover D. A., del Cerro C., del Cerro M., “A new procedure for fundus photography and fluorescein angiography in small laboratory animal eyes,” Curr. Eye Res. 13(2), 157–161 (1994). 10.3109/02713689409042411 [DOI] [PubMed] [Google Scholar]
- 26.Hawes N. L., Smith R. S., Chang B., Davisson M., Heckenlively J. R., John S. W., “Mouse fundus photography and angiography: a catalogue of normal and mutant phenotypes,” Mol. Vis. 5, 22 (1999). [PubMed] [Google Scholar]
- 27.Murata H., Aihara M., Chen Y.-N., Ota T., Numaga J., Araie M., “Imaging mouse retinal ganglion cells and their loss in vivo by a fundus camera in the normal and ischemia-reperfusion model,” Invest. Ophthalmol. Vis. Sci. 49(12), 5546–5552 (2008). 10.1167/iovs.07-1211 [DOI] [PubMed] [Google Scholar]
- 28.Kocaoglu O. P., Uhlhorn S. R., Hernandez E., Juarez R. A., Will R., Parel J.-M., Manns F., “Simultaneous fundus imaging and optical coherence tomography of the mouse retina,” Invest. Ophthalmol. Vis. Sci. 48(3), 1283–1289 (2007). 10.1167/iovs.06-0732 [DOI] [PubMed] [Google Scholar]
- 29.Geng Y., Schery L. A., Sharma R., Dubra A., Ahmad K., Libby R. T., Williams D. R., “Optical properties of the mouse eye,” Biomed. Opt. Express 2(4), 717–738 (2011). 10.1364/BOE.2.000717 [DOI] [PMC free article] [PubMed] [Google Scholar]
- 30.Pomerantzeff O., Webb R. H., Delori F. C., “Image formation in fundus cameras,” Invest. Ophthalmol. Vis. Sci. 18(6), 630–637 (1979). [PubMed] [Google Scholar]
- 31.A. Gullstrand, Einführung in die Methoden der Dioptrik des Auges des Menschen (S. Hirzel, Leipzig, 1911). [Google Scholar]
- 32.Koschmieder I., Müller L., “[Image diagnostic of the retina with fundus cameras],” Z. Med. Phys. 17(1), 67–72 (2007). 10.1016/j.zemedi.2006.11.005 [DOI] [PubMed] [Google Scholar]
- 33.Hughes A., “A schematic eye for the rat,” Vision Res. 19(5), 569–588 (1979). 10.1016/0042-6989(79)90143-3 [DOI] [PubMed] [Google Scholar]
- 34.Artal P., Herreros de Tejada P., Muñoz Tedó C., Green D. G., “Retinal image quality in the rodent eye,” Vis. Neurosci. 15(4), 597–605 (1998). 10.1017/S0952523898154020 [DOI] [PubMed] [Google Scholar]
- 35.A. Gullstrand, “The optical system of the eye,” in Southall JPC, trans-ed. Helmholtz’s Treatise on Physiological Optics, orig. German ed. 1909 3ed. (Optical Society of America, 1962), pp. 350–358. [Google Scholar]
- 36.Campbell M. C. W., Hughes A., “An analytic, gradient index schematic lens and eye for the rat which predicts aberrations for finite pupils,” Vision Res. 21(7), 1129–1148, 1135–1148 (1981). 10.1016/0042-6989(81)90016-X [DOI] [PubMed] [Google Scholar]
- 37.de la Cera E. G., Rodríguez G., Llorente L., Schaeffel F., Marcos S., “Optical aberrations in the mouse eye,” Vision Res. 46(16), 2546–2553 (2006). 10.1016/j.visres.2006.01.011 [DOI] [PubMed] [Google Scholar]


