Abstract
A reconstruction algorithm for bioluminescence tomography (BLT) has been developed. The algorithm numerically calculates the Green’s function at different wavelengths using the diffusion equation and finite element method. The optical properties used in calculating the Green’s function are reconstructed using diffuse optical tomography (DOT) and assuming anatomical information is provided by x-ray computed tomography or other methods. A symmetric system of equations is formed using the Green’s function and the measured light fluence rate and the resulting eigenvalue problem is solved to get the eigenvectors of this symmetric system of equations. A space can be formed from the eigenvectors obtained and the reconstructed source is written as an expansion of the eigenvectors corresponding to non-zero eigenvalues. The coefficients of the expansion are found to obtain the reconstructed BL source distribution. The problem is solved iteratively by using a permissible source region that is shrunk by removing nodes with low probability to contribute to the source. Throughout this process the permissible region shrinks from the entire object to just a few nodes. The best estimate of the reconstructed source is chosen that which minimizes the difference between the calculated and measured light fluence rates. 3D simulations presented here show that the reconstructed source is in good agreement with the actual source in terms of locations, magnitudes, sizes, and total powers for both localized multiple sources and large inhomogeneous source distributions.
OCIS codes: (170.6960) Tomography, (170.3880) Medical and biological imaging
1. Introduction
Bioluminescence tomography (BLT) has recently attracted much interest as a molecular imaging technique that can be used as a noninvasive visualization of disease progression and response to treatment [1–4]. Direct in vivo bioluminescence imaging does not give quantitative information about the distribution of the light source (corresponding to luciferase concentration) due to multiple light scattering and absorption in tissue. To correctly estimate the distribution of luciferase in tissue from the bioluminescence image, BLT algorithms need to be developed.
BLT is ill-posed problem [5,6]. The number of data points available from the measured light fluence rate at the tissue boundary is much smaller than the number of unknown possible source distributions and this precludes a unique solution to the problem [6]. The ill-posedness of the problem can be reduced by increasing the number of data points by doing multi-spectral measurements for BLT [7–9]. Also, the number of unknowns can be reduced by using a priori information about permissible source regions [10–12] or solving for a rough estimate of an optimal permissible source region [13]. Using a priori information about the source distribution can be beneficial for constraining the problem and improving the reconstruction. Different researchers have used sparsity regularization [14–16] for reconstructing localized and sparse sources. Using a source penalty term for regularization and an iterative minimization solution based on the L1 norm to shrink the source permissible regions was successful for achieving the reconstruction of a few localized sources [17]. In our previous work [18], an algorithm based on iterative shrinking of the source permissible region accompanied by minimizing an objective function formed from normalized Green’s functions at different wavelengths and measured light fluence rates gave good results in reconstructing localized and distributed sources. However, non-uniform source distributions and multiple sources with different powers were degenerate to the algorithm as sources with the same total power but different magnitudes (i.e. power per unit volume) and sizes could not be distinguished.
In the current work, a 3D BLT algorithm based on diffusion theory [19–26] has been developed to reconstruct inhomogeneous bioluminescence source distributions with good accuracy in terms of location, power, magnitude, and size. The Green’s function for the object is found by numerically solving the diffusion equation using the method of finite elements at different wavelengths. The scattering and absorption coefficients of all tissues are reconstructed using the diffuse optical tomography algorithm developed in [17] assuming known anatomical information obtained by another imaging modality such as x-ray CT. The calculated Green’s function and the measured light fluence rate are normalized to equate the contributions from all wavelengths. A symmetric system of equations is formed using the Green’s function and the measured light fluence rate. An eigenvalue problem is then solved to get the eigenvectors of the formed symmetric system of equations. The system of equations is rank deficient because the number of unknowns (source magnitude at each location) exceeds the number of data values (light fluence rate). Therefore, many eigenvalues of the system will be zero. A set of eigenvectors corresponding to non-zero eigenvalues is used as a complete set of vectors where the reconstructed source can be written as an expansion of these vectors. The set of vectors is assumed to be complete not in the mathematical sense but in the physical sense that any physical source distribution can formed from a combination of these vectors. The coefficients of the expansion are solved to obtain the source distribution. The removal of the eigenvectors corresponding to zero eigenvalues reduces the ill-posedness of the problem and imposes constraint on the reconstruction of the source without a need of using a regularization penalty term which reduces the accuracy of the reconstruction. The solution is repeated several times. At every iteration, the permissible source region is shrunk by removing nodes with low probability to contribute to the source. Throughout this process the permissible region shrinks from the entire object to just a few nodes. The best estimate of the source is that which minimizes the difference between the calculated and measured light fluence rates.
2. BLT reconstruction
The diffusion equation and the Robin-type boundary condition at a specific wavelength at zero modulation frequency are given by [27,28]
| (1) |
| (2) |
where is the light fluence rate at position r and wavelength λ; Ω and are the domain and its boundary respectively, and the source distribution is given by . The spatial distribution of the tissue optical properties at wavelength λ is given by the absorption coefficient and the diffusion coefficient , where the diffusion coefficient is defined by
| (3) |
where is the reduced scattering coefficient , is the scattering coefficient and g is the anisotropy factor. is a unit vector pointed outwardly normal to , and A is derived from Fresnel’s law as [29]
| (4) |
where is the critical angle, , and η is the tissue refractive index at the boundary while the air refractive index is assumed to be 1.
Equation (1) can be solved numerically using the method of finite elements (FE), and the discrete version of Eq. (1) as shown in [18] is given by
| (5) |
where is the Green’s function matrix at wavelength λ obtained by discretizing the diffusion equation. Assuming that the source magnitude is not a function of wavelength or, equivalently, the source spectrum is known in the range of measurement, for multi-spectral measurements at the detectors on the object surface, Eq. (5) for N wavelengths in a normalized form can be given by
| (6) |
or concisely , where d is the detector index at the boundary , and R is the source permissible region index which contains the index of nodes of the finite element mesh inside the domain Ω. This corresponds to the permissible source region which could be considered initially to be the whole domain Ω. The normalization of the Green’s function and light fluence rate by the maximum value of the light fluence rate at each wavelength improves the efficiency of the algorithm as shown before in [18]. Usually the number of rows of the matrix in Eq. (6) which equals is smaller than the number of columns, . A symmetric system of equations can be obtained from Eq. (6):
| (7) |
where is the transpose of the matrix . The rank of the matrix is smaller than the number of rows or columns, and it has several zero eigenvalues, so it cannot be directly inverted to get a solution for the source. The matrix can still be inverted indirectly using a regularization technique as described in [9] or by other methods. Also a minimization method can be used to reconstruct the source without inverting the matrix as described in our previous algorithm in [18]. The aims of the proposed algorithm are not only to invert the matrix to find a solution to the source distribution, but to improve the accuracy of reconstruction. This can be achieved by limiting the domain of space where a solution for the source can be found. The constraint on the source space is imposed by considering only the part that contributes to the source distribution and removing the remainder that does not contribute and causes the matrix to be singular. Instead of solving the system of equations in Eq. (7), a new system with a reduced space can be formed which is directly invertible. Therefore, the source can be assumed to be a superposition of the non-zero eigenvectors of the matrix such that
| (8) |
where is an eigenvector of the matrix corresponding to non-zero eigenvalue and M is the number of chosen eigenvectors. The coefficients of the expansion in Eq. (8) can be obtained by substituting the source expansion in Eq. (8) into Eq. (7) and multiplying both sides of Eq. (7) by the eigenvectors as follows:
| (9) |
where and .
The matrix is a real symmetric matrix with dimensions which is directly invertible and much smaller in size than the matrix. The system of equations obtained in Eq. (9) from Eq. (7) saves computation time by inverting a much smaller, directly invertible matrix and limits the source space domain by considering only the eigenvectors that contribute to the source distribution. To guarantee the robustness of the algorithm in the presence of noise, not all eigenvectors corresponding to non-zero eigenvalues should be used in expansion (8). Otherwise the matrix will be close to singular which will give inaccurate coefficients when using noisy data. Instead, for noise levels of 2%–10%, we found empirically that using eigenvectors such that the lowest corresponding eigenvalue is within of the highest eigenvalue ensures robustness in the presence of noisy data. Since the space of eigenvectors used in expansion (8) does not include all eigenvectors corresponding to non-zero eigenvalues, the accuracy of the reconstruction could be affected. Thus, increasing the number of eigenvectors used in the expansion within the same domain of eigenvalues will ensure the robustness and improve the accuracy. This can be done by rescaling the system of equations given in Eq. (7) such that every row is normalized by the maximum value of that row. This will re-scale the eigenvalues to give more corresponding eigenvectors in the domain of eigenvalues (the max value and of the maximum value). Thus, the eigenvectors extraction is performed after normalizing the matrix. Physically, this normalization could be seen as giving more weight to source nodes which are far from detectors and have lower contribution to the light fluence rate compared to source nodes close to detectors.
The algorithm described above is solved several times for different permissible source regions starting from the whole object size and ending with a few nodes. For every solution, the objective function which gives the difference between the calculated and measured light fluence rate is calculated. After all iterations, the solution that minimizes the objective function with respect to the permissible source region is considered the best solution. The shrinking of the permissible region after every iteration is done by removing source nodes from the domain R corresponding to low source power as described before in [17,18]. Hence, if is the number of nodes in the permissible region in the current iteration, the number of nodes in the next iteration is , where β is the reduction factor. The reduction factor can be found from the initial and final number of nodes in the permissible region and the predefined number of iterations such that, whereis the initial number of nodes in the permissible region R, and is the final number of nodes. The algorithm is summarized in Table 1 .
Table 1. Algorithm description for BLT.
| Algorithm for BLT reconstruction | |||
|---|---|---|---|
| 1. Calculate the Green’s function at all wavelengths in Eq. (5) | |||
| 2. Choose the rows corresponding to the detector nodes d | |||
| 3. Normalize the light fluence rate at every wavelength and get the corresponding Green’s function, and as in Eq. (6) | |||
| 4. Initialize the permissible region R: nodes corresponding to the whole object domain except nodes of one transport length from the object boundary. | |||
| 5. Initialize permissible region reduction factor , whereis the initial number of nodes in the permissible region R, is the final number of nodes which can be chosen to be one, and is the number of iterations. | |||
| 6. Solve the reconstruction problem iteratively: | |||
| 6.1. For i = 1: | |||
| 6.2. Solve the eigenvalue problem for the symmetric matrix | |||
| 6.3. Form a set of eigenvectors that corresponds to the eigenvalues in the range of the maximum eigenvalue to of the maximum value. | |||
| 6.4. Calculate the matrix and the vector using Eq. (9) | |||
| 6.5. Obtain the coefficient of expansion using and hence the source | |||
| 6.6. Calculate the objective function | |||
| 6.7. If the value of f(i) is smaller than the previous iteration, then update the best source estimation to be s: | |||
| 6.8. Sort the source values descending and choose number of nodes equals corresponding to the highest source values to be used to choose the new permissible region | |||
| 6.9. Update the permissible region R to be the new chosen nodes | |||
| 6.10. End the For loop | |||
| 7. End | |||
4. Results and discussions
The 3D object (Fig. 1(a) ) used in the simulations is a cylinder 25 mm in diameter and 16 mm in height and represents a finite element mesh of an idealized section of a mouse abdomen where adipose, bowel, kidney, and bone tissues are identified and assigned realistic wavelength-dependent optical properties. It is assumed that different regions are distinguished through CT x-ray imaging or other imaging technique and all elements within each region have the same optical properties. For the BLT, 64 uniformly distributed detectors are used around the circumference and 15 layers of these 64 detectors separated by 1 mm are used in the z-direction as shown in Fig. 1(b). The total number of detector readings at each wavelength is.
Fig. 1.
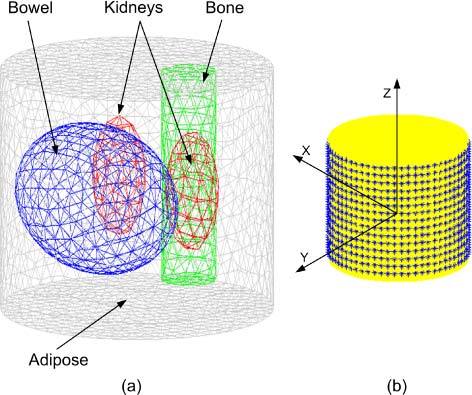
(a) A 3D finite element mesh for the object used in the simulation. The mesh is a regular Delaunay tetrahedral with 2310 nodes and 12633 tetrahedrons. The object represents an idealized section of a mouse abdomen which illustrates 4 different tissue regions: adipose, bowel, kidneys, and bone. (b) A schematic of the object showing the detector set up and the coordinates.
Figure 2 shows three cross sections of the object that illustrate the positions of the bioluminescence sources to be reconstructed by the proposed algorithm. The circular transverse cross section Fig. 2(a) is taken at the middle of the object (z = 0) parallel to the upper and lower surfaces of the object. Figure 2(b) is a sagittal cross section that passes through the bowel and bone while Fig. 2(c) shows a coronal cross section passing through the two kidneys. Figure 2 shows 3 spherical bioluminescence sources of 5 mm and 3 mm diameter centered in the bone at (0, −7, 0) and two kidneys (−4.5, −2.5, 0) and (4.5, −2.5, 0), respectively.
Fig. 2.
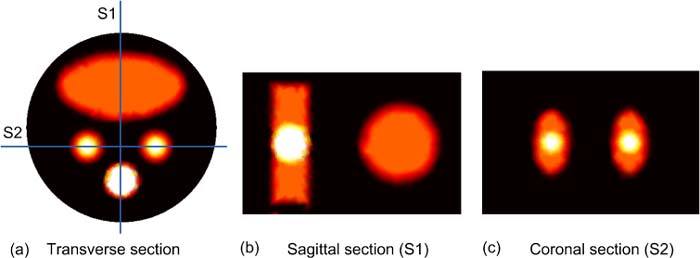
2D sections illustrate the positions of the 3 spherical bioluminescence sources located in the bone and two kidneys. (a) A transverse cross section at the middle of the object shows the bowel, kidneys, and bone, (b) Sagittal section S1 passes through the bone and bowel, and (c) Coronal section S2 passes through the two kidneys.
In the first step, the optical properties of all tissues at the wavelengths 500, 550, 600, 650, and 700 nm were reconstructed using the DOT algorithm described in [17]. 16 external sources uniformly distributed around the middle of object have been used for the illumination. Associated with each source, 15 layers of detectors were uniformly distributed across the object height with a separation between layers of 1 mm. Each layer contains 49 detectors forming a field of view of 270 degree. The light fluence rate at the “detectors” could be derived from the corresponding pixels of the image captured by a CCD camera. It is assumed that an accurate segmented 3D image set is provided by x-ray CT, MR or by a deformable atlas of mouse anatomy. All elements within each region in the object are assumed to have the same optical properties. The light fluence rate at the boundary is written as a Taylor series expansion around an initial guess corresponding to a homogenous object with the same optical properties in all regions. The fluence rate is approximated by the first three terms, including the first and second order derivatives which are calculated by the direct method and give the change of light fluence rate at the boundary due to small changes in the tissue optical properties in each region [17]. The first and second order derivatives are used in an iterative algorithm to reconstruct the tissue optical properties. For this simulation, forward finite element calculations of the light fluence rate were performed using the true optical properties and Gaussian noise, which is an approximation to the Poisson measurement error distribution, of 2% of the signal was added to obtain the data for reconstruction, i.e. , where randn is a Matlab function that generates random numbers drawn from a normal distribution with mean zero and standard deviation one. In Table 2 , the true and reconstructed scattering coefficients, and respectively, are presented while Table 3 shows the true and reconstructed absorption coefficients, and respectively. The true scattering and absorption coefficients were calculated using the data reported in [30,31]. The maximum relative error obtained for scattering coefficients is 22% at 600 nm while the maximum relative error obtained for the absorption coefficients is 21% at 700 nm.
Table 2. True [30,31] and reconstructed scattering coefficients (mm−1)for each region in the heterogeneous object at five different wavelengths.
| 500 nm | 550 nm | 600 nm | 650 nm | 700 nm | ||||||
|---|---|---|---|---|---|---|---|---|---|---|
| Adipose | 1.41 | 1.41 | 1.34 | 1.34 | 1.28 | 1.29 | 1.23 | 1.23 | 1.18 | 1.18 |
| Bowel | 1.65 | 1.62 | 1.47 | 1.46 | 1.32 | 1.28 | 1.19 | 1.19 | 1.09 | 1.08 |
| Kidney-L | 3.51 | 3.9 | 3.04 | 2.94 | 2.66 | 2.05 | 2.36 | 2.37 | 2.11 | 2.02 |
| Kidney-R | 3.51 | 3.93 | 3.04 | 2.77 | 2.66 | 2.13 | 2.36 | 2.24 | 2.11 | 2.06 |
| Bone | 3.84 | 3.76 | 3.34 | 3.33 | 2.93 | 2.8 | 2.61 | 2.60 | 2.34 | 2.03 |
Table 3. True [30,31] and reconstructed absorption coefficients (mm−1) for each region in the heterogeneous object at five different wavelengths.
| 500 nm | 550 nm | 600 nm | 650 nm | 700 nm | ||||||
|---|---|---|---|---|---|---|---|---|---|---|
| Adipose | 0.0037 | 0.0037 | 0.0089 | 0.0089 | 0.0021 | 0.0021 | 0.0007 | 0.0007 | 0.0005 | 0.0005 |
| Bowel | 0.0104 | 0.0103 | 0.0256 | 0.0258 | 0.0063 | 0.0064 | 0.0017 | 0.0017 | 0.0011 | 0.0012 |
| Kidney-L | 0.0626 | 0.0611 | 0.1524 | 0.1531 | 0.0356 | 0.0361 | 0.0090 | 0.0095 | 0.0048 | 0.0056 |
| Kidney-R | 0.0626 | 0.0607 | 0.1524 | 0.1529 | 0.0356 | 0.0360 | 0.0090 | 0.0095 | 0.0048 | 0.0058 |
| Bone | 0.0548 | 0.0550 | 0.1347 | 0.1344 | 0.0325 | 0.0325 | 0.0081 | 0.0081 | 0.0040 | 0.0039 |
The true optical properties at each wavelength and the true source distribution were used by the forward model to calculate the bioluminescence fluence rate, and 2% Gaussian noise was added to simulate realistic data: in Eq. (6). The Green’s function at each wavelength was calculated using the reconstructed optical properties in Tables 2 and 3 obtained by the DOT algorithm. The Green’s functions and light fluence rates were normalized as shown in Eq. (6). The permissible region R was initially chosen to be the whole object except for nodes within one transport length of the surface. At each iteration, the permissible region is slightly shrunk by an arbitrary factor β. For a permissible region initially containing 1050 mesh nodes (as in the current problem) that is finally shrunk to 10 nodes in 60 iterations, β = (1050/10) ^ (1/60) = 1.081. The 60 iterations took approximately 7 minutes on a pc with Intel processor with a clock of 2.66 GHz and 2GB RAM. The execution time is less than that required by our previous algorithm in [18].
Figure 3 shows the actual and reconstructed bioluminescence sources. The magnitudes of the three sources are 1 nW/mm3, and the total powers of the three sources are 5.65, 5.65, and 40.71 nW, respectively. The transverse, sagittal, and coronal cross sections of the reconstructed sources in Figs. 3(d), (e), and (f) show good agreement with the actual sources in terms of source magnitude, total power and size. The total power of the reconstructed sources are 5.31, 5.49, and 41.4 nW. The source magnitude varies between 0.8 to 1.2 nW/mm3 which is within 20% of the true value.
Fig. 3.
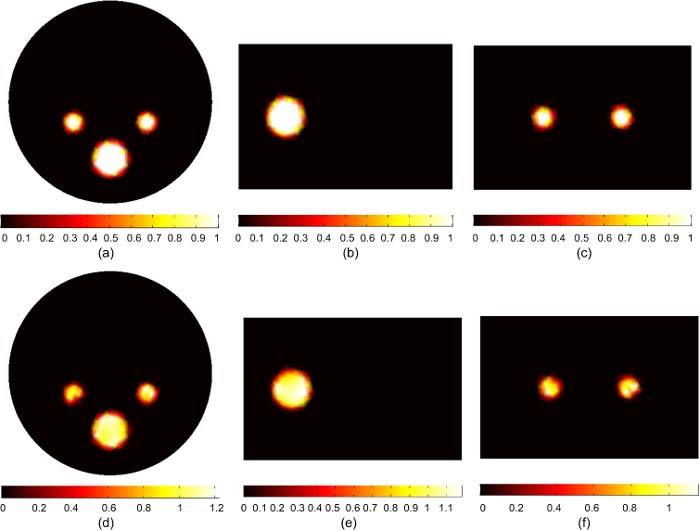
BLT reconstruction of three uniform bioluminescence sources localized in the left and right kidneys (3 mm diameters), and the bone (5 mm diameter). The “anatomy” is shown in Figs. 1 and 2. The actual sources in (a), (b), and (c) have magnitude 1 nW/ mm3. The reconstructed sources are shown in (d), (e), and (f). The total powers of actual and reconstructed sources are in good agreement within 6% and the source magnitudes are reconstructed within 20% of the actual value.
The evolution of the objective function with the number of source nodes in the permissible region is illustrated in Fig. 4 . Figure 4(a) shows the objective function as a function of the number of source nodes in the permissible source region. The permissible region has been shrunk in 60 iterations by removing nodes corresponding to low source magnitude, assuming that source nodes with low magnitude are less likely to be in the optimized source region. Figures 4(b) and 4(c) show the reconstructed source distribution in nW/mm3 after the first iteration which includes a permissible region of 1050 nodes and at the optimized permissible region which includes 126 nodes and minimizes the objective function. After the first iteration, the reconstructed source powers in the two kidneys and bone are 3.37, 3.8, and 51.93 nW, respectively which are within 40% of their actual values. The source magnitudes and sizes cannot be reconstructed perfectly after the first iteration due to the degeneracy of the solution. When the size of the source permissible region becomes comparable to the size of the actual source, the objective function has its lowest value and good accuracy in reconstructing the source power, magnitude, and size can be obtained, as shown in Fig. 4(c). When the permissible region is further reduced, the size of the source permissible region becomes smaller than the size of the actual source. Hence, the objective function increases again and the reconstruction of the source power, magnitude and size becomes less accurate.
Fig. 4.
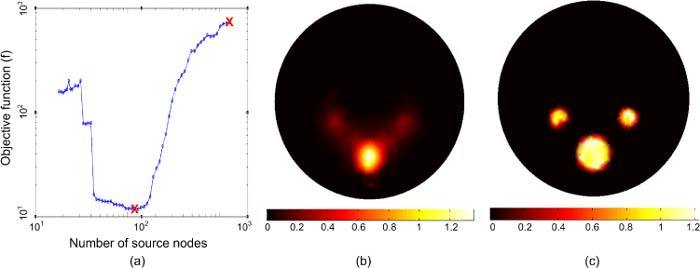
The evolution of the BLT iterative solution to obtain the optimized reconstruction. (a) The objective function as a function of the number of finite element mesh source nodes in the permissible source region. (b) The reconstructed BL source distribution after the first iteration. (c) The reconstructed BL source distribution when the objective function is minimized.
Figure 5 shows the BLT reconstruction for multiple sources with different magnitudes and sizes. The sources in the left and right kidneys are 2 and 3 nW/mm3 respectively, and the source in the bone is 1 nW/mm3. The three sources have total powers of 11.31, 16.96, and 40.71 nW. The reconstructed sources in Figs. 5(d), (e), and (f) have powers of 11.56, 18.81, and 38.92 nW respectively, which are within 11% of the true value. The source magnitudes are reconstructed within 20% of the true values. As a comparison with the result obtained using our previous algorithm in [18], the maximum errors in the reconstructed source power and magnitude are 16% and 60% respectively.
Fig. 5.
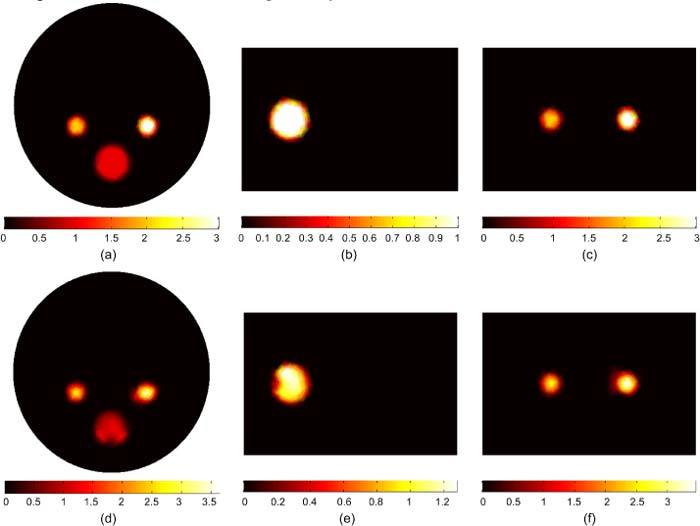
BLT reconstruction of three uniform bioluminescence sources localized in the left kidney (2 nW/ mm3), right kidneys (3 nW/ mm3), and the bone (1 nW/ mm3). The actual sources are shown in (a), (b), and (c). The reconstructed sources are shown in (d), (e), and (f). The total powers of actual and reconstructed sources are in agreement within 11% and the source magnitudes are reconstructed within 20% of their actual values.
Figure 6 shows the BLT reconstruction for multiple sources with different magnitudes and sizes. In this case, one source is greater in both size and magnitude and hence has much larger total power than other sources and dominates the measured light fluence rate. The sources in the left and right kidneys are 1 nW/mm3 and 2 nW/mm3 respectively and the source in the bone is 3 nW/mm3. The three sources have total powers of 5.65, 11.31, and 122.14 nW respectively. The reconstructed sources are shown in Figs. 6(d), (e), and (f). The reconstructed sources powers are 8.7, 10.94, and 120.14 nW respectively. The size and magnitude of the smallest source in the left kidney could not be reconstructed in this case. When there are large differences between source powers or there is a large inhomogeneous source distribution, the shrinking of the permissible region cannot be done correctly. The assumption that nodes with low source magnitude are least likely to be in the optimized source region is no longer true.
Fig. 6.
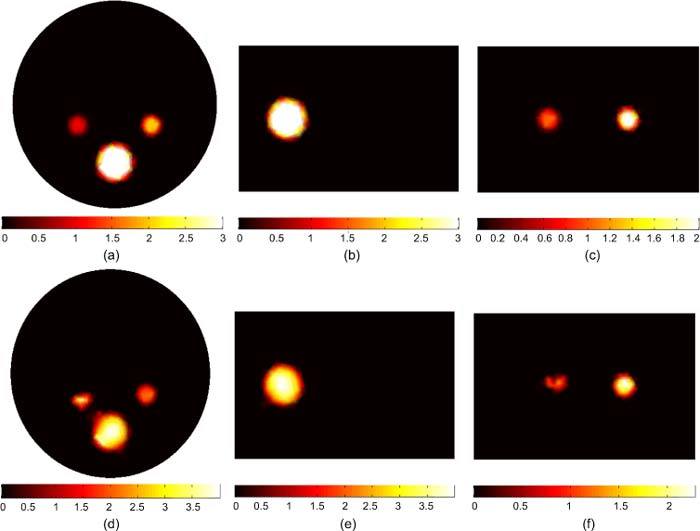
BLT reconstruction of three uniform bioluminescence sources localized in the left kidney (1 nW/ mm3), right kidney (2 nW/ mm3), and bone (3 nW/ mm3). The total powers of the three sources are 5.65, 11.31, and 122.14 nW, respectively. The actual sources are shown in (a), (b), and (c). The reconstructed sources are shown in (d), (e), and (f). The total powers of the reconstructed sources are 8.7, 10.94, and 120.14 nW respectively. The smallest source could not be properly reconstructed in this case because a much larger source is located nearby and dominates the emission of light measured at the boundary.
Figure 7 shows the BLT reconstruction for a large non-uniform source that fills the entire left kidney. There is a 3mm diameter “hot spot” of 2 nW/mm3 in the center of the organ and a uniform “background” of 1 nW/mm3 elsewhere. The total powers of the actual and reconstructed sources integrated over the kidney volume are 53.67 and 53.71 nW. The reconstructed source in Figs. 7(c) and 7(d) is in good agreement with the actual source in terms of size and total power. The inhomogeneity of the source distribution could be reconstructed and the high spot in the center of the kidney could be distinguished from the background. The magnitude of the reconstructed source at the center of the hot spot is within 20% of its actual value. As a comparison with the result obtained using our previous algorithm in [18], the inhomogeneity of the reconstructed source could not be distinguished. An average value for the source magnitude was obtained rather than the hot spot shown in Fig. 7.
Fig. 7.
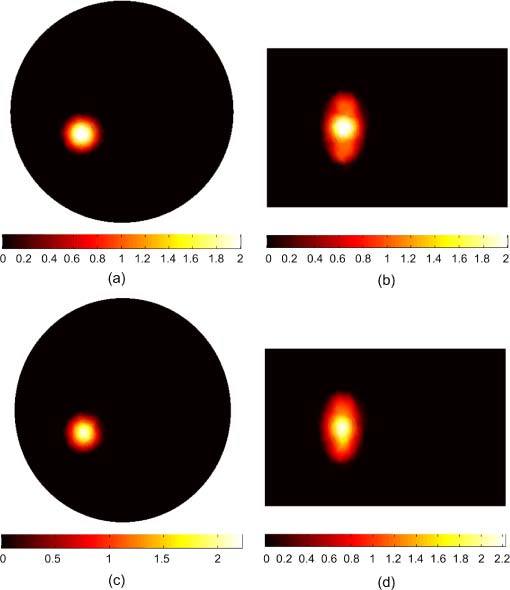
BLT reconstruction of a large non-uniform source distribution that fills the entire left kidney. The actual source in (a) and (b) has a hot spot of 3 mm diameter with magnitude 2 nW/mm3 which is twice the magnitude of the background. The reconstructed source in (c) and (d) shows good agreement with the actual source in terms of size and total power and the details of the inhomogeneity of the source were reconstructed.
Figure 8 shows the BLT reconstruction for a non-uniform source distribution where the inhomogeneity of the source is high. In this case, the hot spot has a magnitude of 5 nW/mm3 which is 5 times that of the surrounding background. The total powers of the actual and reconstructed sources are 70.63 and 70.8 nW. However, the inhomogeneity of the source could not be reconstructed correctly in this case. The uniform background shows a smaller size and a higher magnitude, which varies from 1.5 to 2.5 nW/mm3, than the actual source. The objective function curve with respect to the number of source nodes for the reconstructed source shown in Fig. 8 does not show a deep valley with a clear global minimum as shown in Fig. 4(a). Instead, the curve is slowly increasing after the global minimum indicating that different source distributions can generate the same error and hence are indistinguishable. Therefore, shrinking the permissible region reduces the possible solutions, and if the permissible region equals the actual source size, a unique solution can be obtained for uniform and low inhomogeneity source distributions as shown in Figs. 3, 5, and 7. However, for high inhomogeneity source distributions as in Figs. 6 and 8, the solution is still not unique and different size and magnitude sources that have the same total power can generate the same light fluence rate at the object boundary. One way to improve the uniqueness of the solution is to increase the available data points by doing measurements at more wavelengths.
Fig. 8.
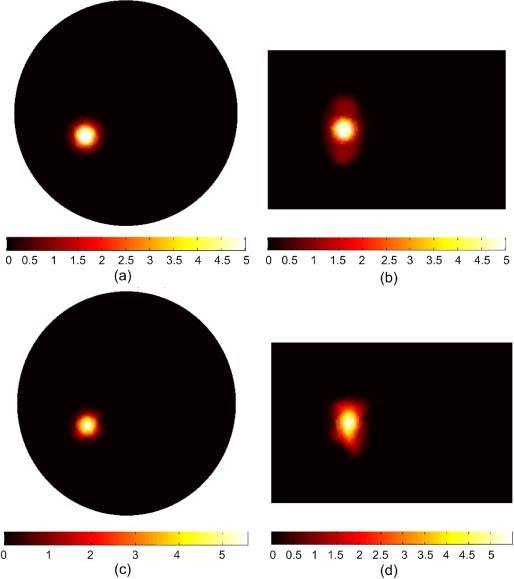
BLT reconstruction of a large non-uniform source distribution that fills the entire left kidney. The actual source in (a) and (b) has a hot spot of 3 mm diameter with magnitude 5 nW/mm3 which is five times the magnitude of the background. The reconstructed source in (c) and (d) shows good agreement with the actual source in terms of the total reconstructed power; however the details of the in homogeneity of the source could not be reconstructed correctly.
5. Conclusion
A three dimensional bioluminescence reconstruction algorithm based on the diffusion equation has been developed. The finite element method has been used to discretize the diffusion equation to calculate the Green’s function. The algorithm performs an iterative solution to reconstruct the bioluminescence source by shrinking the source permissible region. At each iteration, an eigenvalue problem for a system of equations formed from the Green’s functions and the measured light fluence rate is solved. A complete set of vectors is formed from the eigenvectors corresponding to non-zero eigenvalues. The reconstructed source is written as a superposition of this complete set. The algorithm has been applied to a simplified 3D section of a mouse that contains different tissues with different optical properties such as adipose, bowel, kidneys, and bone. A diffuse optical tomography algorithm is used to reconstruct the tissue optical properties at different wavelengths. The forward model applied with the true tissue optical properties and 2% Gaussian noise has been used to generate realistic data for the reconstruction algorithm for DOT, and BLT. The Green’s functions of the object have been calculated using the reconstructed optical properties. The main advantage of the current algorithm over our previous bioluminescence algorithm is that the reconstruction is done in a reduced space of eigenvectors by removing part of the original space that does not contribute to the source and causes the ill-posedness of the problem. Hence, the accuracy of the reconstruction increases not only for the source location and total power but also for the source magnitude and size for multiple sources with different sizes and magnitudes and large inhomogeneous distributed sources. For uniform and low inhomogeneity source distributions, the algorithm could obtain a unique solution corresponding to a global minimum for the objective function. However, for high inhomogeneity source distributions, the solution is still not unique and different size and magnitude sources that have the same total power can generate the same light fluence rate at the object boundary.
Acknowledgments
This work was supported in part by grants from the Ontario Ministry of Research and Innovation postdoctoral fellowship program.
References and links
- 1.Ntziachristos V., Ripoll J., Wang L. V., Weissleder R., “Looking and listening to light: the evolution of whole-body photonic imaging,” Nat. Biotechnol. 23(3), 313–320 (2005). 10.1038/nbt1074 [DOI] [PubMed] [Google Scholar]
- 2.Weissleder R., Mahmood U., “Molecular imaging,” Radiology 219(2), 316–333 (2001). [DOI] [PubMed] [Google Scholar]
- 3.Willmann J. K., van Bruggen N., Dinkelborg L. M., Gambhir S. S., “Molecular imaging in drug development,” Nat. Rev. Drug Discov. 7(7), 591–607 (2008). 10.1038/nrd2290 [DOI] [PubMed] [Google Scholar]
- 4.Tian J., Bai J., Yan X. P., Bao S., Li Y., Liang W., Yang X., “Multimodality molecular imaging,” IEEE Eng. Med. Biol. Mag. 27(5), 48–57 (2008). 10.1109/MEMB.2008.923962 [DOI] [PubMed] [Google Scholar]
- 5.Song X., Wang D., Chen N., Bai J., Wang H., “Reconstruction for free-space fluorescence tomography using a novel hybrid adaptive finite element algorithm,” Opt. Express 15(26), 18300–18317 (2007). 10.1364/OE.15.018300 [DOI] [PubMed] [Google Scholar]
- 6.Wang G., Li Y., Jiang M., “Uniqueness theorems in bioluminescence tomography,” Med. Phys. 31(8), 2289–2299 (2004). 10.1118/1.1766420 [DOI] [PubMed] [Google Scholar]
- 7.Chaudhari A. J., Darvas F., Bading J. R., Moats R. A., Conti P. S., Smith D. J., Cherry S. R., Leahy R. M., “Hyperspectral and multispectral bioluminescence optical tomography for small animal imaging,” Phys. Med. Biol. 50(23), 5421–5441 (2005). 10.1088/0031-9155/50/23/001 [DOI] [PubMed] [Google Scholar]
- 8.Ahn S., Chaudhari A. J., Darvas F., Bouman C. A., Leahy R. M., “Fast iterative image reconstruction methods for fully 3D multispectral bioluminescence tomography,” Phys. Med. Biol. 53(14), 3921–3942 (2008). 10.1088/0031-9155/53/14/013 [DOI] [PMC free article] [PubMed] [Google Scholar]
- 9.Dehghani H., Davis S. C., Jiang S., Pogue B. W., Paulsen K. D., Patterson M. S., “Spectrally resolved bioluminescence optical tomography,” Opt. Lett. 31(3), 365–367 (2006). 10.1364/OL.31.000365 [DOI] [PubMed] [Google Scholar]
- 10.Cong W., Wang G., Kumar D., Liu Y., Jiang M., Wang L. V., Hoffman E. A., McLennan G., McCray P. B., Zabner J., Cong A., “Practical reconstruction method for bioluminescence tomography,” Opt. Express 13(18), 6756–6771 (2005). 10.1364/OPEX.13.006756 [DOI] [PubMed] [Google Scholar]
- 11.He X., Liang J., Qu X., Huang H., Hou Y., Tian J., “Truncated total least squares method with a practical truncation parameter choice scheme for bioluminescence tomography inverse problem,” Int. J. Biomed. Imaging 2010, 291874 (2010). 10.1155/2010/291874 [DOI] [PMC free article] [PubMed] [Google Scholar]
- 12.Huang H., Qu X., Liang J., He X., Chen X., Yang D., Tian J., “A multi-phase level set framework for source reconstruction in bioluminescence tomography,” J. Comput. Phys. 229(13), 5246–5256 (2010). 10.1016/j.jcp.2010.03.041 [DOI] [Google Scholar]
- 13.Feng J., Jia K., Yan G., Zhu S., Qin C., Lv Y., Tian J., “An optimal permissible source region strategy for multispectral bioluminescence tomography,” Opt. Express 16(20), 15640–15654 (2008). 10.1364/OE.16.015640 [DOI] [PubMed] [Google Scholar]
- 14.Lu Y., Zhang X., Douraghy A., Stout D., Tian J., Chan T. F., Chatziioannou A. F., “Source reconstruction for spectrally-resolved bioluminescence tomography with sparse a priori information,” Opt. Express 17(10), 8062–8080 (2009). 10.1364/OE.17.008062 [DOI] [PMC free article] [PubMed] [Google Scholar]
- 15.Mohajerani P., Eftekhar A. A., Huang J., Adibi A., “Optimal sparse solution for fluorescent diffuse optical tomography: theory and phantom experimental results,” Appl. Opt. 46(10), 1679–1685 (2007). 10.1364/AO.46.001679 [DOI] [PubMed] [Google Scholar]
- 16.Cao N., Nehorai A., Jacobs M., “Image reconstruction for diffuse optical tomography using sparsity regularization and expectation-maximization algorithm,” Opt. Express 15(21), 13695–13708 (2007). 10.1364/OE.15.013695 [DOI] [PubMed] [Google Scholar]
- 17.Naser M. A., Patterson M. S., “Algorithms for bioluminescence tomography incorporating anatomical information and reconstruction of tissue optical properties,” Biomed. Opt. Express 1(2), 512–526 (2010). 10.1364/BOE.1.000512 [DOI] [PMC free article] [PubMed] [Google Scholar]
- 18.Naser M. A., Patterson M. S., “Improved bioluminescence and fluorescence reconstruction algorithms using diffuse optical tomography, normalized data, and optimized selection of the permissible source region,” Biomed. Opt. Express 2(1), 169–184 (2011). 10.1364/BOE.2.000169 [DOI] [PMC free article] [PubMed] [Google Scholar]
- 19.Arridge S. R., Schweiger M., Hiraoka M., Delpy D. T., “A finite element approach for modeling photon transport in tissue,” Med. Phys. 20(2), 299–309 (1993). 10.1118/1.597069 [DOI] [PubMed] [Google Scholar]
- 20.Schweiger M., Arridge S. R., Hiraoka M., Delpy D. T., “The finite element method for the propagation of light in scattering media: boundary and source conditions,” Med. Phys. 22(11), 1779–1792 (1995). 10.1118/1.597634 [DOI] [PubMed] [Google Scholar]
- 21.Jiang H., “Frequency-domain fluorescent diffusion tomography: a finite-element-based algorithm and simulations,” Appl. Opt. 37(22), 5337–5343 (1998). 10.1364/AO.37.005337 [DOI] [PubMed] [Google Scholar]
- 22.Hielscher A. H., Klose A. D., Hanson K. M., “Gradient-based iterative image reconstruction scheme for time-resolved optical tomography,” IEEE Trans. Med. Imaging 18(3), 262–271 (1999). 10.1109/42.764902 [DOI] [PubMed] [Google Scholar]
- 23.Gu X., Zhang Q., Larcom L., Jiang H., “Three-dimensional bioluminescence tomography with model-based reconstruction,” Opt. Express 12(17), 3996–4000 (2004). 10.1364/OPEX.12.003996 [DOI] [PubMed] [Google Scholar]
- 24.Slavine N. V., Lewis M. A., Richer E., Antich P. P., “Iterative reconstruction method for light emitting sources based on the diffusion equation,” Med. Phys. 33(1), 61–68 (2006). 10.1118/1.2138007 [DOI] [PubMed] [Google Scholar]
- 25.Comsa D. C., Farrell T. J., Patterson M. S., “Quantification of bioluminescence images of point source objects using diffusion theory models,” Phys. Med. Biol. 51(15), 3733–3746 (2006). 10.1088/0031-9155/51/15/009 [DOI] [PubMed] [Google Scholar]
- 26.Kuo C., Coquoz O., Troy T. L., Xu H., Rice B. W., “Three-dimensional reconstruction of in vivo bioluminescent sources based on multispectral imaging,” J. Biomed. Opt. 12(2), 024007 (2007). 10.1117/1.2717898 [DOI] [PubMed] [Google Scholar]
- 27.Arridge S. R., “Optical tomography in medical imaging,” Inverse Probl. 15(2), R41–R93 (1999). 10.1088/0266-5611/15/2/022 [DOI] [Google Scholar]
- 28.Klose A. D., “Transport-theory-based stochastic image reconstruction of bioluminescence sources,” J. Opt. Soc. Am. A 24(6), 1601–1608 (2007). 10.1364/JOSAA.24.001601 [DOI] [PubMed] [Google Scholar]
- 29.Dehghani H., Eames M. E., Yalavarthy P. K., Davis S. C., Srinivasan S., Carpenter C. M., Pogue B. W., Paulsen K. D., “Near infrared optical tomography using NIRFAST: Algorithm for numerical model and image reconstruction,” Commun. Numer. Methods Eng. 25(6), 711–732 (2009). 10.1002/cnm.1162 [DOI] [PMC free article] [PubMed] [Google Scholar]
- 30.Alexandrakis G., Rannou F. R., Chatziioannou A. F., “Tomographic bioluminescence imaging by use of a combined optical-PET (OPET) system: a computer simulation feasibility study,” Phys. Med. Biol. 50(17), 4225–4241 (2005). 10.1088/0031-9155/50/17/021 [DOI] [PMC free article] [PubMed] [Google Scholar]
- 31.S. A. Prahl, Oregon Medical Laser Clinic (2001), http://omlc.ogi.edu/spectra/index.html


