

Abstract
The GABA type A receptor (GABAAR) is a member of the pentameric ligand gated ion channel (pLGIC) family that mediates ionotropic neurotransmission. Residues in the intracellular loop domain (ILD) have recently been shown to define part of the ion permeation pathway in several closely related members of the pentameric ligand gated ion channel family. In this study, we investigated the role the ILD of the GABAAR α1 subunit plays in channel function. Deletion of the α1 ILD resulted in a significant increase in GABA EC50 and maximal current amplitude, suggesting that the ILD must be intact for proper receptor function. To test this hypothesis, we conducted a mutagenic screen of all amino acids harboring ionizable side chains within this domain to investigate the contribution of individual charged residues to ion permeation. Using macroscopic and single channel voltage-clamp recording techniques, we found that mutations within a subdomain of the α1 ILD near M3 altered GABA apparent affinity; interestingly, α1(K312E) exhibited reduced partial agonist efficacy. We introduced point mutations near M4, including α1(K383E) and α1(K384E), that enhanced receptor desensitization. Mutation of 5 charged residues within a 39-residue span contiguous with M4 reduced relative anion permeability of the channel and may represent a weak intracellular selectivity filter. Within this subdomain, the α1(K378E) mutation induced a significant reduction in single channel conductance, consistent with our hypothesis that the GABAAR α1 ILD contributes directly to the permeation pathway.
Keywords: Biophysics, Cell Surface Receptor, GABA Receptors, Ion Channels, Site-directed Mutagenesis, Conductance, Patch Clamp Electrophysiology
Introduction
The GABA type A receptor (GABAAR)2 is a chloride permeable ion channel that mediates inhibitory neurotransmission and is a member of the Cys-loop family of pentameric ligand gated ion channels (pLGIC). This family of receptors is ubiquitous throughout the nervous system and is essential for neural signaling. Cationic family members include the ionotropic serotonin receptor (5-HT3R), the nicotinic acetylcholine receptor (nAChR), the zinc-activated channel, and two bacterial homologs from Gloeobacter violaceus and Erwinia chrysanthemi (1); anionic channels include the glycine receptor (GlyR), heteromeric GABAA receptor, and homomeric GABAC receptor. Each of the five subunits of the pentamer has a modular arrangement with an extracellular ligand binding domain (LBD), four α-helical transmembrane domains (TMDs, deemed M1-M4), and a large intracellular loop domain (ILD) connecting M3 and M4. This arrangement of each subunit with respect to the membrane was first postulated in nAChR from Torpedo californica (2) and has recently been confirmed at 2.9 Å resolution in the prokaryotic homolog from G. violaceus (3).
Within the pLGIC family, the major determinants of ligand binding, channel gating, ion conductance, and charge selectivity have been shown to be controlled by residues within the LBD and the TMD. For instance in GABAARs, the GABA binding site exists at the two extracellular interfaces between α and β subunits (4), and the structural determinants of gating are predicted to be the pre-M1 segment, M2–3 linker, and loops 2, 7, and 9 at the interface of the LBD and TMD within each subunit (5–8). Ion permeation and selectivity are proposed to be determined at sites along the central pore in the extracellular vestibule and along M2 (9–15). These canonical rings of charged residues, contributed by each of the five subunits, have been hypothesized to interact with permeant ions to control the magnitude of channel conductance and to determine which charge species transverse the membrane.
The ILD, on the other hand, is known to play a role in receptor trafficking and activity through control of surface expression (16–22). The ILD is the substrate for interactions with accessory proteins (19, 23–25) and kinases that covalently modify the receptor to alter function (17, 18, 26, 27). In contrast to the TMD and LBD, much less is known about the structure of the ILD. The determination of a structure for the nAChR from Torpedo marmorata suggests that M4 is contiguous with a 25-residue membrane-associated helix (denoted MA); however, the remaining ∼100 residues in the ILD were disordered (28). In addition, this domain contains the highest degree of primary sequence divergence both in terms of domain length and residue identity (Fig. 1). Furthermore, the prokaryotic pLGIC subunits lack an ILD, with M3 and M4 being connected by a short (<10 residue) linker.
FIGURE 1.

Sequence alignment of pLGIC ILDs. Subunits and accession nos. were as follows: GABRα1 (NP_000797), GABRα2 (NP_000798), GLYRα1 (NP_000162), GLYRα2 (NP_001112357), ACHRα (P02711), ACHRβ (AAR29361), ACHRδ (AAA49275), ACHRγ (AAA49276), 5HT3A (NP_000860), and 5HT3B (NP_006019)). Flanking TMD residues from M3 and M4 are shown as white letters highlighted in black. Charged residues in the GABAAR α1 subunit that were mutated in this study are marked with asterisks, and aligned residues are highlighted in gray to show conservation. Putative gephyrin binding sites are underlined with a dotted line (24, 25), residues shown to control conductance in 5HT3R are boxed (32) and the MA domain for nAChR is underlined (28).
Recent mutagenesis studies in cationic nAChR and homomeric GlyRs have uncovered a role for intracellular charged residues in determining channel conductance (29–34). This was first determined by comparing the 5-HT3A and 5-HT3B subunits of the 5-HT3R that have an ∼40-fold difference in conductance to identify the MA residues, which control this phenomenon (32, 35) (Fig. 1). The lack of homology in the ILD makes it difficult to extrapolate these findings across the entire pLGIC family, and the ILD role in permeation has yet to be established for the GABAAR. Furthermore, these studies have focused solely on the MA stretch and have largely ignored the portion between M3 and MA. It, therefore, remains to be seen if the ILD component of permeation is conserved within heteromeric GABAARs.
Based on previous work, we hypothesized that the ILD of the GABAAR plays an integral role in defining a novel segment of the permeation pathway. To test this, we chose to focus on the α1 subunit. The M3-M4 loops of β and γ subunits are known to make important and potentially confounding interactions with trafficking and scaffold proteins such as AP2, GABARAP, gephyrin, BIG-2, and GRIP-1 (17, 18, 21, 23). Therefore, in this study we chose to modify only the α1 subunit, leaving the β2 and γ2s subunits intact to establish a role for the α1 ILD in controlling GABAAR activity, not its involvement in trafficking and signaling pathways. Specifically, we characterized deletion constructs of the α1 ILD and also carried out a systematic site-directed mutagenesis charge-switch scan, changing basic residues to glutamate and acidic residues to lysine to assay the role that individual charged α1 ILD residues play in controlling channel function. Our results indicate that subdomains of the M3-M4 intracellular loop are indeed responsible for controlling separate components of channel function.
EXPERIMENTAL PROCEDURES
Mutagenesis and Cell Culture
Wild type GABAAR complementary DNAs (cDNAs) for the human α1, β2, and γ2s subunits were expressed via the pCIS2 vector with a CMV viral promoter in HEK293 cells (American Type Culture Collection). Deletions and point mutations in the wild type α1 subunit cDNA were introduced using the QuikChange® site-directed mutagenesis kit (Stratagene) and confirmed by sequencing (MWG/Operon). It is noteworthy to mention that the β2 homolog of α1(D393) has been shown to be essential for surface expression and, therefore, was preserved in all constructs (36). HEK293 cells were maintained at 37 °C and 5% CO2, in Eagle minimum essential medium supplemented with 5% FBS (Hyclone), 40 μm l-glutamine, 100 units/ml penicillin, and 0.1 mm streptomycin. Cells were passaged weekly with trypsin treatment up to 20 times. Seventy-two h after plating onto poly-d-lysine-coated glass coverslips, HEK293 cells were co-transfected with cDNAs for the GABAAR α1, β2, and γ2s subunits as well as adeno-associated virus GFP via a calcium phosphate method (37). Reagents were purchased from Sigma unless otherwise noted.
Whole-cell Recordings
Wild type and mutant GABAA receptors were characterized via whole-cell, voltage-clamp electrophysiology at room temperature 36–72 h after transfection. Patch pipettes were fabricated from thin-walled borosilicate glass (TW150F-4, World Precision Instruments, Inc.) using a horizontal puller (P-97, Sutter Instrument Co.). The resistance of patch pipettes was 2–5 megaohms when filled with an intracellular solution containing 120 mm KCl, 2 mm MgCl2, 10 mm EGTA, and 10 mm HEPES adjusted to pH 7.2 with NaOH. Cells were perfused continuously with an extracellular solution containing 160 mm NaCl, 10 mm HEPES, 6 mm d-glucose, 3 mm KCl, 1 mm MgCl2, 1.5 mm CaCl2 adjusted to pH 7.4 for a near symmetrical chloride gradient with a theoretical reversal potential of −7.80 mV. Changes in ion selectivity were addressed using extracellular ion replacement solutions. The low sodium saline contained 14 mm NaCl, 146 mm N-methyl-d-glucamine, 10 mm HEPES, 6 mm d-glucose, 3 mm KCl, 1 mm MgCl2, 1.5 mm CaCl2, and the low chloride saline contained 5 mm NaCl, 155 mm sodium gluconate, 10 mm HEPES, 6 mm d-glucose, 3 mm KCl, 1 mm MgCl2, 1.5 mm CaCl2; both solutions were adjusted to pH 7.4. Two 10-channel infusion pumps (KD Scientific) and a rapid solution exchanger (Biologic) were used to apply extracellular salines to the cells. For more rapid solution exchange, to assess the fast desensitization of channel gating, large (∼10 picofarads) outside-out patches were pulled and positioned in the outflow of the solution changer. Whole-cell currents were recorded at −60 mV, digitized at 200 Hz, and filtered at 100 Hz with a MultiClamp 700B amplifier and DigiData 1322A interface (Molecular Devices). The solution changer was driven by protocols written in pClamp 9.2 (Molecular Devices). To assess current-voltage properties of each receptor construct, a voltage ramp, from −60 to +60 mV and back to −60 mV (0.24 mV/ms for total ramp duration of 0.5 s) was applied within the plateau response to each concentration of GABA and in the washout (subtracted to control for basal response of the membrane). Data were gathered from at least eight cells for each mutation from at least two independent transfections. To ensure consistency, several wild type responses were recorded from each transfection. Each whole-cell patch was exposed to eight increasing concentrations of GABA in separate traces with and without the voltage ramp. To determine desensitization from excised patches, 3 mm GABA was applied for 10 s and washed out for 20 s between sweeps.
Whole-cell Analysis
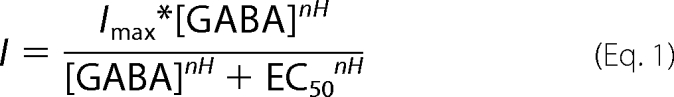
Analysis of recordings was carried out using MatLab (The Math Works, Inc.). Peak currents (I) from GABA exposures spread over 3.5 logarithmic decades were fit to the Hill equation (Equation 1); each mutation was compared with WT using three metrics: GABA apparent affinity (EC50) current magnitude (Imax) and Hill coefficient (nH).
 |
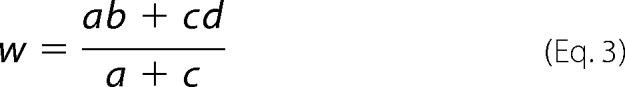
The desensitizing portion of currents elicited with saturating concentrations of GABA (1–3 mm) was defined as the time period from 200 ms after GABA onset to 200 ms before GABA was removed. Any traces still showing a rising phase during this time period were not included in this analysis. This segment was fit with an exponential equation (Equation 2) to determine a weighted rate constant (w) for desensitization (Equation 3).
 |
The S.E. (s) for normalized means (X) was determined from the raw mean (μ) and standard error (σ) values using Equation 4 for WT and Equation 5 for mutants.
 |
 |
Reversal potential (Erev) values in normal and each ion replacement solution were calculated from ramp data by interpolating the membrane potential when I = 0. Theoretical reversal potentials were determined from the Nernst equation (Equation 6) assuming membranes were permeable only to chloride. At room temperature, 25 °C, ϕ = RT/F = 25.69 mV (38).
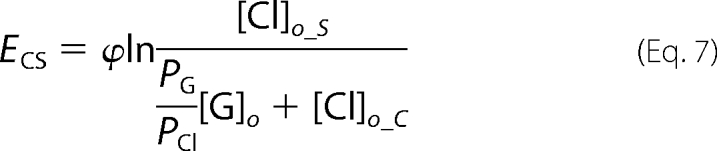
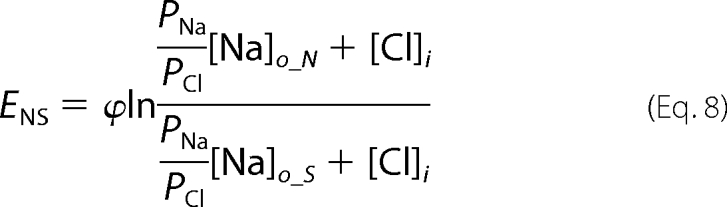
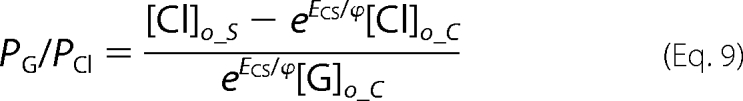
Ramp data were collected in a pair-wise fashion for normal and ion replacement solutions so that relative shifts in reversal potential, ENS and ECS, induced by low sodium and low chloride solutions, respectively, could be determined for each cell. We determined relative permeabilities for gluconate (PG/PCl) and sodium (PNa/PCl) from the relative reversal potential shifts with the following manipulations of the Goldman-Hodgkin-Katz voltage equation, (Equations 7–10),
 |
 |
 |
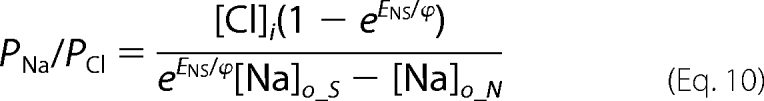 |
Subscripts refer to the intracellular (i) and extracellular (o) ion concentrations in standard (S) low sodium (N) and low chloride (C) solutions.
Single Channel Recordings and Analysis
Single channel currents elicited from saturating GABA concentrations (3 mm) were recorded at −80 mV and filtered at 8 kHz with an Axopatch 200B amplifier (Molecular Devices) in the outside-out patch configuration. Data were digitized at 40 kHz using pClamp 9.0 and 10.0 (Molecular Devices). Patch pipettes were pulled from thick wall borosilicate glass (G150F-4, Warner Instruments) using a vertical puller (PC-10, Narishige). Pipette tips were coated with Sylgard-184 (Dow Corning) then fire polished to a final resistance of 8–11 megaohms. For analysis, recordings were low-pass filtered at 1 kHz using QuB software and idealized with SKM (39). Unitary current amplitudes were determined from a Gaussian fit of an all-points histogram (0.1 pA/bin) of single channel records that contained no overlapping openings. To determine burst open probability (Popen), clusters of bursts were first segmented by hand. Using MIL (40), separate bursts were defined and then separated into segments using ChpId (41). Finally, the open probability of each segment was calculated.
Statistical Analysis
All data metrics were compared with wild type receptors by multivariate analysis of variance using SPSS 17.0 software (IBM Co.) and MatLab (The Math Works, Inc.). Significance was held at p < 0.05 for Student's t test, pairwise test, and Dunnett's post hoc analysis. Tests compared each mutant response individually to the wild type response.
RESULTS
Deletion of the α1 ILD Altered the Apparent Affinity for GABA
We created and characterized two different α1 ILD deletion constructs (Fig. 2A). To compare the function of the GABAAR α1 subunit with a prokaryotic homolog, we replaced 80 α1 ILD residues with the heptapeptide from G. violaceus (IL-BAC). In addition, we replaced the ILD with seven lysine residues to investigate the effect of charge on ion permeation and channel gating (IL-7K). We assessed IL-BAC and IL-7K for changes in the GABA concentration response relative to WT receptors with macroscopic whole-cell recordings from transfected HEK cells (Fig. 2). Replacement of α1 ILD with the bacterial residues SQPARAA and the positive charges KKKKKKK, both, caused a significant decrease in GABA apparent affinity. EC50 values for WT, IL-BAC, and IL-7K were 51.6 ± 14.6, 144 ± 26.0, and 660 ± 172 μm, respectively (means ± S.E. of the mean (S.E.), n = 6). There were no changes induced in Hill slope, but both deletion constructs significantly increased current magnitude. IL-7K and IL-BAC elicited an ∼2 and ∼3-fold increase in current magnitude with values of −6250 ± 1210 and −9810 ± 462 pA, respectively, compared with the WT current value of −3230 ± 308 pA (n = 6).
FIGURE 2.

Deletion of ILD impaired channel function. A, shown are schematics of the wild type ILD sequence and two deletion constructs. Substituted residues are highlighted in gray. B, representative whole-cell current traces for WT, IL-BAC, and IL-7K are shown. Bars indicate the duration of GABA application and are labeled with the concentration (μm). C, the Hill equation fit of peak current data show significant shifts in GABA apparent affinity and significant increases in current magnitude caused by deletion of the α1 ILD; error bars denote S.E.; n = 6.
Point Mutations Near M3 Decreased GABA Apparent Affinity
We mutated acidic residues to lysine and basic residues to glutamate in a point-wise fashion. Of the 80 α1 ILD residues, 17 are positively charged, and 8 are negatively charged for a total of 25 point mutations. Most of these mutations did not significantly alter the apparent affinity of the receptor for GABA, the maximal response to GABA, or the Hill coefficient for the GABA concentration response relationship (Table 1). However, 6 of the 25 mutants showed a significant right shift in concentration response with an ∼2–3-fold increase in GABA EC50. In contrast, even the largest increase in apparent affinity, observed with α1(K329E), was not significantly different from WT (all tests, p > 0.05, Fig. 3). All but one of the significant shifts in apparent affinity is located in a 20-residue span between positions 312 and 332, the ILD segment contiguous with M3. Charge neutralization also shifted EC50 values (data not shown). The α1(K312E) charge-switch mutation caused a 2.0 ± 0.6-fold increase in EC50, whereas the α1(K312A) charge neutralization mutation only increased EC50 1.4 ± 1.7-fold, which was not significantly different from WT (Student's t test, p > 0.05; n = 3). Interestingly, a significant decrease in EC50 (14.1 ± 4.69 μm) was caused by the α1(D332A) charge neutralization mutation compared with WT (Student's t test, p < 0.05; n = 5).
TABLE 1.
Point-wise mutation of charged resides in the α1 ILD significantly increased apparent affinity and current magnitude
The indicated lysine or arginine residues were mutated to glutamate. The indicated glutamate or aspartate residues were mutated to lysine. Maximal current (Imax), GABA apparent affinity (EC50), and Hill coefficient (nH) values were determined from fitting peak current values to the Hill equation (see “Experimental Procedures”).
| Construct | EC50 | nH | Imax | n | Construct | EC50 | nH | Imax | n |
|---|---|---|---|---|---|---|---|---|---|
| μm | pA | μm | pA | ||||||
| WT | 53.0 ± 8.27 | 2.0 ± 0.07 | 3340 ± 294 | 34 | R354E | 109 ± 18.5a | 1.8 ± 0.10 | 4680 ± 668 | 8 |
| K312E | 108 ± 29.5a | 2.1 ± 0.38 | 3400 ± 735 | 11 | D356K | 92.7 ± 24.7 | 2.0 ± 0.08 | 3510 ± 804 | 10 |
| R313E | 78.9 ± 16.5 | 2.0 ± 0.13 | 2830 ± 540 | 12 | K364E | 30.7 ± 7.32 | 1.6 ± 0.10 | 3590 ± 724 | 10 |
| D318K | 105 ± 24.2a | 2.2 ± 0.16 | 6320 ± 842a,b | 10 | E369K | 88.9 ± 22.8 | 1.6 ± 0.17 | 4170 ± 680 | 11 |
| K320E | 117 ± 31.3a,b | 1.2 ± 0.16 | 5460 ± 938a | 10 | K371E | 53.2 ± 10.9 | 1.9 ± 0.15 | 4070 ± 810 | 4 |
| E325K | 89.2 ± 17.3 | 2.0 ± 0.13 | 3750 ± 635 | 8 | E372K | 65.2 ± 17.7 | 2.0 ± 0.13 | 4770 ± 1090 | 11 |
| K326E | 30.3 ± 6.64 | 2.6 ± 0.16 | 5860 ± 1090a | 10 | K374E | 51.5 ± 8.90 | 1.8 ± 0.08 | 5700 ± 625a | 16 |
| K328E | 104 ± 22.5a | 1.9 ± 0.19 | 6660 ± 1060a,b | 10 | E376K | 59.7 ± 13.7 | 1.9 ± 0.11 | 4280 ± 427 | 9 |
| K329E | 20.2 ± 3.89 | 2.9 ± 0.15 | 3760 ± 934 | 10 | K378E | 66.1 ± 10.6 | 2.0 ± 0.20 | 6090 ± 1210a | 10 |
| K331E | 38.1 ± 5.74 | 2.2 ± 0.18 | 5340 ± 1240 | 12 | E381K | 83.7 ± 13.2 | 1.8 ± 0.09 | 3530 ± 458 | 10 |
| D332K | 144 ± 25.8a,b | 1.6 ± 0.15 | 4500 ± 1240 | 10 | K383E | 50.5 ± 7.41 | 1.5 ± 0.17 | 4140 ± 550 | 11 |
| K336E | 27.5 ± 6.08 | 3.8 ± 1.3 | 5002 ± 1270a | 8 | K384E | 74.8 ± 15.3 | 1.8 ± 0.11 | 5990 ± 881a | 10 |
| K337E | 29.6 ± 6.92 | 2.5 ± 0.15 | 3510 ± 926 | 11 | K391E | 59.3 ± 17.6 | 1.7 ± 0.09 | 3420 ± 594 | 9 |
a Significant differences from WT were held at p < 0.05 for pairwise comparisons after multivariate analysis of variance; means are depicted ±S.E.
b Significant differences from WT were held at p < 0.05 for Dunnett's post hoc comparisons after multivariate analysis of variance; means are depicted ± S.E.
FIGURE 3.

GABA concentration-response for charge-switch mutations. A, shown are representative whole-cell current traces from WT, α1(K312E), and α1(K329E) receptor-containing cells. Bars indicate GABA application. B, the Hill equation fit of normalized peak current data shows no difference between WT and α1(K329E) but a significant increase in GABA EC50 with α1(K312E); pairwise comparison, p < 0.05; error bars denote S.E.; WT, n = 34; α1(K312E), n = 11; α1(K329E), n = 10.
The α1(K312E) Mutation Exhibited Impaired Gating
A shift in EC50 may be caused by changes in receptor gating or a change in structure propagated globally to alter the GABA binding site. Therefore, we constructed concentration response relationships from the same cell for both the partial agonist piperidine-4-sulfonic acid (P4S) and the full agonist GABA (Fig. 4). Cells expressing the α1(K312E) mutation yielded an ∼2-fold increase in EC50 with no other significant changes in the GABA concentration response (Table 1). P4S exhibited decreased efficacy in both WT and mutant receptor containing cells; however, the relative agonist efficacy (IP4S/IGABA) for α1(K312E) was significantly decreased compared with WT, 0.080 ± 0.035 and 0.190 ± 0.022 respectively (Student's t test p < 0.05; n = 3; Fig. 4). This change in IP4S/IGABA is consistent with a gating deficiency being introduced by the α1(K312E) mutation.
FIGURE 4.

The α1(K312E) mutation reduced relative efficacy of P4S. A, shown are structural similarities between full and partial agonists, GABA and P4S respectively. B, shown are averaged whole-cell current traces elicited with GABA (solid) and P4S (dashed) for WT and α1(K312E) receptor-containing cells; bars indicate agonist application with concentrations in μm. The same concentration range was used for full and partial agonists. C, the Hill equation fit of data normalized to the maximal GABA response showed a significant decrease in the relative agonist affinity ratio for the α1(K312E) mutation (open circles) compared with WT (solid circles); error bars denote S.E.; n = 3.
Mutation of ILD Charged Residues Increased the Speed of Receptor Desensitization
Desensitization is characterized by channel closure during the prolonged application of agonist. To determine whether charge-switch mutations induced changes in the desensitization component of gating, each macroscopic trace was fit with an exponential equation to determine a weighted time constant from currents elicited by maximally effective concentrations of GABA (see “Experimental Procedures”). Seven mutations had significantly enhanced rates of desensitization compared with WT with up to an ∼3-fold increase induced by the α1(K384E) mutation (Fig. 5A). To confirm these results were not confounded by slow solution exchange rates, we used a rapid application technique to verify one of the mutants (Fig. 5B); the ratio of weighted rate constants between WT and the α1(K378E) mutation remained constant at 2.5-fold when determined from both whole-cell and excised patch-generated traces.
FIGURE 5.

Charge-switches increased speed of desensitization. A, -fold increase in weighted desensitization (w) normalized to WT. Gray bars indicate mutations that were significantly different from WT; pairwise comparison, p < 0.05; error bars denote S.E.; WT, n = 30; mutations, n = 8–17. B, shown are normalized, representative currents elicited in excised outside-out macroscopic patches by 3 mm GABA from WT (black) and α1(K378E) (gray) receptor-containing patches; n = 3.
Current Voltage Relationship Confirms Anion Selectivity of WT Receptor
To determine the relative permeability of sodium and chloride in WT receptors, we replaced Na+ and Cl− ions with large impermeable ions of the same valence, N-methyl-d-glucamine and gluconate, respectively. WT receptor-containing cells had an experimentally determined reversal potential of −3.41 ± 1.85 mV in normal saline (n = 34; Fig. 6). There was a +3.82 ± 0.49-mV relative shift from normal to low sodium extracellular saline (ENS), which was not significantly different from the normal saline and confirmed that the cation permeability of the channel was negligible (n = 17; paired t test p > 0.05; Fig. 6A). Decreasing the extracellular chloride concentration caused a +35.8 ± 2.66-mV shift in reversal potential relative to the IV response in normal saline (ECS), which verified that the WT GABAAR was an anion-permeable channel (n = 17; paired t test p < 0.05; Fig. 6B). The theoretical shift in reversal potential that should have been caused by decreasing the extracellular chloride was +65.7 mV assuming the channel was impermeable to gluconate. This experimental deviation may be caused by a relative permeability to gluconate (PG/PCl) of ∼20%.
FIGURE 6.

Mutations induced a subdomain-dependent shift in anion permeability. IV relationships compare the WT response to maximally effective concentrations of GABA in normal (black) versus low sodium (white) (A) and normal (black) versus low chloride (gray) extracellular salines (B). IV data were gathered in each of the ion replacement solutions so that the relative shift in reversal potential could be determined for each patch. Each trace was normalized by its maximal response to GABA at −60 mV in the normal saline, then the up and down component of each ramp was averaged. Data points depict the mean, and error bars depict the S.E. There was no significant difference in reversal between the normal and low sodium salines; paired t test, p > 0.05. The low chloride extracellular saline caused a significant shift in reversal potential; paired t test, p < 0.05. C, relative shifts in current reversal caused by low sodium versus normal (ENS; white) and low chloride versus normal (ECS; gray) extracellular salines are shown ± S.E. Dotted lines represent the S.E. margins for WT, n = 17; mutations, n = 5; significance held at p < 0.05 for Dunnett's post hoc (‡) and Student's t test (*).
ILD Residues Contribute to Ion Permeation Pathway
We hypothesized that amino acids with ionizable side chains lining the pore lumen make important electrostatic interactions with permeant ions to establish the permeability of the pore. Therefore, switching the charge of such residues should perturb this interaction, causing a shift in reversal potential. For example, an increase in the relative permeability to sodium (PNa/PCl) will cause a negative relative shift in current reversal when the extracellular concentration of sodium is decreased. Of the 26 charge-switches made, none resulted in a negative ENS (Fig. 6C). Furthermore, none of the mutations were significantly different from WT in regard to relative sodium permeability (Student's t test p > 0.05).
Six charge-switch mutations located in both flanks of the ILD significantly increased ECS (Fig. 6C). For example, the α1(K320E) and α1(K378E) mutations exhibited ECS = +47.9 ± 2.45 and +46.5 ± 2.61 mV relative shift values in low chloride, which may be caused by an ∼50% decreased relative permeability to gluconate, PG/PCl = 0.10 ± 0.02 and 0.09 ± 0.02 respectively, compared with WT, PG/PCl = 0.21 ± 0.03. Interestingly, although the α1(E372K) charge-switch mutation positively shifted ECS compared with WT (Fig. 6C), introduction of positive charge at the neighboring neutral α1(V373) position did not significantly shift the relative reversal potential in low chloride conditions compared with WT (Student's t test, p > 0.05; n = 3; data not shown).
Mutations in ILD Altered Single Channel Properties
We observed that charge-switch mutations caused two main changes in channel function; that is, a gating impairment as observed by decreased apparent GABA affinity and a shift in reversal potential in low chloride extracellular saline accompanied by faster desensitization. We chose residues from both groups for further characterization. Specifically, α1(K328E) showed a significant increase in EC50, and α1(K378E) increased the speed of desensitization and altered anion permeability. We recorded single channel responses for WT and each mutation from membrane patches in the outside-out configuration and observed unique differences in single channel activity. First, channels harboring the α1(K328E) mutation exhibited an increase in mean burst open probability (Table 2). Second, compared with WT, channels harboring the α1(K378E) mutation exhibited an ∼30% decrease in unitary current amplitude (Fig. 7 and Table 2).
TABLE 2.
Charge-switch mutations altered burst open probability and amplitude of single channel current amplitudes
Single channel recordings were gathered from outside-out patches held at −80 mV in extracellular saline containing 3 mm GABA; means are depicted ±95% confidence interval of fit. Some values were not determined (ND) for both mutants.
| Measurement | WT | K328E | K378E |
|---|---|---|---|
| Unitary current (pA) | −2.03 ± 0.007 | −1.97 ± 0.029 | −1.37 ± 0.057a |
| Burst Popen | 0.79 ± 0.017 | 0.86 ± 0.003 | 0.75 ± 0.006 |
| Chord conductance (picosiemens) | 26.1 ± 5.09 | ND | 17.2 ± 5.82 |
| Reversal Potential (mV) | −1.20 ± 10.2 | ND | −7.45 ± 19.4 |
a Mutants were compared to WT by the Student's t test with significance held at p < 0.05, n = 3.
FIGURE 7.

Single channel properties of charge-switch mutants. A, single channel currents from outside-out patches containing WT, α1(K328E), and α1(K378E) receptors elicited with bath application of 3 mm GABA. After analysis, a 60-Hz notch filter was applied for better visualization of openings. Open and closed levels are denoted by O and C, respectively. B, shown is an all-points histogram of current amplitudes with 0.01 pA/bin. Current amplitudes were fit with Gaussian functions to determine open and closed distributions; n = 3.
The α1(K378E) Mutant Decreased Conductance
To verify the difference in current amplitude between WT and α1(K378E), single channel currents were recorded from outside-out patches at membrane holding potentials from −80 to +60 mV. The α1(K378E) mutation caused a decrease in chord conductance and a modest negative shift in reversal potential compared with WT (Table 2 and Fig. 8).
FIGURE 8.

The α1(K378E) mutation decreased chord conductance. A, shown are single channel currents from outside-out patches containing WT and α1(K378E) receptors at membrane holding potentials of +20 and +40 mV. Open and closed levels are denoted by O and C, respectively. B, IV relationship of WT (solid) and α1(K378E) (dashed) single channel currents.
DISCUSSION
To date the importance of the GABAAR M3-M4 intracellular loop in defining ion channel activity has not been comprehensively addressed. Previous studies of pLGIC ILDs have focused on receptor surface stability, mobility (16, 17, 22), phosphorylation (26, 27), binding interactions with accessory proteins (23), and trafficking machinery (19). Recent studies point to an intracellular component of desensitization (42–44), and intracellular control of conductance has been linked to the MA stretch (29, 34), but this has yet to be confirmed for the GABAAR.
Deletion of the ILD
High resolution structures of prokaryotic pLGICs, which lack the M3-M4 intracellular loop, have brought into question the importance of the ILD for channel activation (1, 3). Deletion of this domain in homomeric 5-HT3R and GABACR resulted in functional, surface-expressing receptors in oocytes, suggesting this domain is not necessary for channel activity (45). However, these constructs exhibited noteworthy changes in channel conductance and agonist apparent affinity, underscoring the importance of this domain for receptor activity. In our study, deletion of the GABAAR α1 ILD produced significant changes in channel function (Fig. 2), matching the effects of similar deletions in other pLGICs (45). At present, the theory of ion permeation in pLGICs relies on the concept that canonical rings of charged residues make integral electrostatic interactions with permeant ions to control permeation and selectivity (10, 12). Recent functional data in 5-HT3R, nAChR, and GlyR demonstrated that the ILD also plays a role in this process (29, 31, 32, 35). Therefore, we hypothesized that deletion of the α1 ILD of the GABAAR would change the effective geometry of the permeation pathway. The results presented here show that the ILD of the GABAAR α1 subunit is involved in controlling ion flow across the membrane. The reduced rate of ion permeation observed with the IL-7K construct compared with the mostly neutral bacterial heptapeptide is consistent with the positively charged lysine residues providing a stronger attractive force on the permeant chloride ions.
Deletion constructs also exhibited altered GABA apparent affinity as evidenced by large shifts in EC50. This suggests that the tertiary structure of the ILD must be intact for proper channel gating to occur. Taken together, the results of our deletion experiments established an important role for the GABAAR α1 ILD architecture in controlling the function of the ion channel, as has been observed with other members of the pLGIC family.
Subdomains of the ILD
The ILDs of GABAAR have a higher degree of variability compared with the LBD and the TMD in terms of side chain conservation and loop length. A simple sequence alignment of pLGIC ILDs highlights this variability but also suggests some local conservation (Fig. 1); the first ∼20 and last ∼40 residues of the ILD, i.e. those contiguous with M3 and M4, are regions of the protein that contain a large number of strongly conserved charged residues. We observed that charge-switches close to M3 predominantly resulted in receptors with altered gating. On the other hand, charge-switch mutants close to M4 resulted in receptors with enhanced desensitization. Importantly, mutations within both putative subdomains caused a shift in reversal potential in low chloride extracellular saline, which suggests the existence of an intracellular anion selectivity filter. We hypothesized that in the GABAAR these two membrane-associated subdomains, deemed M3A and M4A respectively, define a portion of the permeation pathway (Fig. 1).
The M3A Subdomain
We defined M3A as the 21 residues between positions α1(Lys-312) and α1(Asp-332), containing 10 charged amino acids (Fig. 1). Charge-switch mutation of five of these residues caused a decrease in GABA apparent affinity (Fig. 3; Table 1). Charge neutralization at α1(K312) and α1(D332) also shifted EC50 values, underscoring the importance of the native charged residues in normal channel function.
It is important to note that a mutation that causes a change in agonist EC50 may do so by altering either receptor gating or ligand binding. These properties are intrinsically linked as ligand binding and ion channel activation are separate events within a well defined Markovian process with many states (46, 47). Binding studies and electrophysiological assays only give a readout of a subset of these states and cannot definitively isolate the individual contributions of different receptor states to mutant receptor function. Therefore, although the results presented here are consistent with changes in receptor gating, we cannot unambiguously rule out that some changes in ligand binding may have also occurred in the LBD as a result of the ILD mutation. Nevertheless, a comparison of the relative efficacy of full and partial agonists acting on WT and α1(K312E) containing receptors does suggest that the observed increase in EC50 was likely due to a gating impairment (Fig. 4). GABA and P4S are structurally similar (Fig. 4A) and bind at the same orthosteric site, but the partial agonist is less efficacious in stabilizing the open state of the ion channel. Furthermore, this subdomain is continuous with M3, which has been shown to move during channel gating (48). Therefore, we propose that charged residues within M3A also undergo movement upon channel activation, and by switching these charges we have impeded this movement.
Mutation of M3A residues also induced shifts in the relative reversal potential caused by decreasing extracellular chloride. For example, the α1(K320E) charge-switch mutation positively shifted ECS compared with WT (Fig. 6). Again, this suggests that within the α1 subunit of the GABAAR, permeation pathway is not solely defined by residues in the LBD, the M1-M2 linker, and M2.
The M4A Subdomain
M4A was defined by a 39-residue region between positions α1(Arg-354) and α1(Lys-391) (Fig. 1). Charge-switches throughout the ILD, but mostly near M4, increased the speed of desensitization (Fig. 5). A similar effect has been observed in the 5-HT3R, where a single intracellular arginine near M4 has also been shown to control receptor desensitization (43). In our sequence alignment, this arginine is homologous to α1(Lys-383) (Fig. 1); the charge-switch mutation, α1(K383E), at this position induced a significant increase in desensitization rate (Fig. 5). Interestingly, the neighboring α1(K384E) mutation caused the largest fold increase in desensitization. These results suggest that ILD M4A residues modulate specific components of channel gating, i.e. those that define the desensitization gate.
The mutation of charged residues near M4 has been shown to alter single channel conductance in homomeric 5-HT3R and GlyRs; in both cases the mutations were made within a putative homolog of the MA stretch (29, 32). In our study α1(K378E) induced a significant decrease in single channel chord conductance (Figs. 7 and 8; Table 2). This result confirmed our hypothesis that ILD residues play a key role in coordinating ions as they pass along the permeation pathway and through the ion channel. The linear nature of the single channel chord conductance (Fig. 8) also reveals that there is no voltage dependence to the activation of the ion channel under the conditions used in this study. Although the simplest explanation for the decreased current amplitude is a reduction in the single channel conductance, other explanations are possible. For example, it is conceivable that the mutation alters the ability of the membrane potential to invade the permeation pathway. If the mutation alters the distance over which the membrane potential is distributed or focused, this might have the effect of decreasing local field strength in the permeation pathway, reducing the force on individual ions and, hence, reducing single channel current amplitude. Nevertheless, it is clear from these results that α1(K378) is intimately involved with mechanisms directing the permeation of ions through the GABAAR.
There were significant changes in channel permeability to anions caused by mutating GABAAR M4A-charged residues (Fig. 6). Within this subdomain, introduction of a lysine at position α1(V373) did not shift ECS, suggesting that changes in permeability were position-specific and not merely due to a global change in the electrostatic environment of the M4A subdomain. Interestingly, charged residues within both ILD subdomains were shown to control anion permeation. Increased relative reversal potentials translated to a decreased permeability to gluconate that may reflect a decrease in the diameter of the intracellular pore entrance. Alternatively, point mutations may have electrostatically occluded the pore to impair gluconate permeation. Our results are consistent with the hypothesis that intracellular residues of the GABAAR α1 subunit influence ion permeation and demonstrate that residues within both the M3A and M4A subdomain likely line the channel pore.
In summary, we have shown that the ILD must be intact for proper receptor activity to occur as the charged residues of the GABAAR α1 subunit ILD play a critical role in controlling channel gating and ion permeation. Furthermore, our results suggest the existence of novel functional subdomains of the ILD that mediate specific aspects of channel activity. We have shown that specific charged residues within both membrane-associated subdomains control different facets of channel gating; M3A residues contributed to agonist-dependent gating, whereas M4A residues mediated the time course of receptor desensitization. Positions within both subdomains were shown to line a novel portion of the pore lumen by influencing channel conductance and altering anion permeation. The GABAAR is defined by a diverse complement of subunits with unique properties, and future studies will be necessary to determine whether these ILD contributions to channel function are subunit-specific. Our findings have established a novel role for the M3-M4 intracellular loop in the α1 subunit of the GABAAR. Importantly, our findings taken together with other recent advances (29–35) suggest a critical role for ILD-charged residues in pLGIC function.
Acknowledgments
We greatly appreciate the gift of cDNAs for the human α1, β2, and γ2s subunits from Dr. Neil L. Harrison, Ph.D. (Columbia University, New York) and the gift of cDNA for adeno-associated virus GFP from Dr. Trent Spencer, Ph.D. (Emory University, Atlanta, GA). We thank Dr. Carrie Williams, Ph.D. for helpful discussions and Joseph M. Carlson for technical support.
This work was supported, in whole or in part, by National Institutes of Health Grant GM073959.
- GABAAR
- GABA type A receptor
- pLGIC
- pentameric ligand gated ion channel
- 5-HT3R
- ionotropic serotonin receptor
- nAChR
- nicotinic acetylcholine receptor
- GlyR
- glycine receptor
- LBD
- ligand binding domain
- TMD
- transmembrane domain
- M1
- first transmembrane domain
- ILD
- intracellular loop domain
- MA
- membrane-associated
- P4S
- piperidine-4-sulfonic acid.
REFERENCES
- 1. Corringer P. J., Baaden M., Bocquet N., Delarue M., Dufresne V., Nury H., Prevost M., Van Renterghem C. (2010) J. Physiol. 588, 565–572 [DOI] [PMC free article] [PubMed] [Google Scholar]
- 2. Noda M., Takahashi H., Tanabe T., Toyosato M., Kikyotani S., Furutani Y., Hirose T., Takashima H., Inayama S., Miyata T., Numa S. (1983) Nature 302, 528–532 [DOI] [PubMed] [Google Scholar]
- 3. Bocquet N., Nury H., Baaden M., Le Poupon C., Changeux J. P., Delarue M., Corringer P. J. (2009) Nature 457, 111–114 [DOI] [PubMed] [Google Scholar]
- 4. Cromer B. A., Morton C. J., Parker M. W. (2002) Trends Biochem. Sci. 27, 280–287 [DOI] [PubMed] [Google Scholar]
- 5. Kash T. L., Trudell J. R., Harrison N. L. (2004) Biochem. Soc. Trans. 32, 540–546 [DOI] [PubMed] [Google Scholar]
- 6. Keramidas A., Kash T. L., Harrison N. L. (2006) J. Physiol. 575, 11–22 [DOI] [PMC free article] [PubMed] [Google Scholar]
- 7. Mercado J., Czajkowski C. (2006) J. Neurosci. 26, 2031–2040 [DOI] [PMC free article] [PubMed] [Google Scholar]
- 8. Xiu X., Hanek A. P., Wang J., Lester H. A., Dougherty D. A. (2005) J. Biol. Chem. 280, 41655–41666 [DOI] [PubMed] [Google Scholar]
- 9. Hansen S. B., Wang H. L., Taylor P., Sine S. M. (2008) J. Biol. Chem. 283, 36066–36070 [DOI] [PMC free article] [PubMed] [Google Scholar]
- 10. Imoto K., Busch C., Sakmann B., Mishina M., Konno T., Nakai J., Bujo H., Mori Y., Fukuda K., Numa S. (1988) Nature 335, 645–648 [DOI] [PubMed] [Google Scholar]
- 11. Jensen M. L., Pedersen L. N., Timmermann D. B., Schousboe A., Ahring P. K. (2005) J. Neurochem. 92, 962–972 [DOI] [PubMed] [Google Scholar]
- 12. Jensen M. L., Schousboe A., Ahring P. K. (2005) J. Neurochem. 92, 217–225 [DOI] [PubMed] [Google Scholar]
- 13. Wotring V. E., Chang Y., Weiss D. S. (1999) J. Physiol. 521, 327–336 [DOI] [PMC free article] [PubMed] [Google Scholar]
- 14. Wotring V. E., Weiss D. S. (2008) J. Gen Physiol. 131, 87–97 [DOI] [PMC free article] [PubMed] [Google Scholar]
- 15. Xu M., Akabas M. H. (1996) J. Gen Physiol. 107, 195–205 [DOI] [PMC free article] [PubMed] [Google Scholar]
- 16. Brandon N. J., Bedford F. K., Connolly C. N., Couve A., Kittler J. T., Hanley J. G., Jovanovic J. N., Uren J., Taylor P., Thomas P., Smart T. G., Moss S. J. (1999) Biochem. Soc. Trans. 27, 527–530 [DOI] [PubMed] [Google Scholar]
- 17. Connolly C. N., Kittler J. T., Thomas P., Uren J. M., Brandon N. J., Smart T. G., Moss S. J. (1999) J. Biol. Chem. 274, 36565–36572 [DOI] [PubMed] [Google Scholar]
- 18. Jovanovic J. N., Thomas P., Kittler J. T., Smart T. G., Moss S. J. (2004) J. Neurosci. 24, 522–530 [DOI] [PMC free article] [PubMed] [Google Scholar]
- 19. Michels G., Moss S. J. (2007) Crit. Rev. Biochem. Mol. Biol. 42, 3–14 [DOI] [PubMed] [Google Scholar]
- 20. Mizokami A., Kanematsu T., Ishibashi H., Yamaguchi T., Tanida I., Takenaka K., Nakayama K. I., Fukami K., Takenawa T., Kominami E., Moss S. J., Yamamoto T., Nabekura J., Hirata M. (2007) J. Neurosci. 27, 1692–1701 [DOI] [PMC free article] [PubMed] [Google Scholar]
- 21. Nymann-Andersen J., Sawyer G. W., Olsen R. W. (2002) J. Neurochem. 83, 1164–1171 [DOI] [PubMed] [Google Scholar]
- 22. Perán M., Hooper H., Boulaiz H., Marchal J. A., Aránega A., Salas R. (2006) Cell Motil. Cytoskeleton 63, 747–757 [DOI] [PubMed] [Google Scholar]
- 23. Chen Z. W., Olsen R. W. (2007) J. Neurochem. 100, 279–294 [DOI] [PubMed] [Google Scholar]
- 24. Mukerjee J., Maric H. M., Harvey K., Schindelin H., Moss S. J. (2010) Neuroscience Meeting Planner, Program No. 239.4, online, Society for Neuroscience, San Diego, CA, [Google Scholar]
- 25. Tretter V., Jacob T. C., Mukherjee J., Fritschy J. M., Pangalos M. N., Moss S. J. (2008) J. Neurosci. 28, 1356–1365 [DOI] [PMC free article] [PubMed] [Google Scholar]
- 26. Leidenheimer N. J., Browning M. D., Harris R. A. (1991) Trends Pharmacol. Sci. 12, 84–87 [DOI] [PubMed] [Google Scholar]
- 27. Smart T. G. (1997) Curr. Opin Neurobiol. 7, 358–367 [DOI] [PubMed] [Google Scholar]
- 28. Unwin N. (2005) J. Mol. Biol. 346, 967–989 [DOI] [PubMed] [Google Scholar]
- 29. Carland J. E., Cooper M. A., Sugiharto S., Jeong H. J., Lewis T. M., Barry P. H., Peters J. A., Lambert J. J., Moorhouse A. J. (2009) J. Biol. Chem. 284, 2023–2030 [DOI] [PubMed] [Google Scholar]
- 30. Deeb T. Z., Carland J. E., Cooper M. A., Livesey M. R., Lambert J. J., Peters J. A., Hales T. G. (2007) J. Biol. Chem. 282, 6172–6182 [DOI] [PubMed] [Google Scholar]
- 31. Hales T. G., Dunlop J. I., Deeb T. Z., Carland J. E., Kelley S. P., Lambert J. J., Peters J. A. (2006) J. Biol. Chem. 281, 8062–8071 [DOI] [PubMed] [Google Scholar]
- 32. Kelley S. P., Dunlop J. I., Kirkness E. F., Lambert J. J., Peters J. A. (2003) Nature 424, 321–324 [DOI] [PubMed] [Google Scholar]
- 33. Livesey M. R., Cooper M. A., Deeb T. Z., Carland J. E., Kozuska J., Hales T. G., Lambert J. J., Peters J. A. (2008) J. Biol. Chem. 283, 19301–19313 [DOI] [PMC free article] [PubMed] [Google Scholar]
- 34. Peters J. A., Cooper M. A., Carland J. E., Livesey M. R., Hales T. G., Lambert J. J. (2010) J. Physiol. 588, 587–596 [DOI] [PMC free article] [PubMed] [Google Scholar]
- 35. Davies P. A., Pistis M., Hanna M. C., Peters J. A., Lambert J. J., Hales T. G., Kirkness E. F. (1999) Nature 397, 359–363 [DOI] [PubMed] [Google Scholar]
- 36. Lo W. Y., Botzolakis E. J., Tang X., Macdonald R. L. (2008) J. Biol. Chem. 283, 29740–29752 [DOI] [PMC free article] [PubMed] [Google Scholar]
- 37. Chen C., Okayama H. (1987) Mol. Cell. Biol. 7, 2745–2752 [DOI] [PMC free article] [PubMed] [Google Scholar]
- 38. Hille B. (2001) Ion Channels of Excitable Membranes, 3rd Ed., Sinauer Associates, Inc., Sunderland, MA [Google Scholar]
- 39. Qin F. (2004) Biophys. J. 86, 1488–1501 [DOI] [PMC free article] [PubMed] [Google Scholar]
- 40. Qin F., Auerbach A., Sachs F. (1996) Biophys. J. 70, 264–280 [DOI] [PMC free article] [PubMed] [Google Scholar]
- 41. Qin F., Auerbach A., Sachs F. (1997) Proc. Biol. Sci. 264, 375–383 [DOI] [PMC free article] [PubMed] [Google Scholar]
- 42. Breitinger H. G., Villmann C., Rennert J., Ballhausen D., Becker C. M. (2002) J. Neurochem. 83, 30–36 [DOI] [PubMed] [Google Scholar]
- 43. Hu X. Q., Sun H., Peoples R. W., Hong R., Zhang L. (2006) J. Biol. Chem. 281, 21781–21788 [DOI] [PubMed] [Google Scholar]
- 44. Kuo Y. P., Xu L., Eaton J. B., Zhao L., Wu J., Lukas R. J. (2005) J. Pharmacol. Exp. Ther. 314, 455–466 [DOI] [PubMed] [Google Scholar]
- 45. Jansen M., Bali M., Akabas M. H. (2008) J. Gen. Physiol. 131, 137–146 [DOI] [PMC free article] [PubMed] [Google Scholar]
- 46. Colquhoun D. (1998) Br. J. Pharmacol. 125, 924–947 [DOI] [PMC free article] [PubMed] [Google Scholar]
- 47. Jones M. V., Westbrook G. L. (1995) Neuron 15, 181–191 [DOI] [PubMed] [Google Scholar]
- 48. Williams D. B., Akabas M. H. (1999) Biophys. J. 77, 2563–2574 [DOI] [PMC free article] [PubMed] [Google Scholar]