Background: Mitochondrial dysfunction occurs in many tissues during normal aging.
Results: Aged neural progenitor cells (NPCs) have decreased regenerative capacity, fewer functional mitochondria, and less oxygen consumption compared with young adult NPCs.
Conclusion: Coordinated changes in proteomics, subcellular structure, and physiology demonstrate an altered metabolic strategy in aged NPCs.
Significance: Such alterations may explain the age-dependent responses to hypoxia encountered during tumor or stroke.
Keywords: Aging, Metabolism, Mitochondrial DNA, Neural Stem Cell, Proteomics
Abstract
Although neurogenesis occurs in discrete areas of the adult mammalian brain, neural progenitor cells (NPCs) produce fewer new neurons with age. To characterize the molecular changes that occur during aging, we performed a proteomic comparison between primary-cultured NPCs from the young adult and aged mouse forebrain. This analysis yielded changes in proteins necessary for cellular metabolism. Mitochondrial quantity and oxygen consumption rates decrease with aging, although mitochondrial DNA in aged NPCs does not have increased mutation rates. In addition, aged cells are resistant to the mitochondrial inhibitor rotenone and proliferate in response to lowered oxygen conditions. These results demonstrate that aging NPCs display an altered metabolic phenotype, characterized by a coordinated shift in protein expression, subcellular structure, and metabolic physiology.
Introduction
Neural progenitor cells (NPCs),3 which retain the capacity to produce new neurons in the adult mammalian brain, reside in the subventricular zone (SVZ) of the lateral ventricle and the subgranular zone of hippocampal dentate gyrus. However, rates of neurogenesis decline in both areas during normal aging (1, 2), and this phenomenon is correlated with cognitive decline (3, 4). Factors shown to regulate the rate of adult neurogenesis include both cell-intrinsic factors (5, 6) and factors within the microenvironment, or neurogenic niche (2, 7, 8). Disruptions to stem cell regulatory mechanisms, such as tumor suppressor pathways, have been shown to occur in NPCs during normal aging (5, 9). Several of these regulatory proteins participate in both cell cycle control and glycolytic-mitochondrial coupling (10, 11), disruptions in which are hallmarks of cancer (12, 13). Several recent studies convincingly argue that the neural stem cell is the cell of origin of adult-onset brain tumors and that aged NPCs form more malignant tumors (9, 14). Therefore, the metabolic characteristics of normal aging NPCs may give insight into events that precede or accompany oncogenic transformation.
Mitochondrial dysfunction is known to be important in many tissues during normal aging (15) and in neurons under pathological conditions such as Parkinson disease (16). However, mitochondrial function has not been studied in aging neural stem cells. A dysregulation of energetic supply and demand in aging cells can compound oxidative stress and lead to accumulation of random mutations in mitochondrial DNA (mtDNA; 17, 18); for example, mitochondrial damage due to oxidative stress has been shown to cause toxicity to neurons, leading to disease and cell death (19). Alternatively, a tight correlation between mitochondrial mass and metabolic activity in a cell type over the course of the lifespan would provide evidence for a dynamic system capable of adjusting to changing energetic supply and demand.
In this report, we present the first comparative proteomic analysis between young and aged NPCs, which yielded age-related changes in abundance of proteins involved in cellular metabolism. In support of these results, we report the novel finding that aging NPCs have decreased mitochondrial mass, corresponding with lower oxygen consumption and increased resistance to mitochondrial inhibition. These findings have implications for the understanding of normal aging and age-related pathologies, providing a potential mechanism by which aging NPCs could adapt to nutrient deprivation and hypoxia, with relevance to environmental conditions encountered in tumor and stroke.
EXPERIMENTAL PROCEDURES
NPC Isolation
All experiments were performed as approved by the University of Washington Institutional Animal Care and Use Committee (IACUC). Female C57BL/6 mice were housed at 21 °C with access to food and water ad libitum. Adult NPCs were isolated as described previously (20). Briefly, wild-type C57BL/6 mice, 3 months and 15–18 months of age, were perfused transcardially with cold saline. Forebrain tissue was mechanically and enzymatically dissociated, then the cell suspension was mixed with a Percoll solution and centrifuged. The isolated progenitor cells were grown in proliferation medium, consisting of DMEM/F12 supplemented with 2 mm glutamine, 1% N2 (Invitrogen), 20 μg/ml heparin (Sigma), 20 ng/ml EGF (Peprotech, Rocky Hill, NJ), and 20 ng/ml basic FGF (Peprotech). Cultures were used for experiments between passages 3 and 12. Cellular assays were performed in triplicate at least three times, at 21% oxygen, unless otherwise indicated. Comparisons between age groups were performed with two-tailed t tests in Excel unless otherwise indicated.
Cellular Assays
A serial-dilution sphere-forming assay was performed as described (21). Briefly, cells were plated at serial dilutions between 5 and 1000 cells in 100 μl/well in a 96-well plate, with 12 replicants per dilution. After allowing cells 1 week of growth, the number of neurospheres/well was quantified. Significance of the effect of age on sphere count was determined by linear regression analysis performed in SPSS, adjusting for concentration, passage number, and interaction effect.
To characterize multipotency of cells, NPCs were plated in 24-well plates on glass coverslips coated with laminin and poly-l-lysine (Sigma) overnight in proliferation medium. The growth medium was then replaced by differentiation medium, and cultures were maintained for 10 days. Differentiation medium consisted of neurobasal medium with 2 mm glutamine, supplemented with 2% B27 (Invitrogen) + 20 ng/ml brain-derived neurotrophic factor for neurons and 1% N2 (Invitrogen) + 10% fetal bovine serum for astrocytes. Cells were fixed in 4% paraformaldehyde. Neurons were labeled with anti-MAP2 mouse antibody (Sigma M1406, 1:500) and astrocytes with anti-glial fibrillary acidic protein rabbit antibody (Daco Z0334, 1:700).
Live cells were plated on poly-l-lysine-coated coverslips and exposed to 1× JC1 dye (Biotium 30001) for 90 min, then coverslipped and photographed at ×60 using confocal fluorescence microscopy. The number of JC1+ mitochondria in each cell within a z-stack image was quantified. In healthy mitochondria, which maintain electric potentials required for normal function, JC1 dye forms aggregates detected as red fluorescence (termed JC1+ here). Citrate synthase (22) activity was quantified using a commercially available kit (Sigma CS0720). CS, the rate-limiting enzyme in the TCA cycle, is exclusive to the mitochondrial matrix and proportional to mitochondrial mass. Cell number and viability were quantified using the automated ViCell system after cells were plated at 106 cells/dish and incubated for 4 days. Rotenone (Sigma R8875) was diluted in medium before adding to cells. LD50 was calculated by applying best-fit lines to cell death data at various rotenone concentrations and solving for 50% death with drug treatment.
Oxygen consumption and lactate production were measured in young and aged NPC cultures simultaneously under flow culture conditions as described previously (23). This metabolic perfusion chamber utilizes an ultrastable oxygen sensor based on the detection of the decay of the phosphorescent emission from an oxygen-sensitive dye, applied within a previously designed flow culture system. Lactate was measured enzymatically using a fluorometer (model 2390A; American Instrument Co., Silver Spring, MD). Measurements of metabolic activity were taken over several time points and collected in two independent experiments.
Mutation frequency in mtDNA was quantified by the random mutation capture assay, as described previously (24). This methodology is a single-molecule sequencing approach, which selects mutation sites by digesting wild-type molecules at a known restriction site (TaqI). The initial digestion step purifies the mutated mtDNA; mutated sites within the genes 12 S and ND5 are thus selected by a single round of real-time PCR amplification, thus speeding the process of mutation discovery by disassociating it from the fidelity of PCR amplification. Mitochondrial DNA content was normalized to nuclear DNA content using a QPCR control. Mutation frequencies were compared by two-tailed t tests performed.
Comparative Proteomic Analysis
Live cells were labeled over multiple passages using stable isotope labeling with amino acids in cell culture (SILAC). Isotope-labeled lysates were collected and subjected to orthogonal fractionation (22). Proteins were combined, then sorted by size with one-dimensional gel electrophoresis. The gel was divided into 10 sectors, and two of these sectors were selected for comparison. Proteins were digested and purified with polymeric sorbent MCX columns. The purified labeled peptides were then separated and analyzed with an LCQ system linked directly to two alternating reversed-phase C18 columns, followed by analysis with MS/MS to assay relative protein abundance between isotope-labeled groups. Proteins from the mixture were later identified using the computer program Sequest, which searched MS/MS spectra against the International Proteins Index database. Potential peptides and proteins were further analyzed by newly developed computer software to select proteins with high probability of being correct (<5% error rate). Relative protein abundance between groups was calculated using a specialized algorithm, the Automated Statistical Analysis of Protein abundance (ASAP) ratio. Proteins with significantly differing abundance (>20% ASAP ratio, aged(light chain):young(heavy chain) were grouped by primary cellular function, as listed in the International Proteins Index IPI database. Relative abundance of select proteins identified with MS/MS were verified by Western blotting. Seven pairs of lysates from primary cultures were collected for analysis. Membranes were blocked in 5% donkey serum, then incubated overnight in rabbit polyclonal primary antibodies phosphoglycerate kinase 1 (Abcam, AB38007) and septin 9 (Santa Cruz, SC130263). Blots were visualized using secondary antibodies conjugated to horseradish peroxidase, and normalized to β-actin (Abcam AB8227). Blots were analyzed with ImageJ software (National Institutes of Health).
Tissue Histology
To quantify active mitochondria in young adult and aged adult NPCs, the brains of mice aged 3 months (n = 4) and 20 months (n = 4) were removed and serially sectioned into 20-μm slices. Tissue sections were stained on glass slides after being subjected to antigen capture using 0.01 m sodium citrate and 2 n HCl. Tissue was stained with anti-Nestin goat polyclonal antibody (Santa Cruz SC-21249, 1:250) and anti-complex V mouse monoclonal antibody (Mitoscience MS507, 1:250) or anti-BrdU (mouse monoclonal antibody, BD Biosciences 347580, 1:100) and anti-voltage-dependent anion channel (VDAC) rabbit polyclonal antibody (Cell Signaling 4866S, 1:200). Mitochondrial counts were quantified in blinded photomicrographs of Nestin+ and BrdU+ NPCs (n = 12/animal) within the SVZ. A region of interest was defined in Nestin+ cells with similarly sized rings covering Nestin+ areas in the perinuclear region of each labeled cell. VDAC+ mitochondria were quantified in the perinuclear region defined by BrdU and DAPI staining. Photomicrographs of 10–20 consecutive optical images were used for quantification. For purposes of presentation, single optical planes of mitochondrial markers were selected to depict perinuclear mitochondria in Nestin+ and BrdU+ cells. Mitochondrial content was compared between groups using a two-tailed t test.
RESULTS
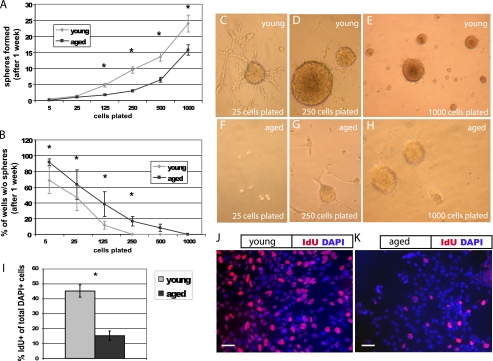
To determine the proliferative capacity of isolated young adult and aged adult NPCs, we quantified sphere formation using a serial dilution assay (21), plating cells in 96-well plates at various densities for 1 week prior to quantification (Fig. 1). Aged cells formed fewer neurospheres than young cells (p < 0.01, Fig. 1A). Aged cells also produced more wells with no spheres at each dilution (p < 0.01, Fig. 1B); aged cells were 14.6 times more likely than young cells to have no spheres per well. Young cultures produced one sphere for every 24 cells, whereas aged cultures produced one sphere for every 55 cells. In addition, more young cells (Fig. 1J) incorporate the thymidine analog IdU than aged cells (Fig. 1K) after a 30-min pulse (p < 0.05, Fig. 1I). These data suggest that fewer aged cells are actively cycling, although the two cultures are immunophenotypically similar, with no significant differences in Nestin, Sox2, or CD133 labeling (data not shown).
FIGURE 1.
Aged NPCs have a lower proliferative index. Cells were plated at serial dilutions in 96-well plates. After 1 week, neurospheres were quantified. A, NPCs derived from the young adult forebrain produced more neurospheres at nearly every plating dilution compared with those from the aged adult forebrain (p < 0.01, linear regression analysis; error bars, S.E.). B, aged cells produced more wells with no spheres at each dilution (B, p < 0.01, linear regression analysis). C–H, cultures from the young adult (C–E) and aged adult brain (F–H) are shown, after 1 week, at original plating dilutions of 25 cells (C and F), 250 cells (D and G), and 1000 cells (E and H). I, aged cells incorporate significantly less of the thymidine analog IdU during a 30-min pulse compared with young cells (p < 0.05). J and K, pictured are young (J) and aged (K) NPCs labeled with the nuclear marker DAPI (blue) and IdU (red). Scale bars, 10 μm.
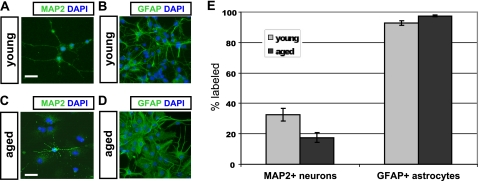
To ascertain the multipotency of cells from each culture, we determined the differentiative capacity of young and aged cells (Fig. 2). Under permissive conditions, cells of each age are capable of differentiating into neurons (Fig. 2, A and C) and astrocytes (Fig. 2, B and D), as identified by morphological characteristics and labeling with appropriate immunomarkers. A fraction of cells in both cultures matures into morphologically distinct neurons after 10 days in B27 and BDNF; however, aged NPCs form significantly fewer neurons than young NPCs (p < 0.05, Fig. 2E). A high fraction of astrocytic differentiation was observed in young and aged cultures after as little as 4 days of exposure to fetal bovine serum; however, significantly more astrocytes were observed in aged cultures (p < 0.05, Fig. 2E). In addition, astrocytic morphology appeared more frequently protoplasmic in young cultures and more fibrous in aged cultures.
FIGURE 2.
Neuronal differentiation is impaired in aged NPCs. Young adult NPCs (A and B) and aged adult NPCs (C and D) were subjected to optimized differentiation protocols in vitro. Young adult NPCs (A) differentiated into significantly more MAP2+ neurons than aged adult NPCs (C), when plated under permissive conditions (E, p < 0.05; error bars, S.E.). Young NPCs (B) differentiated into significantly fewer glial fibrillary acidic protein-positive (GFAP+) astrocytes than aged NPCs (D), when plated in serum (E, p < 0.05). Scale bars, 10 μm.
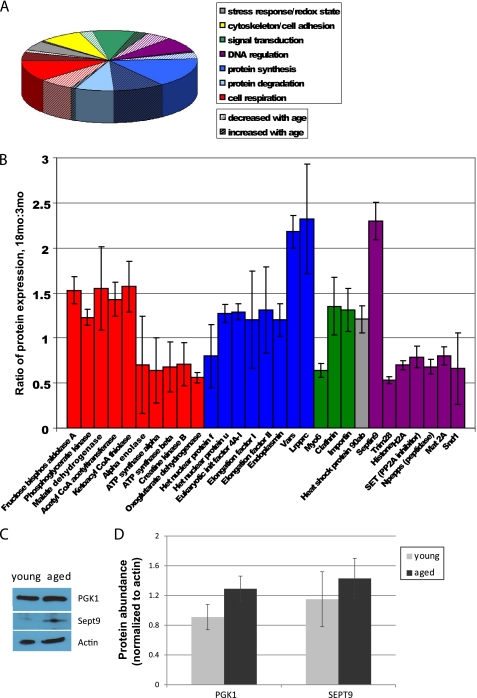
To characterize changes in protein expression during cellular aging, we subjected isotope-labeled cellular lysates of primary cultured young and aged adult mouse NPCs to a comparative MS/MS-based comparative proteomic analysis and mapped identified proteins by cellular pathway. We identified a total of 124 proteins (Fig. 3A and supplemental Table 1); of these, 29 had significant age-related differential abundance (Fig. 3B). Approximately one-fifth of total proteins, and one-third of proteins with significant age-related changes in expression, have metabolic functions. We observed significant increases in enzymes necessary for glycolysis such as phosphoglycerate kinase 1 and significant decreases in nuclear encoded subunits of Complex V of the mitochondrial electron transport chain (ATP synthases α and β). We attempted to verify findings on select proteins using Western blot analysis. We observed a 41% increase in phosphoglycerate kinase 1 and a 25% increase in septin 9 (Fig. 3C). With relatively small changes in protein abundance, analysis using Western blot densitometry techniques did not reach statistical significance (p > 0.05, Fig. 3D), but the trends observed in the proteins tested do agree with the results of the mass spectrometry-based assay.
FIGURE 3.
Comparative proteomics assay reveals age-related changes in metabolic protein expression. A, 124 proteins were identified by MS/MS and grouped by pathway. B, identified proteins with significant age-related differences are shown (error bars, S.D.). Few changes were observed in proteins involved in cytoskeletal maintenance, cell-cell adhesion, stress response, redox state, or protein degradation. Significant age-related decreases were observed primarily in signal transduction, transcriptional regulation, and aerobic respiration (ATP synthesis), whereas significant age-related increases in protein expression were observed primarily in signal transduction, protein synthesis, and anaerobic respiration. C, Western blot analyses were performed to measure the abundance of several proteins identified using MS/MS, including phosphoglycerate kinase (PGK1) and septin 9 (Sept9). D, a 41% increase in phosphoglycerate kinase 1 and a 25% increase in septin 9 were observed, although these changes were not statistically significant (p > 0.05; error bars, S.E.).
If observed proteomic differences are due to metabolic reprogramming in aged NPCs, one might expect changes in mitochondrial number or function. Therefore, we further investigated the mitochondrial and metabolic function of primary cultured NPCs from the young and aged brain.
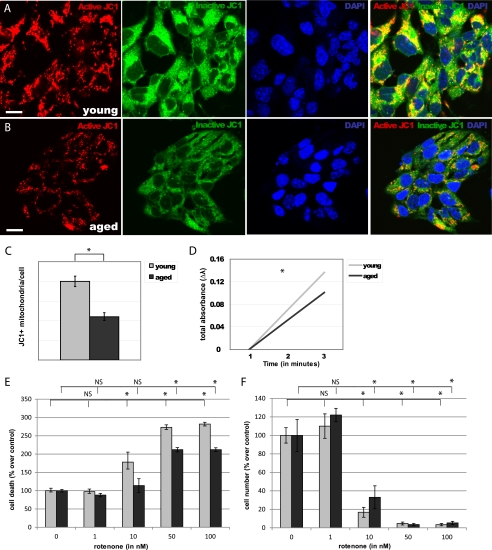
To establish the effects of aging on mitochondria, we assayed the number of active mitochondria (JC1+) in NPCs isolated from the young (Fig. 4A) and aged (Fig. 4B) adult mouse forebrain. We observed a 45% decrease in JC1+ mitochondria/cell in aged NPCs, compared with young adult NPCs (p < 0.0001, Fig. 4C). Consistent with a decline in quantity of active mitochondria, we observed a 26% decrease in citrate synthase activity in aged NPCs, compared with young NPCs (p < 0.01, Fig. 4D).
FIGURE 4.
Aged NPCs have fewer mitochondria and are resistant to rotenone toxicity. A and B, numbers of JC1+ mitochondria (red) were quantified in young adult (A) and aged adult (B) NPCs. Scale bars, 5 μm. C, a significant decrease in JC1+ mitochondria/cell was observed in aged NPCs (p < 0.0001; error bars, S.E.). D, a significant decrease in citrate synthase activity was observed in aged NPCs (p < 0.01). E and F, cell viability (E) and cell number (F) significantly decreased in both young and aged NPCs upon exposure to 50 nm and 100 nm of rotenone; viability of young NPCs also significantly decreased after exposure to 10 nm rotenone (p < 0.01), whereas aged NPCs were unaffected (p > 0.05).
To determine the functional importance of mitochondrial number for cell survival, we treated NPCs with various concentrations of the mitochondrial inhibitor rotenone (Fig. 4, E and F). Viability of both young and aged cells significantly decreased after exposure to 50 nm and 100 nm of rotenone for 4 days (p < 0.0001). Viability of young NPCs also significantly decreased after exposure to 10 nm rotenone (p < 0.01), whereas viability of aged NPCs was unaffected at this concentration (p > 0.05). The dose at which 50% lethality is observed (LD50) of rotenone was 37.5 nm for young cells and 77.5 nm for aged cells. Together, these results suggest that mitochondrial quantity contributes to age-specific cellular function.
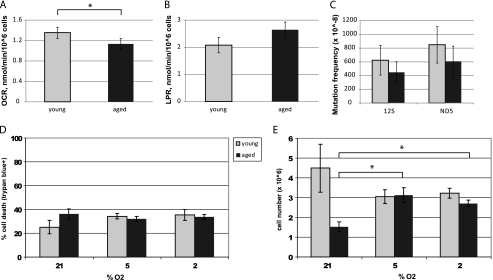
We then measured aerobic and anaerobic metabolism in flow culture chambers fitted to quantify multiple metabolic endpoints in two independent samples simultaneously (Fig. 5). Aged NPCs consumed significantly less oxygen than young NPCs (p < 0.01, Fig. 5A). Aged adult NPCs produce more lactate, a by-product of glycolysis, than young adult NPCs, although this result was not significant (p = 0.16, Fig. 5B). The reduced oxygen consumption rate with age is consistent with a decrease in mitochondrial number.
FIGURE 5.
Aged NPCs have decreased aerobic activity and a proliferative response to lowered oxygen conditions. A, oxygen consumption rate (OCR) was significantly lower in aged cells (p < 0.01; error bars, S.E.). B, lactate production rate (LPR) was higher in aged cells, although not significantly so (p = 0.16). C, no significant differences in mutation frequency were observed between young and aged NPCs at either locus tested: 12 S rRNA and ND5 (p > 0.05). D and E, viability (D) and cell number (E) under various oxygen conditions are shown. Aged cells were less viable than young cells (p < 0.05) and had a significantly lower cell count (p < 0.001) under ambient laboratory conditions (21% O2). Young NPCs had no significant changes in viability or cell number under varying oxygen conditions (p > 0.05). Aged NPCs significantly increased cell number under 5% or 2% oxygen conditions (p < 0.01 and p < 0.001, respectively), without any changes in cell viability (p > 0.05).
Because age-related increases in genomic instability can contribute to mitochondrial decline, we hypothesized that aged NPCs may have increased mutation rates within the mtDNA. Surprisingly, no significant age-related differences in mtDNA mutation frequency were observed, suggesting that losses of functional mtDNA-encoded genes do not underlie the observed mitochondrial deficits (Fig. 5C).
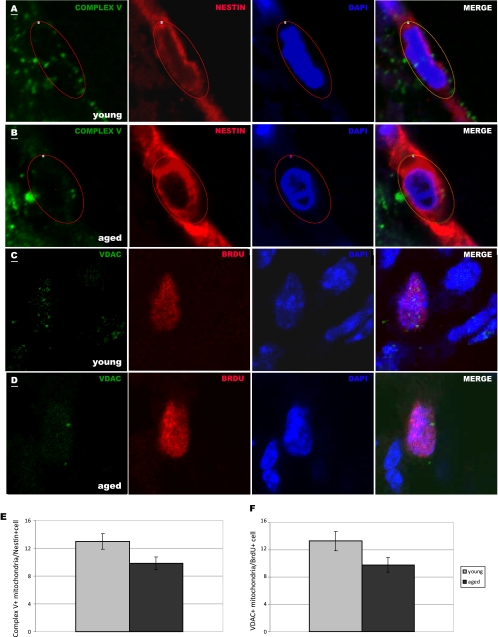
An important microenvironmental condition in many neuropathological states is hypoxia. To determine cellular responses to hypoxia, we exposed NPCs to 21% O2 (ambient laboratory conditions), 5% O2 (normoxic conditions), or 2% O2 (hypoxic conditions) and measured cell number and viability. We observed that aged cells were less viable than young cells (p < 0.05) and had a significantly lower cell count (p < 0.001), after 4 days in ambient laboratory conditions (Fig. 5, D and E). Interestingly, aged NPCs, but not young NPCs, had increased cell number without changes in viability under lowered oxygen conditions (p < 0.01 at 5% O2 and p < 0.001 at 2% O2, Fig. 5E). These results suggest that aged NPCs adapt more readily than young NPCs to changes in O2 concentration. To test the relevance of our results to NPCs in vivo, we quantified the number of mitochondria in NPCs in the young adult (Fig. 6A and C) and aged adult (Fig. 6, B and D) SVZ. Little to no staining of mitochondria was observed in the DAPI+ nuclear region, but labeled mitochondria were observed in the perinuclear area in nearby optical planes. We observed 38% fewer Nestin+ and 55% fewer BrdU+ NPCs in the aged SVZ (p < 0.001), signifying an age-related decrease in proliferative progenitor cells. We quantified Complex V+ mitochondria in young adult (Fig. 6A) and aged adult (Fig. 6B) Nestin+ NPCs and found a significant decrease with age (p < 0.05, Fig. 6E). This may be due to a decrease in Complex V protein specifically or decrease in Complex V-containing mitochondria. To determine whether mitochondria themselves are lost in aging NPCs, we used a pan-mitochondrial antibody against the VDAC, also known as mitochondrial porin. We quantified VDAC+ mitochondria in proliferating, BrdU+ NPCs in the young adult (Fig. 6C) and aged adult (Fig. 6D) SVZ and found a significant age-related decrease in VDAC+ mitochondria (Fig. 6F). These findings verify the results from our proteomic comparison, which shows decreased expression of Complex V subunits (specifically, ATP synthases α and β) in aged NPCs, and the results from our cellular assays, which show decreased numbers of functional mitochondria in aged NPCs.
FIGURE 6.
Aged NPCs contain fewer Complex V+ mitochondria in vivo. A and B, Nestin-labeled NPCs (red) with DAPI-labeled nuclei (blue) within the young adult (A) and aged adult (B) SVZ contain perinuclear Complex V+ mitochondria (green). C and D, BrdU-labeled NPCs (red) with DAPI-labeled nuclei (blue) within the young (C) and aged (D) SVZ contain perinuclear VDAC+ mitochondria (green). Scale bars, 1 μm. A single representative optical plane representing mitochondria is overlapped with a nearby optical plane showing nuclear staining in each photomicrograph. Complex V+ mitochondria were counted within circled regions of interest in the perinuclear region of Nestin+ cells (A and B); VDAC+ mitochondria were counted within the perinuclear region of BrdU+ cells. E and F, aged NPCs contained, on average, 24% fewer Complex V+ mitochondria (E, p < 0.05) and 26% fewer VDAC+ mitochondria (F, p < 0.05) per cell compared with young NPCs.
DISCUSSION
Primary cultured NPCs from the aged adult mouse forebrain grow more slowly and produce fewer neurons than those from the young adult forebrain. Results from the serial dilution assay support the notion that there are fewer stem-like cells in aged cultures, because cells derived from the aged forebrain form fewer spheres at nearly every dilution tested (Fig. 1). These data agree with previous results demonstrating that fewer numbers of NPCs in aged cultures are capable of forming neurosphere colonies (5). In addition, fewer NPCs in aged cultures are able to differentiate into neurons with mature immunophenotypes.
Mechanisms underlying the proliferative deficits of NPCs in the aging brain have focused on cell cycle regulatory proteins (5, 6, 25, 26) and availability of extrinsic growth factors (7, 8, 27–29). Meanwhile, mitochondrial changes during aging have been investigated in other systems (15, 17, 18). This study is the first investigation into mitochondria and metabolism in aging NPCs. We have identified an altered metabolic physiology that is consistent with decreased mitochondrial mass and decreased expression of rate-limiting enzymes in aerobic metabolic pathways. Together, these results suggest that regulation of metabolic machinery, including mitochondrial quantity and proteomic content, contributes to age-specific metabolic strategies utilized by NPCs. These data provide a cellular mechanism underlying the increased proliferative response of aged NPCs to hypoxic conditions, which has been reported in vivo (30, 31). It is possible that the more anaerobic metabolic strategy favored by aged cells may be due to a predisposition of individual cells toward an astrocytic, lactate-secreting phenotype.
The data presented in this study suggest that aging is correlated with a loss of mitochondria and oxidative metabolism in NPCs. Mitochondrial mass and aerobic activity are correlated, as might be expected; aged NPCs that show a 26% decrease in citrate synthase activity also show a 16% decrease in oxygen consumption. Oxygen consumption rates by young adult NPCs under base-line conditions correlate well with oxygen consumption rates of adult cortical neurons and astrocytes (32, 33). However, the oxygen consumption rates of aged adult NPCs under base-line conditions are significantly decreased. The consistency between cellular structure and physiology is further displayed in response to rotenone treatment and lowered oxygen conditions, in that aged cells appear to have a tolerance for both.
Rotenone is a mitochondrial complex I inhibitor, preventing oxidation of NADH to NAD+ by metabolic substrates. Aged NPCs are more resistant to pharmacological inhibition of complex I than young NPCs. The LD50 upon rotenone treatment is 37.5 nm for young cells and 77.5 nm for aged cells, whereas 10 nm rotenone is sufficient to induce cell death in primary dopamine neuron culture (34, 35), and 150 nm rotenone is sufficient to induce cell death in SH-SY5Y neuroblastoma cells (36). Aged NPCs even showed a spike in cell number after treatment with low doses of rotenone. Cells also showed an age-related difference in response to altered oxygen conditions. Aged NPCs significantly increased total viable cell number under 5% or 2% oxygen conditions. This effect appears to be due to an increase in proliferation, as cell viability in both young and aged NPC cultures was not affected in response to altered oxygen conditions.
NPCs do not increase the frequency of mtDNA mutations over the lifespan, suggesting that deficits in aerobic metabolism are unlikely to be caused by insufficient transcription of mtDNA encoding necessary subunits of electron transport chain enzymes. Surprisingly, this assay revealed that mitochondrial mutation rate actually decreased (albeit nonsignificantly) in aged NPCs. The mutations observed could be associated with damage due to reactive oxygen species (37). Perhaps lower rates of aerobic respiration in aged NPCs produce less reactive oxygen species, which then cause fewer mutations. The random mutation capture assay does not test for accumulation of mitochondrial mutations, but the frequency at which mtDNA mutations occur. Alternatively, fusion and fission of mitochondria within the same cell may serve to remove mutated and useless mtDNA (38). Lower mitochondrial number may be due to elimination.
In support of a non-mtDNA-based deficit, the comparative proteomic analysis identified age-related changes in nuclear-encoded subunits of metabolic proteins. Specifically, this MS/MS-based approach yielded a decreased abundance of nuclear encoded subunits of the electron transport chain Complex V, namely ATP synthase α and β, in aged NPCs. This finding was verified in vivo (Fig. 6). Interestingly, our mitochondrial counts in the young and aged SVZ suggest that decreases in Complex V scale with mitochondrial number. The proteomic comparison also yielded increases in abundance of rate-limiting enzymes in glycolysis and the citric acid cycle. Age-related increases in anaerobic metabolic machinery may partially compensate for deficits in electron transport chain machinery.
Together, these findings suggest a coordinated shift in protein expression, subcellular structure, and metabolic physiology in aging NPCs, allowing resistance to hypoxia and mitochondrial inhibition. This metabolic reprogramming may provide insight into mechanisms that drive the dramatic age-dependent outcomes for neurologic diseases including stroke, trauma, and brain cancer.
Supplementary Material
Acknowledgments
We thank Denise Inman and Georgios Karamanlidis for valuable discussions and Denise Kuok, Nolan Ericson, and Catherine Pan for technical assistance.
This work was supported, in whole or in part, by National Institutes of Health Grants AG029406 (to R. C. R. and P. J. H.) NSO46724 (to P. J. H.), and DK17047 (to I. R. S. and the Diabetes Endocrinology Research Center).

The on-line version of this article (available at http://www.jbc.org) contains supplemental Table 1.
- NPC
- neural progenitor cell
- MS/MS
- tandem mass spectrometry
- SVZ
- subventricular zone
- VDAC
- voltage-dependent anion channel.
REFERENCES
- 1. Kuhn H. G., Dickinson-Anson H., Gage F. H. (1996) J. Neurosci. 16, 2027–2033 [DOI] [PMC free article] [PubMed] [Google Scholar]
- 2. Jin K., Sun Y., Xie L., Batteur S., Mao X. O., Smelick C., Logvinova A., Greenberg D. A. (2003) Aging Cell 2, 175–183 [DOI] [PubMed] [Google Scholar]
- 3. Drapeau E., Mayo W., Aurousseau C., Le Moal M., Piazza P. V., Abrous D. N. (2003) Proc. Natl. Acad. Sci. U.S.A. 100, 14385–14390 [DOI] [PMC free article] [PubMed] [Google Scholar]
- 4. Siwak-Tapp C. T., Head E., Muggenburg B. A., Milgram N. W., Cotman C. W. (2007) Neurobiol. Learn. Mem. 88, 249–259 [DOI] [PMC free article] [PubMed] [Google Scholar]
- 5. Molofsky A. V., Slutsky S. G., Joseph N. M., He S., Pardal R., Krishnamurthy J., Sharpless N. E., Morrison S. J. (2006) Nature 443, 448–452 [DOI] [PMC free article] [PubMed] [Google Scholar]
- 6. Jablonska B., Aguirre A., Vandenbosch R., Belachew S., Berthet C., Kaldis P., Gallo V. (2007) J. Cell Biol. 179, 1231–1245 [DOI] [PMC free article] [PubMed] [Google Scholar]
- 7. Cameron H. A., McKay R. D. (1999) Nat. Neurosci. 2, 894–897 [DOI] [PubMed] [Google Scholar]
- 8. Palmer T. D., Willhoite A. R., Gage F. H. (2000) J. Comp. Neurol. 425, 479–494 [DOI] [PubMed] [Google Scholar]
- 9. Mikheev A. M., Stoll E. A., Mikheeva S. A., Maxwell J. P., Jankowski P. P., Ray S., Uo T., Morrison R. S., Horner P. J., Rostomily R. C. (2009) Aging Cell 8, 499–501 [DOI] [PMC free article] [PubMed] [Google Scholar]
- 10. Robey R. B., Hay N. (2009) Semin. Cancer Biol. 19, 25–31 [DOI] [PMC free article] [PubMed] [Google Scholar]
- 11. Matoba S., Kang J. G., Patino W. D., Wragg A., Boehm M., Gavrilova O., Hurley P. J., Bunz F., Hwang P. M. (2006) Science 312, 1650–1653 [DOI] [PubMed] [Google Scholar]
- 12. Sheng H., Niu B., Sun H. (2009) Curr. Med. Chem. 16, 1561–1587 [DOI] [PubMed] [Google Scholar]
- 13. Warburg O. (1956) Science 124, 269–270 [PubMed] [Google Scholar]
- 14. Alcantara Llaguno S., Chen J., Kwon C. H., Jackson E. L., Li Y., Burns D. K., Alvarez-Buylla A., Parada L. F. (2009) Cancer Cell 15, 45–56 [DOI] [PMC free article] [PubMed] [Google Scholar]
- 15. Kujoth G. C., Hiona A., Pugh T. D., Someya S., Panzer K., Wohlgemuth S. E., Hofer T., Seo A. Y., Sullivan R., Jobling W. A., Morrow J. D., Van Remmen H., Sedivy J. M., Yamasoba T., Tanokura M., Weindruch R., Leeuwenburgh C., Prolla T. A. (2005) Science 309, 481–484 [DOI] [PubMed] [Google Scholar]
- 16. Winklhofer K. F., Haass C. (2010) Biochim. Biophys. Acta 1802, 29–44 [DOI] [PubMed] [Google Scholar]
- 17. Trifunovic A. (2006) Biochim. Biophys. Acta 1757, 611–617 [DOI] [PubMed] [Google Scholar]
- 18. Vermulst M., Wanagat J., Kujoth G. C., Bielas J. H., Rabinovitch P. S., Prolla T. A., Loeb L. A. (2008) Nat. Genet. 40, 392–394 [DOI] [PubMed] [Google Scholar]
- 19. Richardson J. R., Caudle W. M., Guillot T. S., Watson J. L., Nakamaru-Ogiso E., Seo B. B., Sherer T. B., Greenamyre J. T., Yagi T., Matsuno-Yagi A., Miller G. W. (2007) Toxicol. Sci. 95, 196–204 [DOI] [PubMed] [Google Scholar]
- 20. Petit A., Sellers D. L., Liebl D. J., Tessier-Lavigne M., Kennedy T. E., Horner P. J. (2007) Proc. Natl. Acad. Sci. U.S.A. 104, 17837–17842 [DOI] [PMC free article] [PubMed] [Google Scholar]
- 21. Tropepe V., Sibilia M., Ciruna B. G., Rossant J., Wagner E. F., van der Kooy D. (1999) Dev. Biol. 208, 166–188 [DOI] [PubMed] [Google Scholar]
- 22. McLaughlin P., Zhou Y., Ma T., Liu J., Zhang W., Hong J. S., Kovacs M., Zhang J. (2006) Glia 53, 567–582 [DOI] [PubMed] [Google Scholar]
- 23. Sweet I. R., Khalil G., Wallen A. R., Steedman M., Schenkman K. A., Reems J. A., Kahn S. E., Callis J. B. (2002) Diabetes Technol. Ther. 4, 661–672 [DOI] [PubMed] [Google Scholar]
- 24. Vermulst M., Bielas J. H., Kujoth G. C., Ladiges W. C., Rabinovitch P. S., Prolla T. A., Loeb L. A. (2007) Nat. Genet. 39, 540–543 [DOI] [PubMed] [Google Scholar]
- 25. Medrano S., Burns-Cusato M., Atienza M. B., Rahimi D., Scrable H. (2009) Neurobiol. Aging 30, 483–497 [DOI] [PMC free article] [PubMed] [Google Scholar]
- 26. Caporaso G. L., Lim D. A., Alvarez-Buylla A., Chao M. V. (2003) Mol. Cell. Neurosci. 23, 693–702 [DOI] [PubMed] [Google Scholar]
- 27. Enwere E., Shingo T., Gregg C., Fujikawa H., Ohta S., Weiss S. (2004) J. Neurosci. 24, 8354–8365 [DOI] [PMC free article] [PubMed] [Google Scholar]
- 28. Fabel K., Kempermann G. (2008) Neuromolecular Med. 10, 59–66 [DOI] [PubMed] [Google Scholar]
- 29. Fabel K., Tam B., Kaufer D., Baiker A., Simmons N., Kuo C. J., Palmer T. D. (2003) Eur. J. Neurosci 18, 2803–2812 [DOI] [PubMed] [Google Scholar]
- 30. Popa-Wagner A., Badan I., Walker L., Groppa S., Patrana N., Kessler C. (2007) Acta Neuropathol. 113, 277–293 [DOI] [PubMed] [Google Scholar]
- 31. Jin K., Wang X., Xie L., Mao X. O., Zhu W., Wang Y., Shen J., Mao Y., Banwait S., Greenberg D. A. (2006) Proc. Natl. Acad. Sci. U.S.A. 103, 13198–13202 [DOI] [PMC free article] [PubMed] [Google Scholar]
- 32. Rose S. P. (1967) Biochem. J. 102, 33–43 [DOI] [PMC free article] [PubMed] [Google Scholar]
- 33. Dienel G. A., Cruz N. F. (2006) Neurochem. Int. 48, 586–595 [DOI] [PubMed] [Google Scholar]
- 34. Choi W. S., Kruse S. E., Palmiter R. D., Xia Z. (2008) Proc. Natl. Acad. Sci. U.S.A. 105, 15136–15141 [DOI] [PMC free article] [PubMed] [Google Scholar]
- 35. Radad K., Gille G., Rausch W. D. (2008) Toxicol. in Vitro 22, 68–74 [DOI] [PubMed] [Google Scholar]
- 36. Hajieva P., Mocko J. B., Moosmann B., Behl C. (2009) J. Neurochem. 110, 118–132 [DOI] [PubMed] [Google Scholar]
- 37. Yu D., Berlin J. A., Penning T. M., Field J. (2002) Chem. Res. Toxicol. 15, 832–842 [DOI] [PubMed] [Google Scholar]
- 38. Dani M. A., Dani S. U. (2010) Med. Hypotheses 74, 1021–1025 [DOI] [PubMed] [Google Scholar]
Associated Data
This section collects any data citations, data availability statements, or supplementary materials included in this article.


